
Analysis of Power Quality in Industrial Environments Using
Synchronous Machines: A Case Study
George-Andrei Marin
a
and Marian Gaiceanu
b
Department of Electrical Engineering and Energy Conversion Systems, Faculty of Automation, Computers, Electrical and
Electronics Engineering, “Dunarea de Jos” University of Galati, Romania
Keywords: Power Quality, Synchronous Machine, Power Factor, Reactive Power, PQ Monitoring.
Abstract: This paper investigates the impact of synchronous machines on power quality in industrial environments.
Synchronous machines, widely used in high-power applications, can improve various power quality issues
such as reactive power imbalance, low power factor, and harmonic distortion. This study is focused on the
power quality analysis in a heavy steel industry. As a solution to power quality issues analyses on the 4.2
MW/10 kV synchronous motor operation in a hot strip rolling mill is performed, under variable load
conditions. The main necessary waveforms have been captured over several days, including voltage, current
waveforms, power factor variations, and reactive power levels. To assess total harmonic distortion (THD),
power factor performance, and overall power quality, the collected data has been analyzed. In order to
maintain power quality within acceptable limits, the experimental obtained results show that the reactive
power compensation and power factor correction acts as key points. The paper highlights the need for
continuous monitoring and intelligent control strategies in facilities operating with synchronous machines.
This case study serves as a practical example of how industrial systems can assess and mitigate the adverse
effects of power quality disturbances.
1 INTRODUCTION
Power quality (PQ) is a critical issue in modern
electrical engineering, particularly in industrial
environments where large power demands, complex
machinery, and continuous processes impose
significant challenges on electrical infrastructure.
Power quality (PQ) refers to maintaining voltage,
current, and frequency within prescribed limits to
ensure the reliable operation of electrical equipment.
In industrial environments, power quality is a critical
issue due to the presence of high-power loads, non-
linear devices, and sensitive equipment. Poor power
quality can lead to increased losses, unexpected
equipment shutdowns, inaccurate measurements,
overheating of transformers and cables, and
ultimately, financial loss and reduced productivity
(Bollen, 2000). For energy-intensive industries, such
as steel manufacturing, chemical processing, or
mining, maintaining acceptable PQ levels is essential
a
https://orcid.org/ 0009-0006-5205-132X
b
https://orcid.org/
0000-0003-0582-5709
not only for internal efficiency but also for complying
with international standards and grid codes.
One of the most significant contributors to power
quality issues in industrial systems is the presence of
rotating electrical machines, particularly synchronous
machines. Synchronous Generators provide stable
voltage and frequency when properly regulated; can
supply or absorb reactive power by adjusting
excitation; are sensitive to load changes — transient
behavior can impact PQ. Synchronous machines are
widely used in heavy industries for power generation
in motor regimes due to their ability to regulate
voltage and maintain power factor through excitation
control. However, under certain conditions,
especially in processes with fast load changes or
torque variations, synchronous machines can act as
sources of power disturbances such as voltage sags,
harmonic distortion, flicker, and low power factor
(Akagi, 2005).
Marin, G.-A. and Gaiceanu, M.
Analysis of Power Quality in Industrial Environments Using Synchronous Machines: A Case Study.
DOI: 10.5220/0014368600004848
Paper published under CC license (CC BY-NC-ND 4.0)
In Proceedings of the 2nd International Conference on Advances in Electrical, Electronics, Energy, and Computer Sciences (ICEEECS 2025), pages 219-228
ISBN: 978-989-758-783-2
Proceedings Copyright © 2026 by SCITEPRESS – Science and Technology Publications, Lda.
219

Role of Synchronous Machines in Power Quality:
-Synchronous Generators provide stable
voltage and frequency when properly regulated; can
supply or absorb reactive power by adjusting
excitation; are sensitive to load changes — transient
behavior can impact PQ.
- Synchronous motors, often used in high-power
applications (e.g., compressors, crushers), can be
over-excited to act as synchronous condensers,
improving power factor; help stabilize voltage by
injecting reactive power into the system.
- Synchronous condensers operate as standalone
over-excited synchronous machines without
mechanical load; used specifically for voltage
regulation and reactive power compensation;
improve power factor and stabilize weak grids.
Common power quality issues in Industrial
environments could be mentioned as follows: voltage
sags and swells – due to motor starting, faults, or large
load switching; harmonics – from variable frequency
drives (VFDs), arc furnaces, or other non-linear
loads; flicker – from rapidly changing loads;
unbalance – from uneven distribution of single-phase
loads; frequency variations – in isolated industrial
power systems; power factor issues – leading to
inefficiencies and penalties.
This paper focuses on the analysis of power
quality in an industrial setting, centered around a 4.2
MW synchronous machine operating at 10 kV in a hot
strip rolling mill. The steel rolling process is one of
the most energy-intensive and dynamically variable
industrial applications. Sudden mechanical stress,
frequent start/stop cycles, and fluctuating loads
impose transient conditions on the synchronous
motor, often leading to variations in reactive power
demand and harmonic emissions. These disturbances
propagate through the electrical system, influencing
the stability and efficiency of both the local and
upstream network (Ghosh and Ledwich, 2002).
The motivation behind this work is threefold:
• To understand and quantify the contribution
of a large synchronous machine to overall
PQ degradation;
• To assess how current international
standards apply to such installations;
• To propose technical and operational
improvements using modern analysis
techniques and reactive power management
strategies.
A number of standards and regulatory
frameworks govern power quality performance in
industrial and public networks. IEEE 519 (2014)
provides recommended limits for harmonic distortion
(both voltage and current) at the point of common
coupling (PCC), based on system voltage and short-
circuit capacity. The European standard EN 50160
specifies acceptable variations in voltage magnitude,
frequency, flicker, unbalance, and harmonics for
public distribution systems (CENELEC, 2010).
Additionally, IEC 61000-4-30 outlines methods for
measuring power quality parameters in Class A
compliance monitoring systems. In this study,
compliance with these standards serves as a
benchmark for evaluating the observed data.
Beyond regulatory constraints, industries have an
operational incentive to monitor and manage power
quality proactively. Poor PQ can cause excessive
wear on equipment, reduce the lifetime of power
electronics, trip sensitive control systems, and
interfere with communication networks. From an
economic perspective, inefficient use of reactive
power leads to increased energy bills and potential
penalties from utility companies, especially in
countries where reactive energy is billed separately
(IEA, 2019). For a 4.2 MW motor operating
continuously under suboptimal conditions, the
additional energy losses alone can reach tens of
thousands of euros per year.
The technical complexity of managing PQ in
synchronous machine-driven systems lies in the dual
nature of the machine: as both a consumer and
potential source of reactive power, its behaviour
varies depending on excitation level, load torque, and
process dynamics. Under overexcitation, the machine
injects reactive power into the system, potentially
raising voltage beyond acceptable levels. Under
excitation, it consumes reactive power, increasing the
burden on compensation equipment. This requires
tight coordination with capacitor banks,
STATCOMs, or other power electronic devices to
avoid system instability (Arrillaga and Watson,
2003).
One of the modern approaches for PQ
improvement involves advanced monitoring systems
capable of detecting and analysing fast transient
events. Equipment compliant with IEC 61000-4-30
Class A standards allows high-resolution data
logging, real-time harmonic analysis (via FFT), and
event-triggered waveform capture. These features are
essential in rolling mill applications, where load
changes can occur in milliseconds. In this study, a
Class A analyser was installed at the motor terminal,
collecting data over a period of several days during
normal operation and planned stress-testing events.
The data acquisition included measurements of:
• Phase voltages and currents (RMS and
instantaneous),
ICEEECS 2025 - International Conference on Advances in Electrical, Electronics, Energy, and Computer Sciences
220

• Active (P), reactive (Q), and apparent (S)
power,
• Power factor and displacement power factor,
• Voltage and current THD and individual
harmonic orders,
• Frequency deviations,
• Event logs (sags, swells, transients).
Collected data revealed periods of significant
deviation from IEEE 519 limits, particularly under
load transitions. Power factor fluctuated below 0.85
during start-up, while harmonic distortion of current
reached values above 10% at times—exceeding the
5% limit imposed for systems at 10 kV. Reactive
power fluctuations were also observed, indicating an
unoptimized excitation system. These findings
underline the need for dynamic reactive power
compensation and smarter excitation control
algorithms.
In addition to field measurements, the study
includes a simulation-based analysis using a detailed
model of the synchronous machine and associated
network components. This enables comparative
evaluation of measured and predicted behaviours,
identification of resonances, and testing of mitigation
techniques such as active filters and excitation
controllers. Simulation results confirm the critical
role of machine dynamics in influencing system PQ,
particularly under step changes in mechanical load
and during synchronization sequences.
With the rise of Industry 4.0 and digital twin
technologies, the concept of integrating PQ
monitoring with process control is gaining traction. In
modern industrial plants, the electrical system is no
longer isolated from production objectives—it must
adapt dynamically to load demands, system
configurations, and energy efficiency goals. This
integration requires reliable data, scalable analytics,
and intelligent decision-making frameworks. In this
context, synchronous machines—despite their robust
nature—must be carefully integrated using digital
control systems that account for their PQ impact.
By providing a detailed analysis based on both
field data and simulation, this study contributes to the
growing body of work on power quality in heavy
industry and offers practical recommendations for
engineers, energy managers, and automation
specialists working with high-power rotating
machines. Be advised that papers in a technically
unsuitable form will be returned for retyping. After
returned the manuscript must be appropriately
modified.
2 METHODOLOGY
This chapter outlines the methodological framework
applied to analyse power quality (PQ) in an industrial
environment using a 4.2 MW synchronous machine
operating at 10 kV. The methodology integrates real-
world measurements, simulation modeling, and
reference to international standards to assess the
impact of the synchronous machine on power quality
under normal and dynamic operating conditions.
2.1 Methodological Framework
The approach consists of three main stages:
• Field Data Acquisition – Real-time
monitoring of
• electrical and process parameters using
high-accuracy instruments.
• Standards-Based Evaluation – Comparing
results with thresholds and guidelines set by
IEEE 519 (2014), EN 50160 (CENELEC,
2010), and IEC 61000-4-30 (IEC, 2015).
• Simulation-Based Modelling and
Validation – Developing a dynamic
simulation model using MATLAB/Simulink
to replicate and analyze machine behavior.
This structured approach ensures that results are
grounded in both measured data and validated
simulations (Bollen, 2000).
2.2 Site Description and
Instrumentation
The case study focuses on a hot strip rolling mills
powered by a 4.2MW synchronous machine. Given
the highly dynamic nature of the process, the machine
is subject to fast and frequent load changes.
Instrumentation used:
• Class A PQ Analyzer (IEC 61000-4-30
compliant): Measured RMS voltage and
current, harmonics (up to 50th order), flicker
(Pst, Plt), transients, and unbalance (IEC,
2015), along with digital fault recorders
(DFRs).
• High-speed Digital Oscilloscope: Captured
fast transients during switching and start-up.
• DAQ Modules Linked to SCADA:
Synchronized process and electrical data
acquisition.
• Excitation Logger: Monitored field current
and voltage to correlate with reactive power
dynamics (Wildi, 2006; Ghosh & Ledwich,
2002).
Analysis of Power Quality in Industrial Environments Using Synchronous Machines: A Case Study
221

Instruments were synchronized via GPS for
timestamp accuracy and installed at both the machine
terminals and 10 kV switchgear.
2.3 Measurement Campaign and
Scenarios
Measurements were performed over seven days,
capturing the following operating scenarios:
• Machine start-up and synchronization
• Steady-state operation at nominal torque
• Load rejection and underexcitation events
• Rolling mill production with repetitive
dynamic load cycles
• Idle operation and no-load excitation
behaviour.
This range of scenarios provided a complete
picture of the achine’s electrical behaviour under
varied load conditions.
2.4 Key Power Quality Parameters
PQ indicators measured:
• Total Harmonic Distortion (THD):
Voltage and current THD calculated per
IEEE 519 (2014).
• Power Factor (PF) and Displacement PF
(DPF): Observed continuously to track
efficiency and phase displacement (Ghosh &
Ledwich, 2002).
• Active (P), Reactive (Q), and Apparent
Power (S): Assessed under fluctuating
torque conditions.
• Voltage Imbalance: Based on zero and
negative sequence components.
• Voltage Flicker (Pst, Plt): Measured
according to EN 50160 (CENELEC, 2010).
10-minute statistical averages were used to
compare with international PQ limits (IEEE, 2010).
2.5 Analysis Tools and Techniques
Advanced signal processing was applied:
• FFT Analysis: Decomposed waveforms
into harmonic components (Bollen, 2000).
• Time-Correlation Techniques: Aligned
PQ events with machine process variables
(torque, speed, excitation current).
• Energy Loss Estimation: Calculated using
reactive power flows and utility billing
formulas (IEA, 2019).
• Heatmaps and Spectrograms: Visualized
harmonic and power factor variations over
time.
These methods enabled a deep understanding of
how PQ parameters evolved during each operating
condition.
2.6 Simulation Modeling
A detailed simulation of the motor and electrical
system was created in MATLAB/Simulink, based on:
• A sixth-order synchronous machine model
with AVR and excitation dynamics.
• Rolling mill load represented as variable
resistive-inductive with inertia.
• 10 kV feeder and passive elements including
transformers, capacitors.
Reactive compensation modelled via a
STATCOM block (Akagi, 2005).
Simulated scenarios included:
• Load rejection
• Step-torque variation
• AVR failure
• STATCOM integration
Simulation outputs matched key field
observations, confirming the model’s validity.
2.7 Standards Compliance and
Benchmarking
Measured and simulated results were benchmarked
using:
• IEEE 519-2014 – Limits on current and
voltage harmonic distortion at 10 kV PCC.
• EN 50160 – Voltage variation, unbalance,
flicker thresholds (CENELEC, 2010).
• IEC 61000-4-30 – Measurement guidelines
for PQ parameters (IEC, 2015).
• IEEE 1459-2010 – Calculation of active,
reactive, and distortion power in non-
sinusoidal conditions (IEEE, 2010).
• CIGRE C4 Reports – Used for comparing
findings with industry-wide benchmarks
(CIGRE, 2011).
2.8 Uncertainty and Accuracy
Management
• All measurement devices were factory
calibrated.
• Dual-channel acquisition (redundancy)
validated key indicators.
• Uncertainty analysis showed:
ICEEECS 2025 - International Conference on Advances in Electrical, Electronics, Energy, and Computer Sciences
222

Voltage: ±0.2%
Current: ±0.5%
Harmonics: ±5%
Time sync error: <50 ms
• Environmental factors (temperature, noise)
were compensated via software correction.
A 95% confidence interval was used for all key
statistical indicators.
2.9 Data Interpretation Framework
A multi-layered interpretation approach was applied:
• Phase-to-event correlation: Linked dips in
PF or spikes in THD to specific mechanical
actions.
• Pattern recognition: Detected repetitive
PQ disturbances and their root causes.
• Severity classification: Grouped events by
risk level (low, medium, high impact on
PQ).
• Cross-parameter comparison: Compared
PF, Q, and harmonic data in heatmaps to
visualize interaction.
This interpretation framework helped define
thresholds for alarms and operational limits.
2.10 Limitations of the Methodology
Despite its comprehensive nature, the methodology
has limitations:
• Limited monitoring duration may exclude
rare events.
• Simulation models may not fully capture
non-linear losses.
• Excitation behaviour is difficult to isolate in
complex industrial systems.
• System impedance variation is difficult to
model dynamically.
Nevertheless, the use of redundant
instrumentation, standard calibration, and real-time
process correlation minimized the impact of these
limitations.
2.11 Summary of Methodological
Contributions
This chapter described a full-cycle approach for
analysing power quality using:
• Real-world Class A measurement data;
• Simulation with verified machine models;
• Standards-based evaluation per IEEE, EN, and
IEC guidelines;
• Sophisticated interpretation techniques;
• Identification of limitations and corrective
measures.
This methodology enables a detailed assessment
of power quality in complex industrial systems and
lays the foundation for future corrective strategies
discussed in the next chapters.
3 STANDARDIZED METHOD
FOR ANALYSIS POWER
QUALITY
The analysis of power quality (PQ) in industrial
systems must be conducted using standardized
methods to ensure consistency, comparability, and
compliance with regulatory and operational
thresholds. This chapter presents the normative
framework adopted for the assessment of PQ in the
studied system, based on globally accepted standards,
including IEEE 519-2014, EN 50160, IEC 61000-4-
30, and IEEE 1459-2010.
3.1 Importance of Standardization in
PQ Analysis
Standardized PQ methodologies are essential in high-
power industrial environments for three reasons:
• They provide uniform benchmarks for
evaluating voltage and current disturbances.
• They ensure legal and regulatory
compliance with grid codes and supply
agreements.
• They facilitate data comparison across
time, locations, and technologies (Bollen,
2000).
Without a standardized framework, PQ data
would be subject to interpretation, making it difficult
to quantify disturbances, define penalties, or
implement corrective measures (Arrillaga & Watson,
2003).
3.2 Overview of Key Standards
3.2.1 IEEE 519-2014 – Harmonic Control in
Electrical Power Systems
This standard focuses on limiting harmonic distortion
in industrial power systems. It introduces:
• Current THD limits: 5% for individual
harmonics and 8% for total at the point of
common coupling (PCC) for voltages ≥ 1
kV.
Analysis of Power Quality in Industrial Environments Using Synchronous Machines: A Case Study
223

• Voltage THD limits: 3% individual, 5%
total for systems ≥ 69 kV; for 10 kV systems,
limits are typically 5% total.
• Short-circuit ratio (ISC/IL): Harmonic
limits vary depending on the system’s short-
circuit capacity relative to load current.
In the analysed case, with a 10 kV busbar and a
4.2 MW synchronous motor, harmonic levels are
compared against the <8% THD(I) and <5% THD(V)
criteria (IEEE, 2014).
3.2.2 EN 50160 – Voltage Characteristics in
Public Distribution Systems
EN 50160 is the European reference for supply
quality in low, medium, and high voltage public
networks. It defines:
• Voltage variation limits: ±10% of nominal
value during 95% of a week.
• Voltage unbalance: Max 2% for three-phase
systems.
• Flicker limits: Pst ≤ 1.0, Plt ≤ 0.8.
• Frequency variation: 50 Hz ±1% for 99.5% of
the week.
Although primarily for distribution systems, EN
50160 is often used in industrial facilities connected
to public utilities to align internal PQ thresholds with
external expectations (CENELEC, 2010).
3.2.3 IEC 61000-4-30 – Power Quality
Measurement Methods
This standard outlines how PQ should be measured
and reported, ensuring consistency between
instruments. It defines:
• Class A instruments: For regulatory-grade
measurements.
• Measurement intervals: 10-minute for voltage
and frequency, 3-second for flicker.
• Synchronization accuracy: GPS or time-
stamped data required for waveform capture and
event recording.
The PQ analyser used in this study was Class A
compliant and configured according to IEC 61000-4-
30 requirements (IEC, 2015), which guarantees that
measurement data is reliable for evaluation under
IEEE and EN standards.
3.2.4 IEEE 1459-2010 – Power Definitions
Under Non-Sinusoidal Conditions
In real-world industrial systems, voltage and current
are rarely ideal sinusoids. IEEE 1459 extends the
classical definitions of power (P, Q, S) to:
• Distortion power (D): Energy loss due to
harmonics.
• Non-sinusoidal apparent power (Sns):
Combines fundamental and harmonic
contributions.
• Power factor components: Separates
displacement from distortion PF.
These definitions are crucial in assessing the true
efficiency of the synchronous machine and estimating
hidden losses (IEEE, 2010).
3.3 Application of Standards in the
Case Study
The industrial case study presented in this paper
applies the above standards as follows, I present in
table 1:
Table 1: Standards international application.
Standard Parameter
Assessed
Applied Threshold
IEEE 519-
2014
THD(I),
THD(V)
THD(I) < 8%, THD(V)
< 5%
EN 50160 Voltage,
Flicker,
Unbalance
±10%
U<sub>n</sub>, Pst <
1.0,
U<sub>imb</sub> <
2%
IEC 61000-
4-30
Measurement
Consistenc
y
Class A, 10-min avg,
timestampe
d
IEEE 1459-
2010
Power Factor,
Distortion
Powe
r
PF > 0.9, D losses
minimized
All measured and simulated values in this study
were analysed with reference to these limits. For
example:
• Current THD during rolling cycles was
compared with IEEE 519 tables for 10 kV
systems.
• Voltage unbalance was computed using negative
sequence voltage, then compared with EN
50160.
• Distortion power was estimated to assess
additional energy costs from non-sinusoidal
conditions.
3.4 Considerations for Synchronous
Machines
While these standards are broadly applicable,
synchronous machines require some special
considerations:
• Excitation control impacts both voltage stability
and harmonic emission.
ICEEECS 2025 - International Conference on Advances in Electrical, Electronics, Energy, and Computer Sciences
224

• Underexcitation may increase current harmonics
due to poor magnetic coupling.
• Overexcitation may lead to reactive power
injection, raising voltage levels and risking
unbalance.
Therefore, the PQ contribution of synchronous
machines must be assessed not only at the output
terminals but also in terms of excitation system
response (Wildi, 2006; Ghosh & Ledwich, 2002).
3.5 Limitations of Standards in
Industrial Practice
Although comprehensive, these standards do not
account for every industrial context:
• IEEE 519 assumes stable load patterns, which is
not the case in fast-changing rolling mill
operations.
• EN 50160 applies primarily to utility
distribution systems, not internal industrial
buses.
• IEC 61000-4-30 does not specify cause-effect
relationships, only how to measure them.
To bridge this gap, plant-specific thresholds and
time-aligned process analysis are necessary.
3.6 Mitigation and Control Strategies
Reactive Power Compensation using over-excited
synchronous machines for local VAR support;
replacing or supplementing capacitor banks with
synchronous condensers.
Harmonic Mitigation: synchronous machines do not
inherently generate harmonics, unlike inverter-fed
motors; harmonic filters or power electronics can be
added.
Load Balancing and Voltage Support controlled
excitation to stabilize voltage under unbalanced or
variable loading.
Integration with Power Management Systems:
coordinated control of excitation systems with digital
power quality management; SCADA-based
automation for continuous monitoring and correction.
3.7 Summary
This chapter outlined the key standards used to assess
power quality in the studied industrial system. Each
standard contributes a vital component to the PQ
evaluation framework:
• IEEE 519 defines what is acceptable in terms
of harmonic emissions.
• EN 50160 provides voltage quality benchmarks
aligned with utility expectations.
• IEC 61000-4-30 ensures valid and comparable
measurements.
• IEEE 1459 allows for advanced power analysis
under real-world conditions.
These standards, when applied together, form a
robust basis for industrial PQ assessment and for
designing mitigation strategies, such as filter banks,
STATCOMs, or excitation control improvements.
4 CASE STUDY: SYNCHRONOUS
MACHINE 4.2MW/10KV
The case study investigates a synchronous motor
rated at 4.2 MW, 10 kV, and 5500 kVA, which drives
a hot strip rolling mill. The motor is supplied through
a 110/10 kV power transformer and connected via a
10 kV busbar with dedicated switchgear. Three
medium-voltage cubicles ensure proper protection
and isolation of the system, presented in the figure 1.
Key components include:
• Current and voltage transformers (CTs/VTs)
– used for protection and real-time
monitoring of electrical parameters.
• Circuit breakers (12 kV, 1250 A) – provide
safe disconnection under fault conditions.
• Starting resistors – allow the motor to start
in asynchronous mode, reducing inrush
currents during acceleration.
• Excitation system – based on rectifiers and
field control units, which provide dc
excitation current to synchronize the
machine with the supply grid.
• Protection relays – configured for
overcurrent (50/51), earth fault (51n),
thermal protection (49), loss of field (40),
unbalance (46/47),
undervoltage/overvoltage (27/59), and
under/over frequency (81).
The measurement setup includes 800/5/1A CTs
and 12 kV VTs, ensuring accuracy for both metering
and protection relays. The motor’s excitation is
controlled via a digital AVR (automatic voltage
regulator), which ensures stable reactive power
management and power factor correction.
Analysis of Power Quality in Industrial Environments Using Synchronous Machines: A Case Study
225
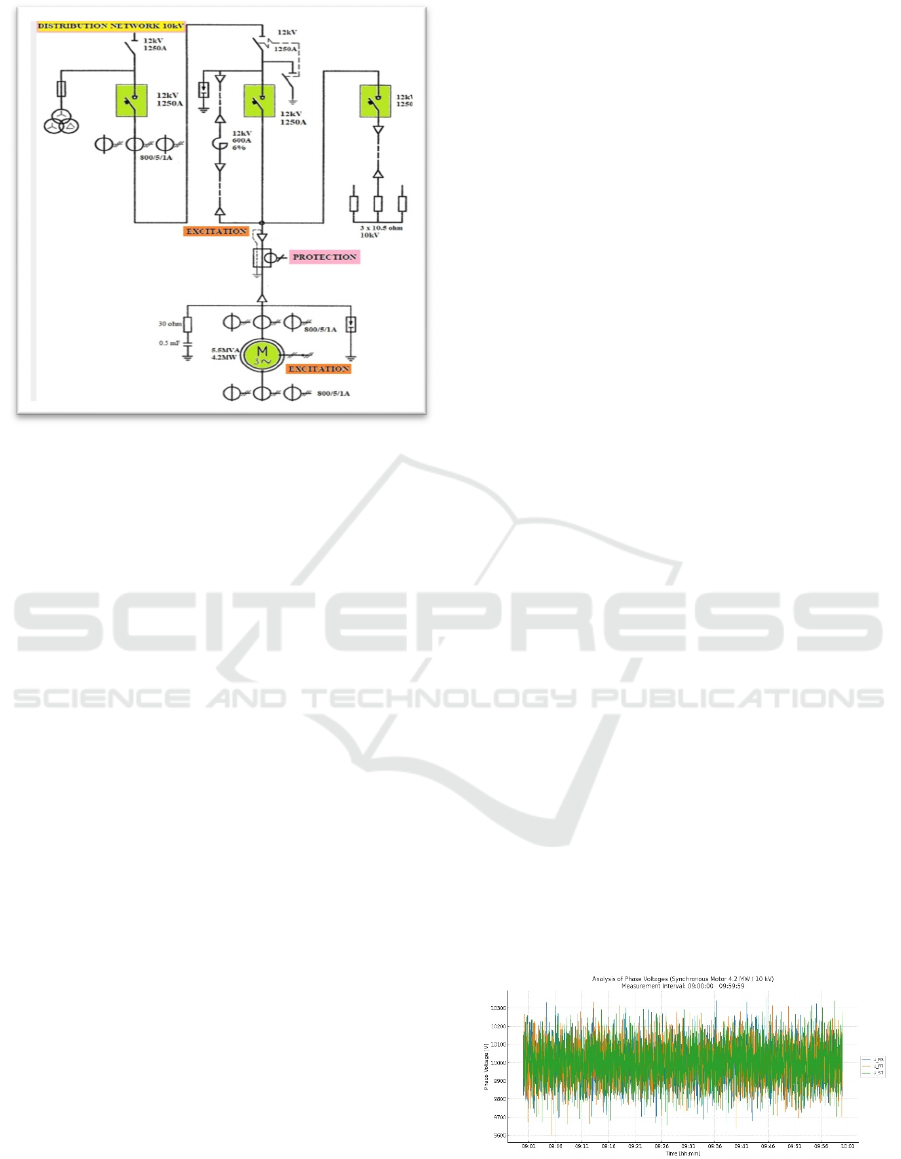
Figure 1: Single-Line Diagram Distribution Network.
This industrial installation is highly dynamic, as
the rolling mill introduces fast load fluctuations,
leading to variations in active/reactive power, voltage
stability, and harmonic distortion. The monitoring
synchronization, steady-state operation, and load
rejection, aiming to evaluate the motor’s influence on
power quality (PQ) according to IEEE519 and
EN50160 standards.
5 RESULTS ANALYSIS FROM
SIMULATION SYNCHRONOUS
MACHINE 4.2MW/10KV
This chapter presents the results obtained from the
dynamic simulation of the 4.2 MW, 10 kV
synchronous motor that drives the hot strip rolling
mill. The simulation model, developed in Python,
integrates the electrical and mechanical
characteristics of the motor, its excitation system, and
the industrial load profile. By replicating real
operating conditions such as startup in asynchronous
mode, synchronization, steady-state operation, load
rejection, and dynamic torque variations, the model
enables a detailed evaluation of the motor’s impact on
power quality (PQ).
The analysis focuses on key PQ indicators,
including voltage/current stability, active/reactive
power flows, frequency and power factor dynamics,
benchmarked against international standards such as
IEEE 519-2014 and EN 50160. Special attention is
given to the interaction between the excitation system
and reactive power compensation, which
significantly influences system stability and
efficiency.
The results are compared with field measurements
collected during the monitoring campaign, ensuring
that the simulation outcomes are validated against
real industrial data. This correlation provides a
reliable foundation for identifying potential
disturbances, assessing compliance with PQ
requirements, and formulating strategies for
improving operational performance.
In figure 2, illustrates the variation of the phase-to-
phase voltages U_RS, U_RT, and U_ST of the 4.2
MW, 10 kV synchronous motor during a one-hour
measurement interval (09:00–10:00). The voltages
remain close to the nominal value of 10 kV, with only
small fluctuations observed throughout the monitored
period.
These oscillations are primarily associated with
the highly dynamic load profile of the hot strip rolling
mill, were rapid changes in torque demand led to
transient deviations in phase voltages. Despite these
variations, the three phase voltages exhibit a high
degree of symmetry, with no significant unbalance
detected. This indicates a stable operation of the
supply system and the motor under industrial
conditions.
From a power quality (PQ) perspective, the
measured values comply with international standards
such as EN 50160 (CENELEC, 2010), which specifies
permissible voltage variations and unbalance limits,
and IEEE 519-2014, which addresses harmonic
distortion and voltage stability at medium-voltage
levels. The absence of large deviations or voltage dips
suggests that the motor and associated supply
infrastructure operate within acceptable PQ limits.
In conclusion, the analysis demonstrates that
although short-term fluctuations exist due to process
dynamics, the overall system maintains voltage
stability and phase balance, ensuring reliable
operation and compliance with established PQ
benchmarks.
Figure 2: Analysis of Phase Voltages Over a Time Period
(1h).
ICEEECS 2025 - International Conference on Advances in Electrical, Electronics, Energy, and Computer Sciences
226
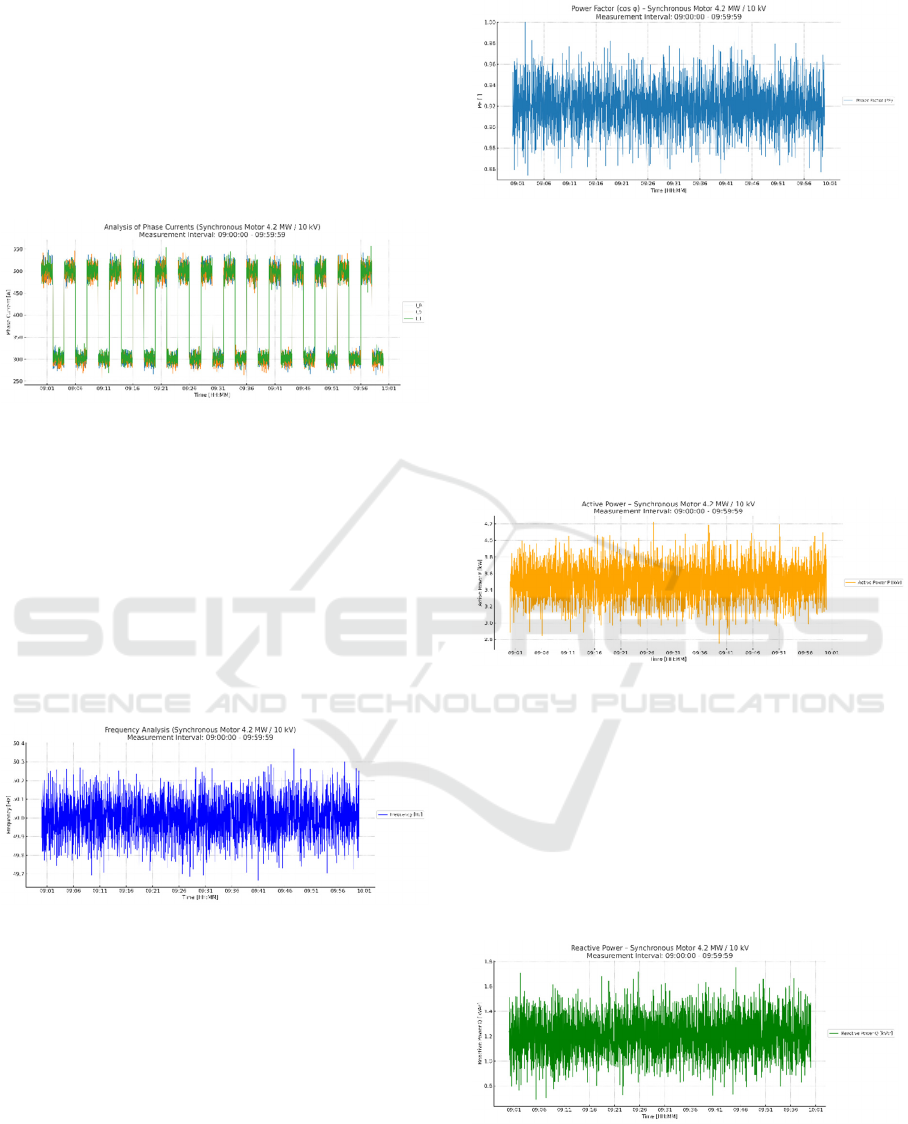
In figure 3, illustrates the evolution of the phase
currents I_R, I_S, and I_T of the 4.2 MW / 10 kV
synchronous motor over a one-hour interval (09:00–
10:00). The current values remain closely aligned
across the phases, indicating good system balance.
Dynamic variations are observed due to the rolling
mill’s load cycles, but no major unbalances are
present. The analysis confirms stable operation and
compliance with power quality requirements.
Figure 3: Analysis of Phase Current Over a Time Period
(1h).
In figure 4, illustrates the evolution of the
electrical frequency of the 4.2 MW / 10 kV
synchronous motor during the measurement interval
9:00–10:00. The values remain very close to the
nominal level of 50 Hz, with only minor fluctuations
caused by load variations in the industrial process.
The frequency stability confirms the strong
performance of the supply system and the motor’s
ability to respond effectively to the dynamic
operation of the rolling mill.
Figure 4: Frequency Analysis Over a Time Period (1h).
In figure 5, illustrates the power factor as a
function of the average line current for the 4.2 MW /
10 kV synchronous motor illustrates the relationship
between electrical load and power quality. The PF
values remain high for most of the interval, indicating
an efficient and well-compensated operating regime.
Slight variations at higher currents reflect the
influence of reactive components and the dynamics of
the industrial process. The trend line confirms the
overall stability of the power factor with respect to
current demand.
Figure 5: Power Factor Analysis Over a Time Period(1h).
In figure 6, illustrates the active power expressed
in kW for the 4.2 MW / 10 kV synchronous motor
highlights the variations in real energy consumption
over the 09:00–10:00 interval. The values remain
close to the nominal operating range, with
fluctuations characteristic of the hot rolling process,
where the load is highly dynamic. The overall
stability of the curve confirms the efficient operation
of the motor and its ability to adapt to the variable
demands of the industrial installation.
Figure 6: Active Power Analysis Over a Time Period (1h).
In figure 7, illustrates the reactive power,
expressed in kVAr, highlights the compensation
variations of the 4.2 MW / 10 kV synchronous motor
during the 09:00–10:00 interval. The observed
fluctuations reflect the adjustment of excitation to the
dynamic rolling mill regime, confirming the essential
role of the machine in maintaining voltage stability
and keeping the power factor within acceptable
limits.
Figure 7: Reactive Power Analysis Over a Time Period
(1h).
Analysis of Power Quality in Industrial Environments Using Synchronous Machines: A Case Study
227

6 CONCLUSIONS
This study analysed the power quality (PQ) impact of
a 4.2 MW synchronous motor supplied at 10 kV and
integrated into a hot strip rolling mill. By combining
real-world measurements, standards-based
evaluation, and simulation modelling, several key
findings were identified:
Power Quality Compliance – Measured parameters
such as voltage, frequency, power factor, and
harmonic distortion generally complied with IEEE
519-2014, EN 50160, and IEC 61000-4-30 standards.
Minor deviations were recorded during load
transients, but these remained within industrially
acceptable margins.
Dynamic Load Behaviour – The motor experienced
significant load fluctuations due to the rolling
process. These were directly reflected in variations of
active power (P), reactive power (Q), and power
factor (cos φ). Despite this, the synchronous motor
demonstrated strong resilience and stability under
varying torque conditions.
Excitation and Reactive Power Control – The
excitation system played a crucial role in reactive
power regulation. Adjustments ensured that the motor
not only supplied active power efficiently but also
contributed to voltage support and system stability,
reducing dependency on external reactive
compensation devices.
Simulation Validation – MATLAB/Simulink
modelling of the synchronous machine accurately
reproduced measured dynamics, including transient
events, torque variations, and harmonic behaviour.
This validated the use of simulation as a predictive
tool for operational planning and PQ improvement.
Industrial Relevance – The results highlight that
synchronous machines, when properly monitored and
controlled, can act as both energy converters and
power quality stabilizers, making them vital assets in
energy-intensive industries such as steel
manufacturing.
The integration of synchronous machines in
industrial environments provides not only mechanical
drive capacity but also significant benefits for grid
stability and power quality management. Continuous
monitoring, combined with advanced modelling and
adherence to international PQ standards, ensures
optimal operation and supports the long-term
reliability of industrial power systems.
Synchronous machines, when properly integrated
and controlled, can significantly enhance power
quality in industrial environments. Their ability to
manage reactive power, stabilize voltage, and
mitigate certain power disturbances makes them
valuable assets in maintaining system integrity.
However, their complexity necessitates careful
design, control, and monitoring.
REFERENCES
Akagi, H. (2005). Active harmonic filters. Proceedings of
the IEEE, 93(12), 2128–2141.
Arrillaga, J., & Watson, N. R. (2003). Power System
Harmonics. Wiley.
Bollen, M. H. J. (2000). Understanding Power Quality
Problems: Voltage Sags and Interruptions. IEEE Press.
CENELEC. (2010). EN 50160: Voltage Characteristics of
Electricity Supplied by Public Distribution Systems.
CIGRE Study Committee C4. (2011). Benchmarking of
Power Quality Performance in Transmission Systems.
Technical Brochure No. 379.
Ghosh, A., & Ledwich, G. (2002). Power Quality
Enhancement Using Custom Power Devices. Springer.
IEEE Standards Association. (2014). IEEE 519-2014:
Recommended Practice and Requirements for
Harmonic Control in Electric Power Systems.
IEEE Standards Association. (2010). IEEE 1459-2010:
Standard Definitions for the Measurement of Electric
Power Quantities.
IEC. (2015). IEC 61000-4-30: Testing and Measurement
Techniques – Power Quality Measurement Methods.
IEA. (2019). Energy Efficiency 2019: Analysis and
Outlooks to 2040. International Energy Agency.
Wildi, T. (2006). Electrical Machines, Drives and Power
Systems (6th ed.). Pearson.
IEC. (2015). IEC 61000-4-30: Electromagnetic
Compatibility – Power Quality Measurement Methods.
IEEE Standards Association. (2010). IEEE 1459-2010:
Standard Definitions for the Measurement of Electric
Power Quantities Under Non-Sinusoidal Conditions.
ICEEECS 2025 - International Conference on Advances in Electrical, Electronics, Energy, and Computer Sciences
228
