
Water Cashier Offices Location Optimisation Using Machine
Learning-Based Clustering Approaches: A Case Study of Ordu
Altınordu
Kübra Selvi
1
a
, Murat Taşyürek
2
b
and Celal Öztürk
3
c
1
Vocational School of Information Technologies, Kayseri University, Kayseri, Turkey
2
Faculty of Engineering, Arch. and Design, Kayseri University, Kayseri, Turkey
3
Faculty of Engineering, Erciyes University, Kayseri, Turkey
Keywords: K-Means Clustering, Hierarchical Clustering, Spatial Data.
Abstract: The location of water cashier offices is crucial in terms of both operational efficiency and citizens' easy access
to payment points. This study aims to reduce the average distance covering the widest service area with the
minimum number of cashier offices by using the K-Means and Hierarchical Clustering methods based on the
geographical coordinates of independent sections in Altınordu district of Ordu province. Spatial analyses are
playing an increasingly important role in urban planning, urban transformation and disaster management, and
identifying regions with similar characteristics is of great value. The dataset contains the latitude and longitude
information of the independent sections. The actual number of cashier offices in the Altınordu district of Ordu
province is 3. The optimal number of clusters determined by the Elbow method was 5, while the optimal
number of clusters found using dendrogram analysis was 8. In this context, clustering scenarios of 3, 5, and 8
were examined, and the performance of each algorithm was compared based on the average distance criterion.
The analyses revealed that the K-Means algorithm provided the best average distance. The results demonstrate
that the independent sections in Altınordu can be geographically clustered and that this clustering, taking into
account settlement density and the current cashier distribution, can serve as a guide for cashier planning and
resource allocation. This approach can guide the more effective placement of water cashier offices, thereby
increasing service efficiency and accessibility for citizens.
1 INTRODUCTION
Spatial data mining has become a very challenging
field because large amounts of data are collected in
various applications. The amount of data collected is
increasing exponentially. Therefore, it has gone far
beyond the analytical capabilities of humans.
Recently, clustering has been accepted as the primary
data mining method for information discovery in
spatial databases (Mumtaz & Duraiswamy, 2010).
Today, the effective management of urban
infrastructure and the provision of public services that
are more accessible to citizens are increasing the
importance of spatial data analysis. In this context,
water cashier offices stand out as service points where
citizens can meet their basic needs, such as paying
a
https://orcid.org/0009-0007-4063-6854
b
https://orcid.org/0000-0001-5623-8577
c
https://orcid.org/ 0000-0003-3798-8123
water bills and carrying out subscription procedures.
Similar studies have been conducted in the literature
for different locations. Özmerdivenli and colleagues
identified the best location for a religious facility
using the K-Means clustering algorithm. In their
study, the researchers examined the K-Means
clustering algorithm, which is widely used for
density-based analyses, and highlighted the
limitations of the traditional two-dimensional K-
Means method. To overcome these limitations, they
developed a multi-dimensional K-Means model that
takes into account both spatial distance and
population density, and experimentally compared the
success of the proposed model on real data
(Özmerdivenli et al., 2021). Another study in this
field was presented to the literature by Yürük and
278
Selvi, K., Tasyürek, M. and Öztürk, C.
Water Cashier Offices Location Optimisation Using Machine Learning-Based Clustering Approaches: A Case Study of Ordu Altınordu.
DOI: 10.5220/0014363700004848
Paper published under CC license (CC BY-NC-ND 4.0)
In Proceedings of the 2nd International Conference on Advances in Electrical, Electronics, Energy, and Computer Sciences (ICEEECS 2025), pages 278-286
ISBN: 978-989-758-783-2
Proceedings Copyright © 2026 by SCITEPRESS – Science and Technology Publications, Lda.

Erdoğmuş. Yürük and his colleague calculated the
biogas production potential based on the number of
large livestock, small livestock and poultry in Düzce.
In addition, they aimed to determine the optimal
location for a biogas plant using the K-Means
clustering algorithm, thereby identifying the most
suitable areas for waste management and energy
production (Yürük & Erdoğmuş, 2015). George and
his colleagues introduced a study to the literature
showing how the K-Means clustering algorithm can
be used to obtain information about housing
preferences and city services. They examined the
potential of analysing geographical location data
using clustering techniques to improve the quality of
life and find accommodation for expatriates and
general residents in a particular city (George et al.,
2023). In another study, Özmen and colleagues
examined central cashier offices location selection
and ATM inventory management policies with the
aim of optimising Türkiye İş Bankası's cash
management system. The goal was to increase
customer satisfaction by reducing operational costs
and idle cash costs. In this context, mathematical
models were developed for cashier offices locations,
armoured vehicle planning, and ATM cash loading
policies, and tested using data from the Eastern Black
Sea Region. Using a coordinated replenishment
model and clustering methods, they achieved a total
cost reduction of approximately 36% in the system
(Özmen et al., 2015). In Brimicombe's study, in order
to identify clusters in spatial data, he first identifies
spatial concentrations using a ‘hot spot’ clustering
method such as Geo-ProZones and proposes initial
cluster centres and the number of k for K-Means
clustering. then producing a spatial and attribute-
based segmentation from this K-Means clustering
(Brimicombe, 2007). Anderson et al.'s study
presented a two-stage methodology that uses
Geographic Information Systems (GIS) and Kernel
Density Estimation (KDE) to identify spatial
concentrations in order to determine hot spots for
traffic accidents, and then classifies these points using
environmental and qualitative data through the K-
Means clustering algorithm (Anderson, 2009). Güner
and his colleagues examined 525 traffic accidents
involving public transport vehicles in Sakarya
between 2006 and 2012. The accidents, analysed
using the K-Means clustering method, were divided
into two main groups: ‘collisions with other vehicles’
and ‘collisions with pedestrians’. It was found that
most of the accidents occurred during the day, in open
areas, and at intersections without traffic lights. As a
result, it was recommended that traffic lights be
installed at intersections, particularly in side streets
(Güner et al.). In Özdoğan's study, a new cross-
sectional model was developed using the K-Means
clustering algorithm on point cloud data obtained
from a terrestrial laser scanner, in order to identify
deformations occurring underground. Deformation
analyses conducted with the developed model
provided more accurate and reliable results compared
to traditional meshing methods. This approach
enables more precise analysis, especially in cases
where data is incomplete or contains errors (Özdoğan,
2019). Khalid and others examine the impact of big
data analytics on decision-making processes in the
logistics sector and, in particular, use the K-Means
algorithm to cluster data. By analysing supply chain
data using the K-Means clustering method, they have
contributed to operational efficiency and strategic
decision-making processes. The results demonstrate
that the correct use of big data analytics can provide
a competitive advantage in logistics (Khalid &
Herbert-Hansen, 2018). Razavi and his colleagues
propose a low-complexity floor estimation method
for indoor positioning in multi-storey buildings. To
reduce the disadvantages of traditional fingerprint-
based methods, such as large data size and processing
load, despite their high accuracy, they suggest using
the K-Means clustering algorithm to transmit only
cluster heads to mobile devices. In experiments using
real building data, this method significantly reduced
both data size and processing time while delivering
results very close to those of the fingerprint method
in terms of accuracy (Razavi et al., 2015). In
Costanzo's study, a "constrained K-Means" clustering
algorithm is proposed, which considers both
statistical similarities and spatial neighborhood
relationships in the classification of geographic units.
The developed method is specifically designed to
divide regions defined by socio-economic data into
homogeneous groups while ensuring spatial
continuity of these groups. The proposed algorithm
was successfully applied in the regional planning of
Italy’s Calabria and Puglia regions, producing more
meaningful spatial segmentations compared to the
classical K-Means method (Damiana Costanzo,
2001). The Hierarchical clustering algorithm has been
preferred in many studies, particularly due to its
ability to reveal multi-layered similarities in data
structures. In this context, some studies in the
literature are as follows. Zhu and Guo have provided
a solution to the problem of mapping large-volume
spatial flow data. They noted that traditional methods
lead to information loss and visual clutter. They
developed a Hierarchical clustering method that
considers both the starting and destination points,
aiming to produce simpler and more meaningful maps
Water Cashier Offices Location Optimisation Using Machine Learning-Based Clustering Approaches: A Case Study of Ordu Altınordu
279

by grouping flows with similar origins and
destinations. The proposed algorithm was designed to
handle large datasets and was successfully applied to
243.850 taxi trips in the city of Shenzhen (Zhu & Guo,
2014). Lamb et al. proposed a new space-time
Hierarchical clustering method that enables the joint
analysis of temporal and spatial points. This method
combines location, time, and attribute similarity to
enable the identification of multi-scale cluster
structures. This approach, which is particularly
effective in motion data, has provided more flexible
and meaningful clustering results in situations where
traditional methods fall short (Lamb et al., 2020). In
the study by Feng and colleagues, Geo-SOM and
Hierarchical clustering methods were integrated to
explore geographic data. The approach facilitates the
visual identification of spatial patterns while
providing an effective analytical tool for decision
support systems (Feng et al., 2014). In this regard,
there are studies in the literature where both methods
are applied together in a complementary manner. In
particular, examples where K-Means and
Hierarchical clustering algorithms are used
sequentially or comparatively to gain a deeper
understanding of the data structure and to validate the
clustering results are noteworthy. Fuchs and
colleagues have examined the three most commonly
used clustering approaches in the tourism field
(Hierarchical clustering, K-Means, and DBSCAN)
along with their theoretical foundations and
demonstrated how these techniques can be applied in
practice using the RapidMiner platform. Through
analyses conducted using visual data obtained from
the Flickr platform, they highlighted the various
applications of clustering algorithms, such as market
segmentation, identification of points of interest, and
classification of tourism behaviours (Fuchs &
Höpken, 2022). Kaushik and Mathur conducted a
comparative analysis of the K-Means and
Hierarchical clustering algorithms, detailing the
fundamental characteristics, strengths, and
weaknesses of each method. Their evaluation focused
on factors such as dataset size, sensitivity to noise,
algorithm performance, and areas of applicability.
They concluded that K-Means offers high
performance on large datasets, whereas Hierarchical
clustering yields higher-quality results for smaller
and more structured datasets (Kaushik & Mathur,
2014). Chehata et al. proposed a new method based
on the Hierarchical K-Means clustering algorithm for
classifying LIDAR data. The method aims to reliably
separate ground points in areas with dense vegetation
and complex topography. Clustering, which is
initiated with a fixed neighbourhood size, progresses
hierarchically to classify ground surface information
within the data more accurately. Additionally, the
accuracy of the classification has been improved
using slope maps and multi-scale analysis, and the
proposed method has demonstrated lower error rates
compared to other common filtering algorithms when
applied to ISPRS datasets (Chehata et al., 2008).
The structure of the study is organised as follows:
In the second section, the theoretical foundations of
the K-Means and Hierarchical clustering algorithms
are presented, and the spatial data set belonging to
Altınordu district of Ordu province, which was used
in the study, is introduced in detail. In the third section,
the experimental findings obtained as a result of the
applications carried out with both clustering
algorithms are presented. In the fourth chapter, the
results are discussed in the context of existing cashier
offices locations and the performance difference
between the two algorithms. Finally, in the fifth
chapter, the results obtained from the study are
evaluated in general, and recommendations for future
research are provided.
2 MATERIALS AND METHOD
In this section, the basic principles and working
principles of the K-Means and Hierarchical clustering
algorithms applied using the current data set will be
discussed in detail.
2.1 Clustering Method
Cluster analysis refers to the process of dividing data
in a data set into different groups according to specific
proximity criteria. Each group formed is called a
“cluster”. In other words, clustering is the separation
of data elements with similar characteristics into
different groups. The elements within a cluster are
similar to each other, while the similarity between
clusters is less (Silahtaroğlu, 2013). Clustering
techniques enable objects or variables to be grouped
into homogeneous and heterogeneous clusters using a
distance matrix (Yılmaz & Patır, 2011). Many
clustering methods are based on calculating the
distances between observed values. Therefore, there
is a need for formulas that calculate the distance
between two points. The most commonly used
distance formula in practice is the Euclidean distance
formula. Let p be the number of variables, i, j = 1,
2, ..., n, and k = 1, 2, ..., p. The Euclidean distance is
calculated as follows: (Yeşilbudak et al., 2011).
ICEEECS 2025 - International Conference on Advances in Electrical, Electronics, Energy, and Computer Sciences
280
𝑑
𝑖,𝑗
= 𝑥
−𝑥
(1)
Clustering methods can be grouped under four
headings: Partitioning Clustering, Hierarchical
clustering, Density-Based Clustering, and Grid-
Based Clustering (Silahtaroğlu, 2013). In this study,
K-Means and Hierarchical clustering methods were
used from among the partitioning clustering methods.
2.1.1 K-Means Clustering Method
K-Means is a typical clustering algorithm widely used
in data mining and is particularly preferred for
clustering large data sets. The K-Means algorithm
was first proposed by MacQueen in 1967. This
algorithm is one of the simplest and most widely used
unsupervised learning algorithms developed to solve
the known clustering problem (Jigui et al., 2008). The
K-Means clustering method is a clustering method
that creates k clusters from a data group containing n
data points, grouping data with similar characteristics
into the same cluster (Kodinariya & Makwana, 2013).
It is a cyclical algorithm that continuously repeats
clusters until the most suitable solution is reached. It
divides the available data into k clusters and separates
the clusters according to their averages (centers). As
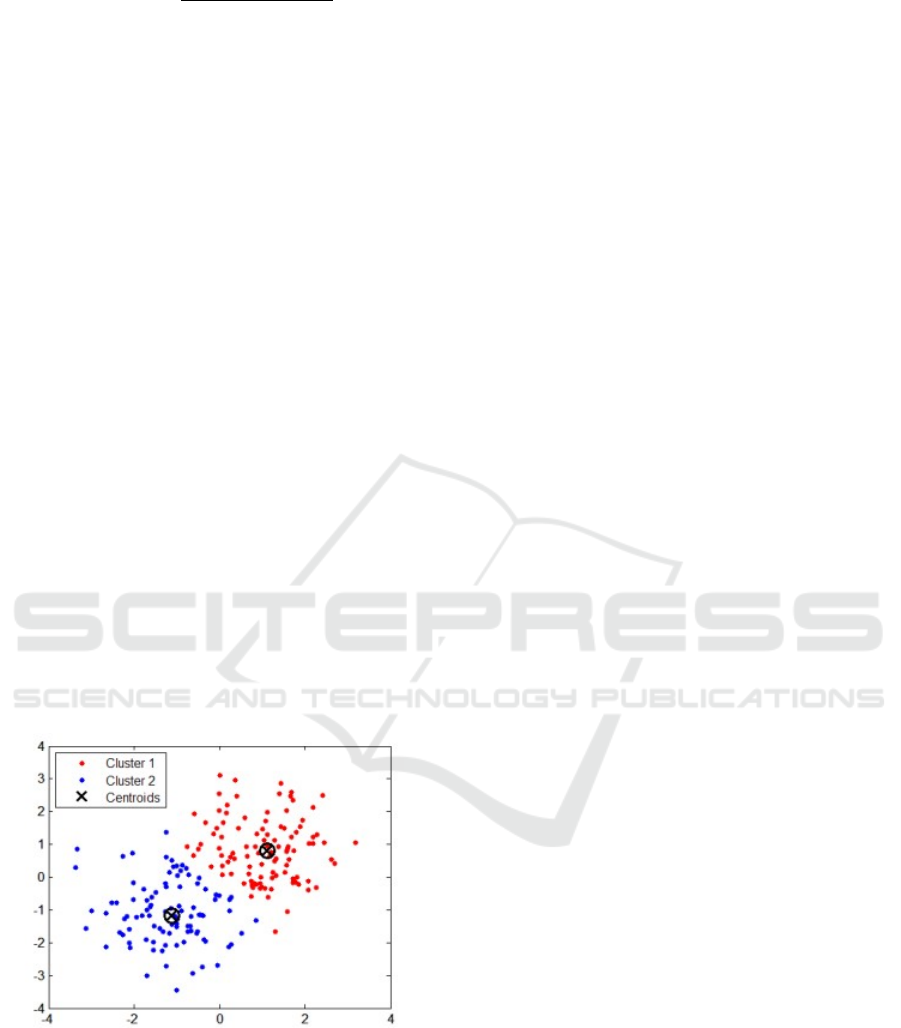
shown in Figure 1, each data point clusters around the
nearest center, and these centers are recalculated in
each iteration. The number of clusters k is determined
by the user (Silahtaroğlu, 2013).
Figure 1: K-Means Clustering (Burkardt, 2009).
The steps of the K-Means clustering algorithm are
listed below (Han et al., 2009):
k: number of clusters
D={t
1, t2,...,tn} : to represent a data group with n
number of elements;
1. The initial average values m
1, m2, ..., mk are
defined for the initially specified sets from the D
data group.
2. Each t
i element is assigned to the set of the closest
m
i.
3. The average values m1, m2, ..., mk or the clusters
are recalculated.
4. If there is no change in the average m values, the
algorithm is terminated as it has completed its task.
5. If there is a change, the process is repeated from
the first step (step 1).
Determining the value of K is an important issue
in this method. Various methods exist for selecting an
appropriate value of K. One of these is the Elbow
method. This method, used to determine the number
of clusters K, is calculated using the sum of the
squares of the distances of each point to the cluster
centres (WCSS: Within Clusters Sum of Squares).
According to this method, the point where the change
in WCSS decreases is the elbow point, and this elbow
point represents the optimal number of clusters K
(Ketchen & Shook, 1996).
2.1.2 Hierarchical Clustering Method
Hierarchical clustering methods, also known as
linkage methods, are methods that bring units
together at different stages to form sequential clusters
and determine the distance or similarity level at which
elements will be included in these clusters (Doğan,
2008). Hierarchical clustering methods are based on
the principle of treating clusters as a main cluster and
then gradually dividing them into sub-clusters, or
combining clusters that are treated separately into a
cluster in stages (Özkan, 2020). A diagram called a
dendrogram is used to make Hierarchical clustering
results more visually understandable. (Statistics How
To, 2025). A dendrogram can be interpreted by
focusing on the height at which two objects merge. In
Figure 2, E and F are seen to be the most similar
objects, because the height of the link connecting
them is the smallest. The next most similar two
objects are A and B. The height of the dendrogram
indicates the distance between clusters. This diagram
shows that the greatest difference between clusters is
between clusters A and B and clusters C, D, E, and F.
(DisplayR, 2025).
Hierarchical clustering methods are primarily
divided into two main types: Agglomerative
Hierarchical clustering methods and Divisive
Hierarchical clustering methods. In Agglomerative
Hierarchical clustering methods, each observation is
initially considered as an independent cluster, and
then,
in a repetitive manner, each observation or
Water Cashier Offices Location Optimisation Using Machine Learning-Based Clustering Approaches: A Case Study of Ordu Altınordu
281
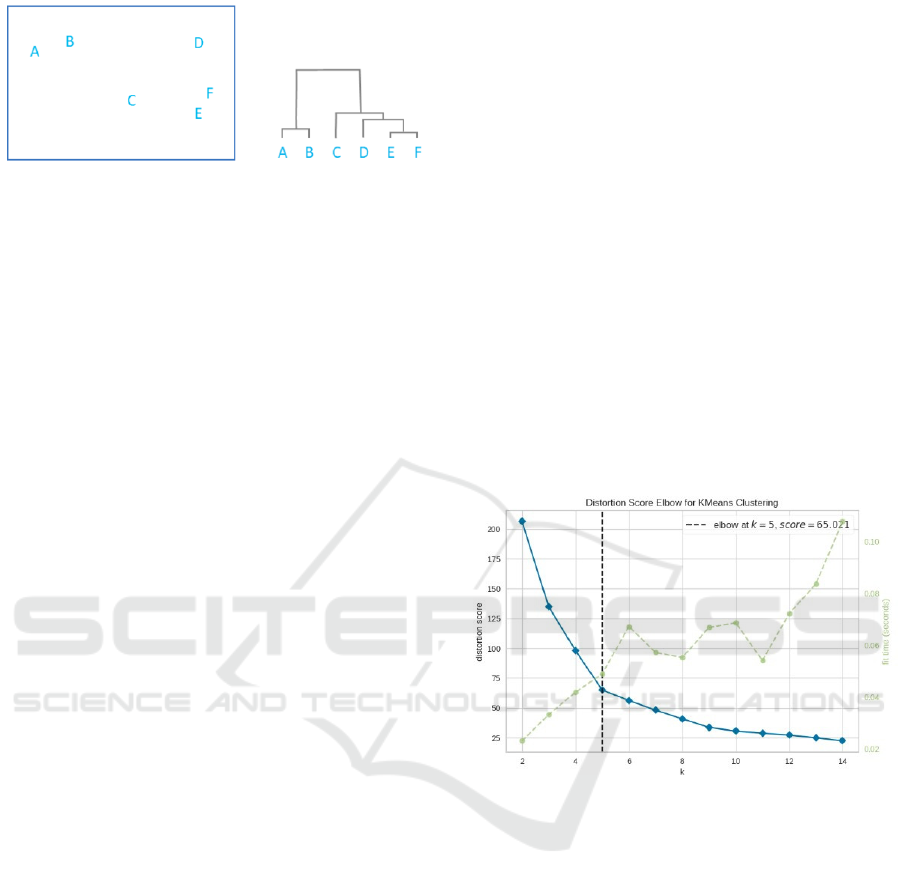
Figure 2: Dendrogram (DisplayR, 2025).
cluster of observations is combined with the
observation or cluster of observations closest to it
until a single cluster containing all observations is
obtained. In divisive Hierarchical clustering methods,
all observations are initially considered as a single
cluster, and then, in a repetitive manner, each
observation or observation cluster is separated from
the observation or observation cluster furthest from it
to form a new cluster until all observations become
independent single clusters (Yeşilbudak et al., 2011).
At each stage of Hierarchical clustering, different
approaches can be applied to determine the two most
similar clusters to be merged using a distance
measure. One such approach is the Ward method. The
centre of a cluster considers the average distance of
the cluster from the examples within it. In other words,
it aims to minimise the total intra-cluster variance. To
this end, it calculates the sum of squared errors using
intra-cluster squared deviations. (Murtagh &
Contreras, 2017).
2.2 Dataset
The data sets used in this study are publicly available
at Ulasav (Ulusal Akıllı Şehir Açık Veri Platformu,
2025). The data sets include independent section data
at the neighbourhood level for Altınordu district in
Ordu province and spatial data in KML format related
to OSKİ (Ordu Water and Sewerage Administration)
cashier offices. At the neighborhood level,
independent section data includes latitude/longitude
information, neighborhood names, and the number of
independent units. Data for Oski cashier offices
include details such as cashier offices locations
(latitude/longitude information), cashier offices
names, and additional cashier offices information
(e.g., operating hours, service types).
3 RESULTS
In this study, K-Means and Hierarchical Clustering
algorithms were used to optimise existing cashier
offices locations and determine new cashier offices
locations in Altınordu district of Ordu province. The
clustering results obtained were evaluated by
comparing the average distances between the
determined cashier offices locations and independent
units. Python software was used to perform the
simulations in this study.
K-Means Clustering Analysis Results: In the K-
Means algorithm, the k value must be determined
before the algorithm is run. However, selecting the
appropriate k value is usually a data-specific decision,
and an incorrect selection can negatively affect the
meaningfulness of the clusters. For this reason, the
Elbow Method is commonly used to determine the
optimal k value. In Figure 3, it can be seen that the
decrease in the distortion score becomes significantly
less pronounced at k=5 (the formation of an ‘elbow’).
This indicates that 5 clusters best represent the dataset
and that adding more clusters would not significantly
increase the benefit gained. The distortion score for
this optimal k value (k=5) is reported as 65.021.
Figure 3: Distortion Score Elbow for K-Means Clustering.
Hierarchical Clustering Analysis Results: The
Ward method was used in the Hierarchical clustering
analysis. The dendrogram visualises the hierarchical
relationship between data points and allows the
number of clusters to be determined by identifying an
appropriate cut-off point. By examining the cluster
structures formed when a cut-off is made at a specific
distance threshold in the dendrogram, the optimal
number of clusters can be determined. In the current
dendrogram, the large vertical lines observed
represent different cluster mergers, and it can be seen
from Figure 4 that a specific cut-off point results in 8
separate clusters.
ICEEECS 2025 - International Conference on Advances in Electrical, Electronics, Energy, and Computer Sciences
282
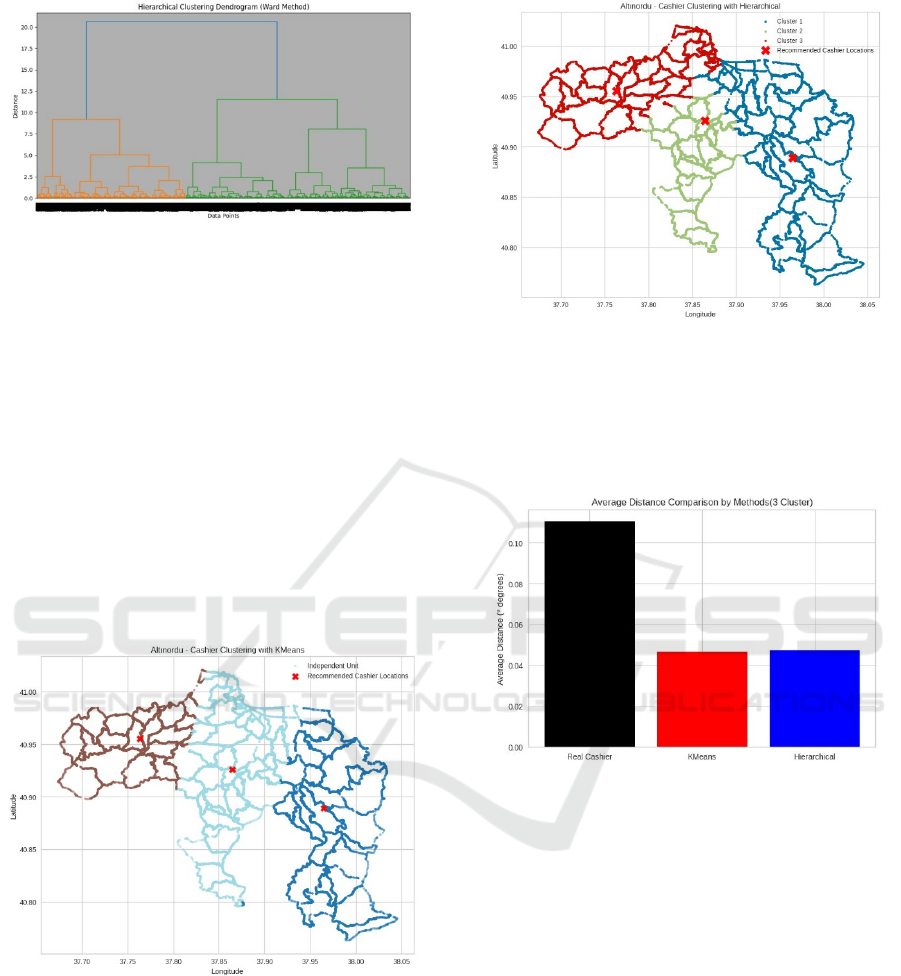
Figure 4: Hierarchical Clustering Dendrogram (Ward
Method).
The study will compare the results obtained using
different clustering methods. In reality, there are three
OSKİ cashier offices. Analysis using the Elbow
method with the K-Means algorithm found that the
most appropriate number of clusters is five, while
dendrogram analysis using the Ward linkage method
in the hierarchical clustering approach found that the
most appropriate number of clusters is eight. These
three different values were taken into account and
evaluated in the comparative analyses of the study.
Cluster Scenario: The three different clusters
obtained with KMeans (Figure 5) and hierarchical
clustering (Figure 6) the suggested cashier offices
locations for each cluster are visualized.
Figure 5: Recommended Cashier Offices Locations with K-
Means (3 Cluster).
The average distance for K-Means is
approximately 0.046 degrees, while the average
distance for Hierarchical Clustering is determined to
be approximately 0.047 degrees. In this scenario,
while both algorithms exhibit similar performance, the
K-Means algorithm has demonstrated better
performance. The average distance of the actual
cashier offices locations is approximately 0.111
degrees.
This is more than double the algorithm
Figure 6: Recommended Cashier Offices Locations with
Hierarchical Clustering (3 Cluster).
values. The average distances of the actual scale
positions to the independent units determined by the
K-Means and Hierarchical Clustering methods are
compared in Figure 7.
Figure 7: Average Distance Comparison by Methods (3
Cluster).
Cluster Scenario: When the number of clusters is
increased to five, the district is divided into smaller
and more homogeneous areas. This distribution
allows service points to be located closer to
independent units. The five different clusters obtained
with KMeans (Figure 8) and hierarchical clustering
(Figure 9) the suggested cashier offices locations for
each cluster are visualized.
As the number of clusters increases, the average
distances decrease significantly. This value drops to
approximately 0.033 degrees for K-Means and 0.035
degrees for Hierarchical Clustering. In this scenario,
the two algorithms deliver similar results, with K-
Means showing a slight performance advantage.
Figure 10 compares the average distances of the
cashier offices locations to independent units
determined by the K-Means and Hierarchical
Clustering methods.
Water Cashier Offices Location Optimisation Using Machine Learning-Based Clustering Approaches: A Case Study of Ordu Altınordu
283
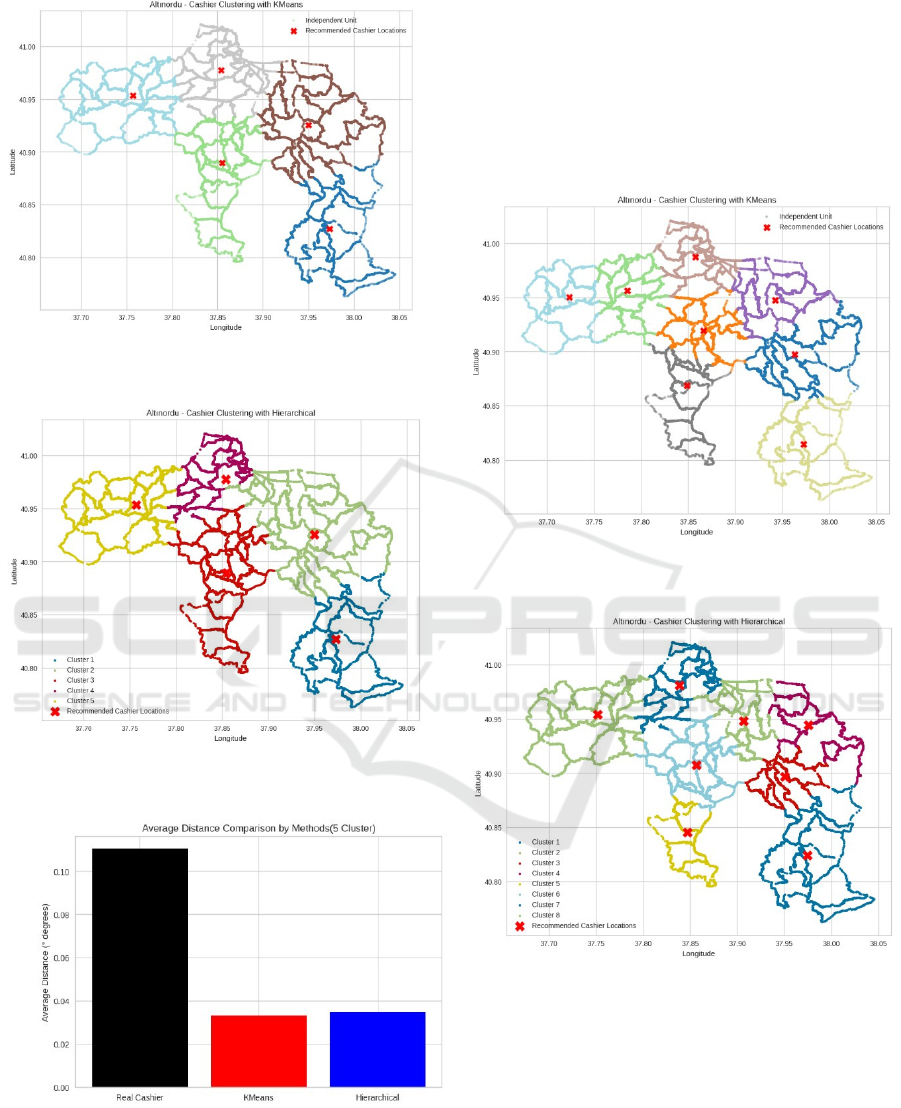
Figure 8: Recommended Cashier Offices Locations with K-
Means (5 Cluster).
Figure 9: Recommended Cashier Offices Locations with
Hierarchical Clustering (5 Cluster).
Figure 10: Average Distance Comparison by Methods (5
Cluster).
Cluster Scenario: Eight clusters have enabled
Altınordu district to be divided into more detailed and
locally based regions. This model aims to maximise
service accessibility. Although K-Means and
Hierarchical Clustering create different geometric
cluster structures, they target density centres by
proposing a cashier offices location for each cluster.
The eight different clusters obtained with KMeans
(Figure 11) and hierarchical clustering (Figure 12) the
suggested cashier offices locations for each cluster
are visualized.
Figure 11: Recommended Cashier Offices Locations with
K-Means (8 Cluster).
Figure 12: Recommended Cashier Offices Locations with
Hierarchical Clustering (8 Cluster)
In this scenario, the lowest average distances were
obtained. The average distance for K-Means was
approximately 0.026 degrees, while the average
distance for Hierarchical Clustering was calculated to
be approximately 0.028 degrees. The actual cashier
offices locations are compared with the average
distances of the cashier offices locations determined
by the K-Means and Hierarchical Clustering methods
to independent units in Figure 13.
ICEEECS 2025 - International Conference on Advances in Electrical, Electronics, Energy, and Computer Sciences
284
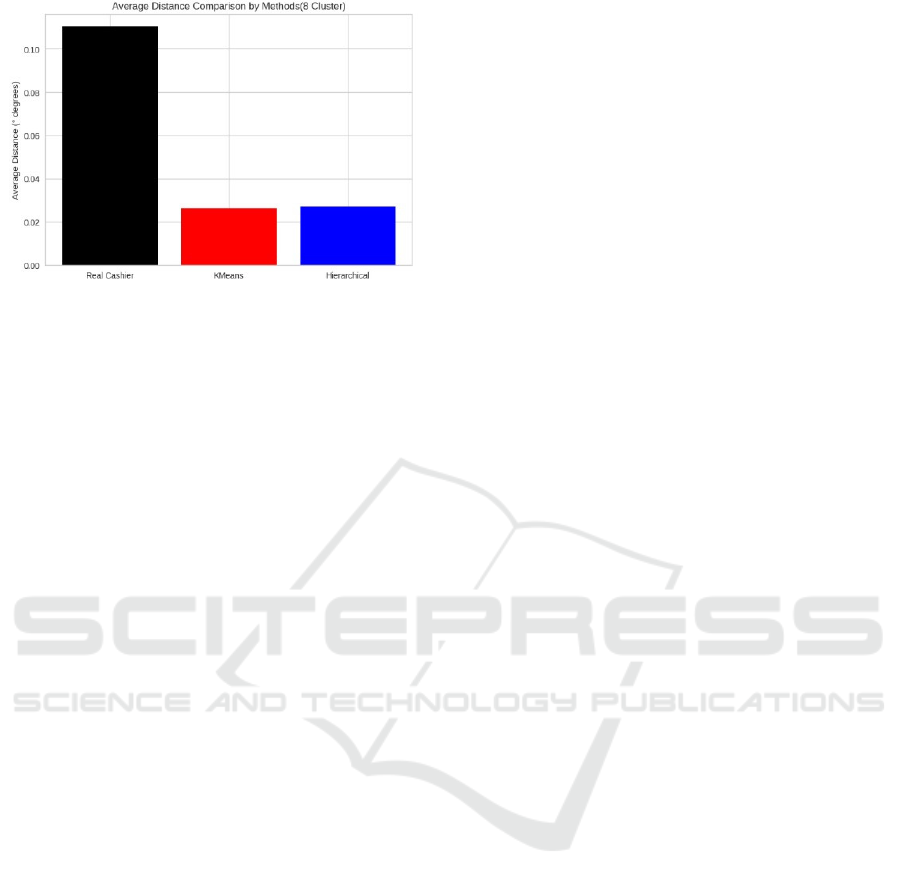
Figure 13: Average Distance Comparison by Methods (8
Cluster).
The actual cashier offices locations have the
highest average distance, approximately 0.11 degrees.
Although the degree distance varies depending on the
location in the geographic coordinate system,
assuming that 1 degree is equal to approximately
111.1 km, this distance corresponds to approximately
12.2 km. This indicates that the current cashier
locations are relatively further away than the general
independent units and have potential for
improvement in terms of accessibility.
Both K-Means and Hierarchical clustering
methods provide significantly lower average
distances compared to actual cashier offices locations.
K-Means, by exhibiting a lower average distance
value compared to Hierarchical Clustering, has
provided a more optimal distribution in terms of
access to cashier offices. This demonstrates that K-
Means can cluster the geographical distribution of
independent units in Altınordu district more
effectively, thereby placing cashier offices locations
closer to independent units.
4 DISCUSSION
The results obtained clearly demonstrate that the K-
Means and Hierarchical clustering algorithms are
effective tools for optimising cashier offices locations
in Altınordu district of Ordu province. Both methods
significantly reduce the average distance to
independent units compared to the current cashier
offices locations. In particular, K-Means clustering
appears to be more advantageous in terms of its
potential to increase the accessibility of cashier
offices services, as it yields a lower average distance
value. In this regard, it is recommended to evaluate
the cashier offices location ns determined by
clustering methods to make cashier offices services in
Altınordu district more efficient and accessible. In
particular, the 8-cluster distribution obtained with K-
Means clustering algorithm could form the basis for a
more detailed service area plan. In future studies,
including additional factors such as demographic data,
existing infrastructure, and operational costs in
cashier offices location optimisation could provide
more comprehensive and practically applicable
solutions.
5 CONCLUSIONS
In this study, spatial density zones were determined
using the K-Means and Hierarchical Clustering
algorithms based on the geographical location data of
independent sections in Altınordu district, Ordu
province. The aim is to ensure more efficient
placement of water cashier offices and provide easier
access for citizens. The clusters obtained were
compared with the locations of the existing three
water cashier offices to analyse regional similarities
and homogeneous areas. In the analysis, the optimal
number of clusters for K-Means was determined as 5
using the Elbow method, and these 5 cluster centres
were proposed as potential water cashier offices
locations. Hierarchical Clustering (Ward method)
grouped the data set into 8 different clusters. This
analysis compares the performance of the K-Means
and Hierarchical Clustering algorithms for the
optimisation of cashier offices locations using the
independent section KML data of Altınordu district in
Ordu province, based on different cluster numbers (3,
5, 8). The effectiveness of the cashier offices
locations proposed by both clustering algorithms was
evaluated based on the average distances to
independent units. The results clearly show that the
average distance of the existing actual cashier offices
locations is significantly higher than that of the
locations proposed by the clustering methods. This
confirms that the existing locations are not optimised
in terms of accessibility. The results indicate that
these methods could make important contributions to
urban planning and the efficiency of public services.
It was observed that the cashier offices locations
obtained using the K-Means method provided a more
efficient distribution by offering a lower average
distance value compared to the Hierarchical
Clustering method. These results highlight the
potential and benefits of using machine learning
algorithms in the spatial planning of public and
private sector service units. Future studies could
develop more comprehensive and realistic solutions
Water Cashier Offices Location Optimisation Using Machine Learning-Based Clustering Approaches: A Case Study of Ordu Altınordu
285

by enriching these placement models with additional
variables such as road networks and operational costs.
REFERENCES
Anderson, T. K. (2009). Kernel density estimation and K-
means clustering to profile road accident hotspots.
Accident Analysis & Prevention, 41(3), 359–364.
Brimicombe, A. J. (2007). A dual approach to cluster
discovery in point event data sets. Computers,
environment and urban systems, 31(1), 4–18.
Burkardt, J. (2009). K-means clustering. Virginia Tech,
Advanced Research Computing, Interdisciplinary
Center for Applied Mathematics, 5.
Chehata, N., David, N., & Bretar, F. (2008). LIDAR data
classification using hierarchical K-means clustering.
ISPRS Congress Beijing 2008,
Damiana Costanzo, G. (2001). A constrained k-means
clustering algorithm for classifying spatial units.
Statistical Methods and Applications, 10(1), 237–256.
DisplayR. (2025). https://www.displayr.com/what-is-
dendrogram/
Doğan, B. (2008). Bankaların gözetiminde bir araç olarak
kümeleme analizi: Türk bankacılık sektörü için bir
uygulama
Feng, C. C., Wang, Y. C., & Chen, C. Y. (2014). Combining
Geo ‐ SOM and hierarchical clustering to explore
geospatial data. Transactions in GIS, 18(1), 125–146.
Fuchs, M., & Höpken, W. (2022). Clustering: hierarchical,
k-means, DBSCAN. In Applied Data Science in
Tourism: Interdisciplinary Approaches,
Methodologies, and Applications (pp. 129–149).
Springer.
George, S., Seles, J. K. S., Brindha, D., Jebaseeli, T. J., &
Vemulapalli, L. (2023). Geopositional Data Analysis
Using Clustering Techniques to Assist Occupants in a
Specific City. Engineering Proceedings, 59(1), 8.
Güner, S., Geçer, H. S., & Coşkun, E. Toplu Taşima
Araçlarinin Dâhil Olduğu Trafik Kazalarinin K-
Ortalamalar Kümeleme Algoritmasi İle Analizi:
Sakarya Uygulamasi.
Han, J., Lee, J.-G., & Kamber, M. (2009). An overview of
clustering methods in geographic data analysis.
Geographic data mining and knowledge discovery, 2,
149–170.
Jigui, S., Jie, L., & Lianyu, Z. (2008). Clustering algorithms
research. Journal of software, 19(1), 48–61.
Kaushik, M., & Mathur, B. (2014). Comparative study of
K-means and hierarchical clustering techniques.
International Journal of Software & Hardware
Research in Engineering, 2(6), 93–98.
Ketchen, D. J., & Shook, C. L. (1996). The application of
cluster analysis in strategic management research: an
analysis and critique. Strategic management journal,
17(6), 441–458.
Khalid, W., & Herbert-Hansen, Z. N. L. (2018). Using k-
means clustering in international location decision.
Journal of Global Operations and Strategic Sourcing,
11(3), 274–300.
Kodinariya, T. M., & Makwana, P. R. (2013). Review on
determining number of Cluster in K-Means Clustering.
International Journal, 1(6), 90–95.
Lamb, D. S., Downs, J., & Reader, S. (2020). Space-time
hierarchical clustering for identifying clusters in
spatiotemporal point data. ISPRS International Journal
of Geo-Information, 9(2), 85.
Mumtaz, K., & Duraiswamy, K. (2010). An analysis on
density based clustering of multi dimensional spatial
data. Indian Journal of Computer Science and
Engineering, 1(1), 8–12.
Murtagh, F., & Contreras, P. (2017). Algorithms for
hierarchical clustering: an overview, II. Wiley
Interdisciplinary Reviews: Data Mining and
Knowledge Discovery, 7(6), e1219.
Özdoğan, M. V. (2019). Yeraltı deformasyonlarının
belirlenmesi amacıyla K-ortalamalar kümeleme
algoritması kullanılarak kesit model geliştirilmesi.
Dokuz Eylül Üniversitesi Mühendislik Fakültesi Fen ve
Mühendislik Dergisi, 21(63), 707–717.
Özkan, Y. (2020). Veri madenciliği yöntemleri. Papatya
Yayıncılık Eğitim.
Özmen, M., Tunç, S., Yağız, G., Yıldırım, S., Yıldız, E.,
Köksalan, M., & Gürel, S. (2015). Merkezi Vezne Yer
Seçimi Ve Atm Envanter Yönetim Politikalari İle Nakit
Yönetim Sistemi Optimizasyonu. Endüstri
Mühendisliği, 26(2), 4–20.
Özmerdivenli, N. M., Taşyürek, M., & Daşbaşı, B. (2021).
Dini Tesis Yapılacak En İyi Konumun K-means
Kümeleme Yöntemleri ile Tespit Edilmesi. Avrupa
Bilim ve Teknoloji Dergisi(32), 424–430.
Razavi, A., Valkama, M., & Lohan, E.-S. (2015). K-means
fingerprint clustering for low-complexity floor
estimation in indoor mobile localization. 2015 IEEE
Globecom Workshops (GC Wkshps),
Silahtaroğlu, G. (2013). Veri madenciliği: Kavram ve
algoritmaları. Papatya.
Statistics How To. (2025).
https://www.statisticshowto.com/hierarchical-
clustering/
Ulusal Akıll
ı Şehir Açık Veri Platformu. (2025).
https://ulasav.csb.gov.tr/
Yeşilbudak, M., Kahraman, H., & Karacan, H. (2011). Veri
madenciliğinde nesne yönelimli birleştirici hiyerarşik
kümeleme modeli. Gazi Üniversitesi Mühendislik
Mimarlık Fakültesi Dergisi, 26(1).
Yılmaz, Ş. K., & Patır, S. (2011). Kümeleme Analizi Ve
Pazarlamada Kullanimi. Akademik Yaklaşımlar
Dergisi, 2(1), 91–113.
Yürük, F., & Erdoğmuş, P. (2015). Düzce ilinin hayvansal
atiklardan üretilebilecek biyogaz potansiyeli ve k-
means kümeleme ile optimum tesis konumunun
belirlenmesi. İleri Teknoloji Bilimleri Dergisi, 4(1), 47–
56.
Zhu, X., & Guo, D. (2014). Mapping large spatial flow data
with hierarchical clustering. Transactions in GIS, 18(3),
421–435.
ICEEECS 2025 - International Conference on Advances in Electrical, Electronics, Energy, and Computer Sciences
286
