
Application of Linear Programming in Gerrymandering for Optimal
Partisan Gain in the United States
Jingze Dai
Santa Margarita Catholic High School, RSM, California, 90001, U.S.A.
Keywords: Gerrymandering, Linear Programming, Electoral Districting, Partisan Optimization, Political Representation.
Abstract: This study investigates how linear programming can be applied to engineer optimal electoral districting for
partisan advantage, focusing on the 2012 Pennsylvania House of Representatives election as a case study.
Although the Republican Party received only 49.9% of the statewide popular vote, they secured 13 out of 18
congressional seats through strategic districting. Using county-level voting and population data, this paper
develops a linear programming model in Python to simulate and optimize gerrymandering for the Republican
Party. The model, even with relaxed constraints on contiguity and compactness, demonstrates the ability to
secure up to 17 out of 18 seats for the party-an outcome more extreme than the real-world result. The model
validates core gerrymandering strategies such as “packing” and “cracking,” revealing how districts can be
drawn to amplify seat share far beyond vote share. This paper also compares the program’s output to the
actual 2012 district map and discuss the similarities in partisan tactics despite differing structural constraints.
The findings underscore the effectiveness of linear programming in modeling partisan manipulation and offer
insights into the limits and consequences of gerrymandering under district-based majoritarian systems.
1 INTRODUCTION
The district-based majoritarian system combines two
key elements: district-based representation and
majoritarian representation.
District-based representation divides a country
into districts that each elect one or more
representatives. Whoever gets the most votes in a
district wins, regardless of national totals. It contrasts
with popular voting, which counts all votes equally
across the nation.
Majoritarian representation, or “winner takes all,”
means each district yields a single winner regardless
of the winning margin. This model is used in the U.S.
House and Electoral College, where winning a district
yields total control of its representation. In contrast,
proportional representation typically uses multi-
member districts, where seats are distributed among
parties or candidates in proportion to the votes they
receive within that district. While majoritarian
systems offer clarity and stable governments, they
often distort proportional fairness. A party can win a
majority of seats without a majority of votes, leaving
large groups of voters effectively unrepresented.
Historically, district-based systems emerged to
accommodate geographical identity and civic
organization. In 5th century, citizens were grouped
into demes that each contributed members to the
Boule (Council of 500), balancing urban and rural
voices. The Roman Republic similarly divided
citizens into 35 voting units. Rome adopted a district-
based majoritarian system to preserve elite control-
districts were drawn to amplify elite influence, a
precursor to modern gerrymandering.
Britain also embraced this system when adopting
representative democracy. Today, each of the UK’s
650 constituencies elects one through a winner-takes-
all vote. This suppresses smaller parties and
contributes to a two-party dominance. Meanwhile, in
the European Parliament, member states act as
districts. Some use winner-takes-all, others use
proportional allocation.
In the United States, states retain strong identities
and are treated as individual political units. Thus, for
both Congress and the presidency, elections rely on
district-based majoritarian rules. In the Electoral
College, nearly all states give 100% of their electors
to the candidate who wins the state, regardless of
margin. This model became dominant because it
amplified a state’s influence and simplified election
outcomes-advantages that appealed to politicians
despite its undemocratic distortions.
474
Dai, J.
Application of Linear Programming in Gerrymandering for Optimal Partisan Gain in the United States.
DOI: 10.5220/0014361400004718
Paper published under CC license (CC BY-NC-ND 4.0)
In Proceedings of the 2nd International Conference on Engineering Management, Information Technology and Intelligence (EMITI 2025), pages 474-481
ISBN: 978-989-758-792-4
Proceedings Copyright © 2026 by SCITEPRESS – Science and Technology Publications, Lda.

Controversies arise when the district-based
structure combines with majoritarian rules. While it
creates clear winners and stable governments, it often
undermines political equality. Because only one
winner emerges per district, millions of votes can be
effectively discarded. Furthermore, while the system
appears democratic on the surface, its reliance on
district boundaries makes the system vulnerable to
manipulation through gerrymandering and can
produce outcomes that are deeply unrepresentative
and structurally biased.
Gerrymandering-the manipulation of district
boundaries for political gain-typically occurs during
redistricting cycles (e.g., after the U.S. Census every
10 years). The term originates from 1812, when
Massachusetts Governor Elbridge Gerry approved a
district shaped like a salamander to benefit his party.
Gerrymandering allows parties to distort the
relationship between votes and seats, enabling them
to dilute the influence of the opposing party and gain
power disproportionate to their support. It relies on
the systematical flaw that the winning margin does
not matter.
Two key strategies are common: Packing:
Concentrating opposition voters into a few districts so
they win by overwhelming margins, wasting their
votes. Cracking: Spreading opposition voters thinly
across many districts so they lack the numbers to win
anywhere.
Gerrymandering has happened in the United
States numerous times in reality. In 2012,
Republicans won 13 of 18 House seats in
Pennsylvania with only 49% of the vote due to the
gerrymandered map. In North Carolina, Republicans
secured 10 of 13 seats despite near-even statewide
vote shares. That year, in at least five states, the party
that lost the popular vote won the most seats in the
House.
Gerrymandering is extremely prevalent in the
United States, unlike in many other democracies like
Canada, the UK, Australia, and New Zealand, where
independent commissions draw districts. In the U.S.,
redistricting is typically handled by partisan state
legislatures, allowing dominant parties to entrench
their power.
Some states, including California, Arizona, and
Michigan, have established independent redistricting
commissions to ensure fairness. Others rely on court
challenges and public ballots. For example,
Pennsylvania’s 2012 map was struck down by a
federal court in 2018 for being unconstitutional.
North Carolina’s congressional map was also
invalidated in 2016.
Despite these efforts, enforcement remains weak,
and gerrymandering continues to distort
representation in American democracy. Legislative
reform has been slow, and the issue persists as a deep-
rooted challenge.
In this study, the author aims to use the method of
linear programming to create a model that can find
the optimal districting for a party. This paper will use
an approach that is different from past research in a
few ways and also try to observe the patterns when
people lift some of the restraints. This paper decides
to focus on the House of Representatives election in
the United States, where gerrymandering is the most
prevalent. More specifically, this paper decide to
focus this study on the case of Pennsylvania in 2012,
one of the most famous and extreme cases of
gerrymandering. After creating the model and
program, this paper will look for two things: how well
the model performs in maximizing the number of
seats a party can obtain in a state and how the
computer drawn model compares to the real district
drawn by the Republican Party in Pennsylvania in
2012.
This study is significant in many ways. First, it
can help people better understand how linear
programming can be used to model real life scenarios
in politics and other fields. Also, creating a linear
programming model to find optimal gerrymandering
can help people understand the extent
gerrymandering could get and the strategies of
politicians and state governments. This study could
also be useful in court cases by helping with fairness
determination and provide guidelines for legislative
reforms.
2 LITERATURE REVIEW
Gerrymandering has increasingly been recognized as
a problem that can be effectively analyzed using
mathematical and computational tools. Scholars have
employed geometry, graph theory, and optimization
techniques to both detect bias and, conversely, to
design maps that maximize partisan gain. Initially, the
focus lay on modeling district compactness and
contiguity-properties critical for legally acceptable
maps-before evolving toward algorithmic detection
of bias and, ultimately, toward explicit partisan
optimization using integer programming.
Guest et al. pioneered computer-assisted
redistricting by posing district design as the
minimization of within-district distances. Their
weighted k-means clustering approach, tested on real
U.S. Census data, produced geometrically “fairer”
Application of Linear Programming in Gerrymandering for Optimal Partisan Gain in the United States
475

maps-more compact and contiguous-than many
human-drawn counterparts. Their work underscored
the capacity of automated methods to expose hidden
suboptimalities in conventional maps and established
a foundation for later algorithmic fairness
benchmarks (Guest et al., 2017).
Building on efficiency metrics, Chatterjee et al.
investigated the computational difficulty of
minimizing the “efficiency gap”-a measure of wasted
votes per side-and demonstrated that although
theoretically NP-hard, practical heuristics could yield
improved maps in states like Pennsylvania and
Wisconsin. Their fast algorithms showed that realistic
efficiency gain is tractable, providing tools both for
legal challenges and neutral map generation
(Chatterjee et al., 2018).
Jacobs and Walch integrated compactness
evaluation with partial differential equations to
generate large ensembles of alternative maps. Their
auction-dynamics and curvature-flow model
generated many plausible districtings, enabling
statistical outlier detection-an essential method for
flagging partisan aberrations (Jacobs and Walch,
2018; Trounstine, 2025).
Turning toward optimization for partisan
advantage, Dugošija et al. formalized a graph-based
integer linear programming (ILP) framework that
enforces population balance, contiguity, and
compactness while optimizing either compactness or
partisan objective functions. Tested on grid and
small-state maps, their ILP models yielded provably
optimal plans, illustrating that granular control is
feasible with academic-grade solvers (Dugošija et al.,
2020; Webb et al., 2025).
Okamoto formulated partisan gerrymandering as
a binary optimization problem akin to ILP-using the
Ising model and simulated annealing. By applying
cell-based redistricting grids to maximize seats for
one party under contiguity constraints, he
demonstrated near-optimal partisan tilting in
synthetic models (Okamoto, 2021).
Most recently, Faure et al. extended linear
programming approaches to optimize political or
minority representation via mixed-integer
programming. Using county-level testbeds, they
approximated probit-based objectives under
contiguity and population constraints, achieving tight
computational bounds, showing that district-scale
partisan optimization is now practical for real-world
scenarios (Faure et al., 2024; Zhu et al., 2021).
Computational geometry and ensemble methods
have become central to the detection of
gerrymandering, offering a means to evaluate enacted
maps against a vast space of algorithmically
generated alternatives. Through techniques such as
Markov Chain Monte Carlo sampling and curvature-
flow modeling, researchers have generated
thousands-sometimes millions-of legally valid
districting plans per state, establishing rigorous
statistical baselines. These methods have been
applied with considerable success in states such as
North Carolina, Wisconsin, and Pennsylvania, where
enacted maps were shown to be extreme outliers
compared to neutral ensembles. On the other hand,
linear and mixed-integer programming approaches
have demonstrated the feasibility of constructing
districting plans optimized for partisan advantage,
under realistic legal and geographic constraints.
These models have been scaled to handle entire
states-such as Indiana, Arizona, and even
Pennsylvania-comprising hundreds to thousands of
precincts or census blocks. In these applications,
solvers have produced maps that outperform existing
gerrymanders in terms of seat maximization for a
target party, while still satisfying population equality,
contiguity, and compactness requirements. In some
cases, the optimized maps yielded partisan
advantages greater than those seen in enacted maps,
underscoring both the potential and the ethical peril
of such mathematical precision (Palomares, 2020).
In this study, the author uses an approach that is
different from past research in a few ways and lift
some of the restraints that are usually required. This
paper aims to see if people can observe any
meaningful or different patterns.
3 METHODOLOGY
3.1 Data Introduction
In this study, the author decides to specifically focus
on the House of Representatives election in
Pennsylvania in 2012-one of the most famous and
controversial occasions where a party used
gerrymandering for its own benefits.
3.2 Method Overview
In this study, the author focuses on the state of
Pennsylvania in 2012, and aims to find the most
optimal way of drawing electoral districts for the
Republican Party using a linear programming model
in python-the author aims to maximize the number of
seats the Republican Party wins in the state. The
author will then compare it to the actual districts in
2012 drawn by a Republican led government which
triggered a lot of controversies as well as a lawsuit
EMITI 2025 - International Conference on Engineering Management, Information Technology and Intelligence
476

(Table 1). The author is looking for two things in the
results: How effective is this approach in maximizing
the number of seats for the Republican party? In other
words, how extreme can gerrymandering be when
optimized? Is the computer optimized result similar
to the districting that happened in reality in 2012 or is
it different? In what ways are they different or
similar?
Table 1: This caption has one line so it is centered.
District Counties Included Republican
Victor
y
?
1
/
/
2 19 Yes
3 21, 39, 42 Yes
4 2, 6, 11, 23, 30, 33, 54, 57 Yes
5 25, 41, 43 Yes
6 47 Yes
7 9, 49 Yes
8 13, 24, 51
/
9
/
Yes
10 5, 60 Yes
11 4, 28, 37, 46, 55, 61, 65 No
12 12, 17, 52, 59 Yes
13 26, 32, 35, 56 Yes
14 36, 58, 63 Yes
15 16, 48 Yes
16 29, 44 Yes
17 14, 66 Yes
18 53 Yes
In the United States, when state governments draw
electoral districts, the laws usually require the
following rules: integrity, contiguity, no enclaves,
compactness, and population equality. In addition,
electoral districts should aim to preserve existing
boundaries, such as the boundaries of counties.
In this study, to test something different, the
author makes the following assumptions. For this
study, the author does not take into account the
contiguity, no enclaves, and compactness
requirements. There are only 2 parties on the ballot,
in this study, the Democratic Party and the
Republican Party. The author aims to maximize the
advantage of the Republican party in this study. The
author assumes that everyone in each county votes.
Each county must be assigned to 1 and only 1 district;
it cannot be split into different districts. The total
population for each district must be approximately
equal (further explained later). Last, the districts
cannot be empty.
Since the author do not allow counties to be split
into different districts, it might not be possible to
create districts with approximately similar
populations. Therefore, the author will start by
ignoring this constraint and then gradually making it
stricter. For example, the author will first ask the
model to try to ensure each district has a population
between 70%~130% of the average population; then,
the author will tighten the range to 90%~110% of the
average population, and so on.
As previously stated, the author aims to model the
gerrymandering process with a linear programming
model. The author first defines several variables to
represent different factors in this model. Then, the
author uses these variables to define the function the
author aims to maximize and the constraints. Last, the
author programs the model in Python and use the
“LpProblem” function in the “PuPL” library to solve
for the optimal solution.
3.3 Variable Introduction
Each county has a label “i” and each district has a
label “j”. 𝑥
=1 if county i is in district j; 𝑥
=0 if
county i is NOT in district j. 𝑣
= net votes for the
Republican party in county i. 𝑦
=1 if the
Republican party wins district j, i.e. 𝛴
𝑣
∙𝑥
>
0 . 𝑝
= the population of county i. 𝑝
= total
population / number of districts.
3.4 Optimization Function
The author aims to maximize 𝛴
𝑦
, the total number
of districts the Republican party wins. Only these
constraints need to be expressed as equations. Each
county is in exactly 1 electoral district: 𝛴
𝑥
=1.
Every district should have approximately the same
population: 𝑘
∙𝑝
≤𝛴
𝑝
∙𝑥
≤𝑘
∙𝑝
.
The author will try different sets of 𝑘
and 𝑘
to limit
the range. The author will start by ignoring this
constraint and then do, for example, if people want
each district to have a population greater than 70% of
the average population and less than 130% of the
average, 0.7 ∙ 𝑝
≤𝛴
𝑝
∙𝑥
≤1.3∙𝑝
.
The districts cannot be empty 𝑆𝑈𝑀𝑥
≥1 for
each j.
3.5 Program Structure and
Explanations
First, the author imports the data to the program. The
author creates an empty array to represent the 67
counties and a different one to represent 18 empty
districts. There is another array that holds the
population of each county. Lastly, the author creates
an array that holds the net votes of the Republican
party in each county and assign the average
Application of Linear Programming in Gerrymandering for Optimal Partisan Gain in the United States
477

population of each district 74248 to the variable
pop_ideal.
Then, the author establishes the linear
programming model by calling the LpProblem
function from the pulp library in Python and create an
object prob. After that, the author defines the
variables 𝑥 and 𝑦, add the constraints to the object
prob, and loop through each district to assign the
corresponding 1 or 0 value to each 𝑦
.
For constraint (every district should have
approximately the same population), the author starts
by excluding it and then gradually tightens the
restrictions. The author starts by using the numbers
0.7 and 1.3 for 𝑘
and 𝑘
; then, the author tries to
increase the first number and decrease the second
number until the constraint becomes infeasible.
Finally, the author uses the linear programming
solver in the library to solve this optimization
problem and print the results.
4 RESULTS AND DISCUSSION
4.1 Outputs and Explanations
Table 2 presents the program output when the author
excludes lines 28~31 in the code we displayed earlier,
therefore ignoring the population constraint
(constraint 4). The Republican party wins 17 of the
18 total congressional districts despite only receiving
49.9% of statewide votes. The output indicates that
the Republican party wins every district except
district 10. The output also displays the exact way of
drawing the districts to achieve this optimal solution.
For example, district 0 consists only of county 46,
Montgomery. Counties 5, 10, 17, and 59 are drawn
into district 1; these counties are Bedford, Butler,
Clearfield, and Tioga, respectively.
Table 2 presents the program output when this
paper includes lines 28~31 and requires the
population of each district to be between 70% and 130%
of the average population. This turns out to be
infeasible, and the assumption that counties cannot be
split into different districts is very likely the cause of
this issue. Despite being practically insignificant, the
program provides a heuristic solution, in which the
Republican party wins 15 out of the 16 districts and
the other two districts are left empty. The author
attempted to apply more lenient restrictions, but the
model fails to yield meaningful results until the
author loosens the requirement to be greater than 20%
of the average population and less than 180% of the
average-at that point, the requirement does not have
much practical meaning anymore.
Table 2: Program output, without constraint 4
District Counties Included Republican
Victory?
146
/
2 5, 10, 17, 59 Yes
3 7, 13, 39, 42 Yes
4 11, 23, 27, 30, 31,
34, 54, 64
Yes
5 6, 15, 25, 41, 43,
48, 66
Yes
6 47, 62 Yes
7 9, 53 Yes
8 24, 57
/
9 18, 63 Yes
10 49 Yes
11 4, 28, 37, 38, 50,
51, 55, 61, 65
No
12 12, 52 Yes
13 0, 1, 8, 20, 21, 26,
33, 35, 36, 56, 58,
60
Yes
14 29 Yes
15 16 Yes
16 19, 40, 44 Yes
17 2, 3, 14 Yes
18 22, 32, 45 Yes
4.2 Effectiveness of the Approach
The model and approach turned out to be extremely
effective. In fact, the author obtained a significantly
better outcome for the Republican party compared to
the districts the Republican led government drew for
the 2012 congressional election. The Republican
party received 13 out of 18 seats (72% of the seats) in
the actual election, while the model let them have 17
out of the 18 seats (94% of the seats). Note that they
only obtained 49.9% of the popular votes-usually, in
the United States, for a party to secure 90% or more
of the House of Representatives seats, they need to
win at least 70% to 75% of the popular votes.
The Republican party loses the popular vote in the
2012 election in Pennsylvania but through
gerrymandering, they are able to dominate the House
of Representatives. With the model and approach,
they are able to obtain an even better result for the
Republican Party compared to the real 2012 election.
The linear programming model seems to be
promising.
4.3 Main Findings
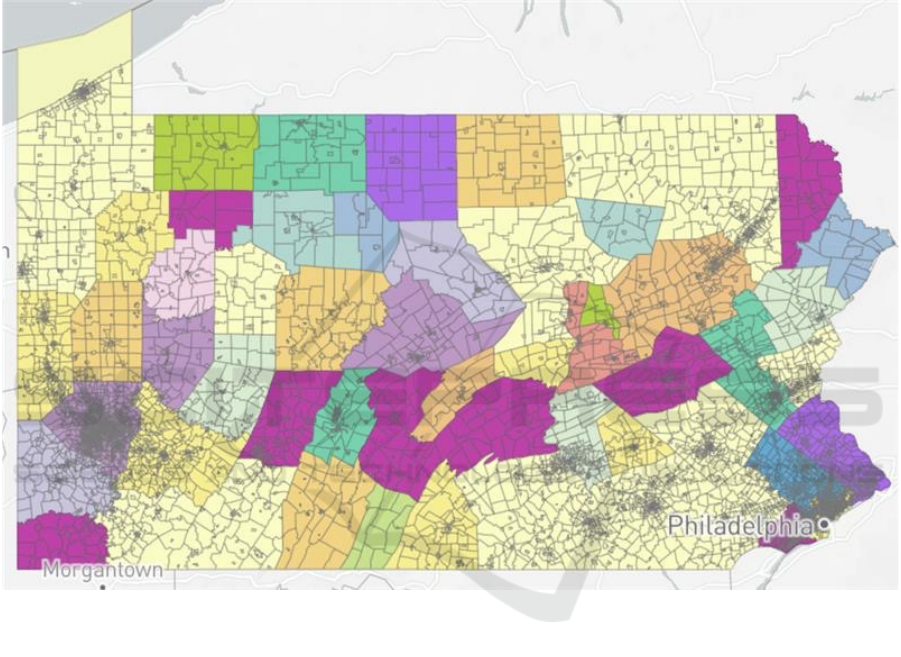
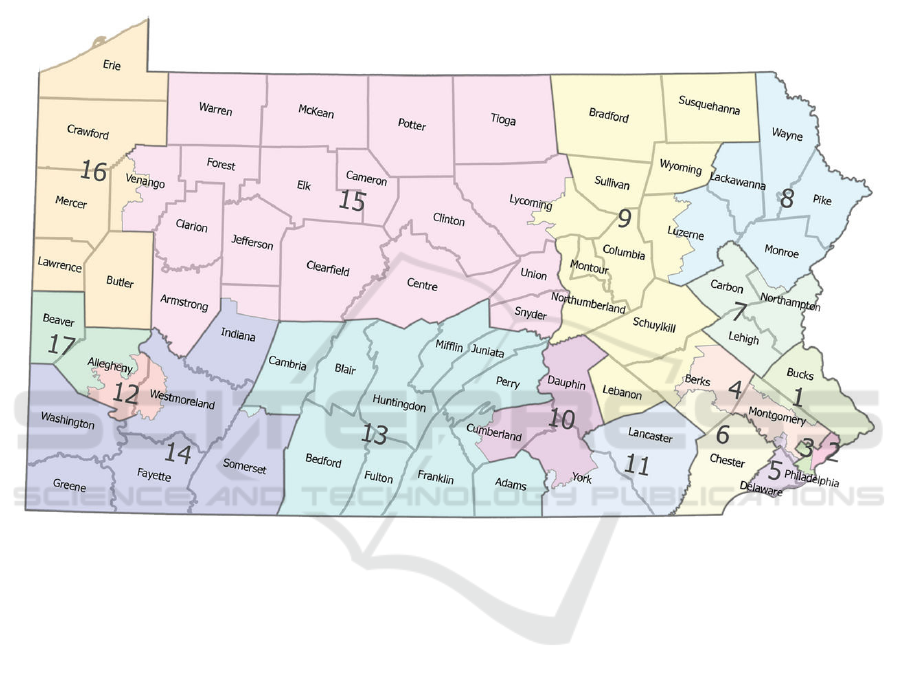
Figure 1 displays the actual congressional districts in
Pennsylvania in 2012. Figure 2 displays the districts
EMITI 2025 - International Conference on Engineering Management, Information Technology and Intelligence
478
drawn by the linear programming model without the
population equality requirement. In both pictures,
each color represents a different district. As presented
in these pictures, it is not hard to tell that the districts
are drawn in completely different ways. The shapes
of the regions seem to resemble each other in no way
at all. This is likely caused by the simplifications the
author made to the model.
However, despite these districts being drawn in
completely different ways-one was drawn by
government officials and the other drawn by a
computer linear programming model, they share
some similarities in the fundamental principles.
Similar ideas and strategies seem to appear when both
the government officials and the computer program
try to draw the districts to maximize the number of
seats a certain party wins.
Figure 1: Visualization of the Results (Picture credit: Original).
When elections are done by districts and in a
majoritarian manner, winning a district by 1 vote and
winning a district by 1000 votes have essentially the
exact same effect. Therefore, when a party aims to
maximize the seats they get, they try to win many
districts with a very small margin and let the opponent
party win districts with a large margin. In the 1 district
the Democratic Party won in the computer drawn
districts and 3 of the 5 districts the Democratic Party
won in the actual 2012 districts, the Democrats won
by getting over 80% of the votes in the district. In
contrary, most of the districts the Republican Party
won, in both the computer drawn districts and the
actual districts, they got just above 50% of the votes.
In addition, when dealing with places where the
opponent leads by a little, both the government
officials and the linear programming model try to
group the region with other ones where the
Republicans are leading to achieve an overall
Republican winning district.
4.4 Other Observations
In this study, the author only took into account two of
the five common requirements of redistricting:
integrity and population equality. As a result, the
results the author got seem extreme and unrealistic.
As shown in figure 2, the districts created by the
program do not have any reasonable pattern. A
district may involve counties that are separate and far
apart from each other. It is impossible for this plan to
be implemented in reality.
Application of Linear Programming in Gerrymandering for Optimal Partisan Gain in the United States
479
Meanwhile, the population equality constraint did
not function as expected, as evidently shown in figure
2. This is mainly due to the fact that the author did not
allow counties to be split into different districts,
hoping to satisfy the requirement that existing county
boundaries should be preserved as much as possible.
Without the population equality constraint, the
population of each district differs drastically from
each other. When the population equality condition is
added, the linear programming model fails to yield
meaningful results until the author loosen the
requirement to be greater than 20% of the average
population and less than 180% of the average-at that
point, the requirement does not have much practical
meaning anymore. Despite these drawbacks, the
results mentioned in previous sections are still
significant and valuable to future research in this area.
Figure 2: Population Balance of the Districts Drawn by the Program (Picture credit: Original).
5 CONCLUSION
Using the linear programming model, out program
successfully provided an optimal districting for the
Republican Party in the 2012 Pennsylvania election.
With this approach, the author found a solution that
can secure 17 out of the 18 seats for the Republican
Party despite they only won 49.9% of statewide votes.
The computer calculated districts differ significantly
from the actual districting in 2012, but they share
some similar principles in strategies. For example,
when aiming for maximum partisan interest, a party
should try to let itself win districts by a small margin
and let the opposing party win districts by a large
margin.
When the author looks at the results and reflects
on this study, the author realize that it may have
deeper implications regarding the fairness and
reasonableness of doing elections by districts and the
majoritarian system. Since the Roman Republic,
societies have tried to reflect their citizens’ opinions
by electing representatives from each area with the
hope that the unique opinions of every geographical
area, big or small, can be represented.
However, from the House of Commons in Britain,
to the Electoral College in the United States, to the
House of Representatives election in each state, the
district-based majoritarian system has caused
troubles because such elections cannot reflect the true
popular opinion overall. Indeed, when leaders are
chosen based on district elections and under a
majoritarian system, the party that is more popular
overall in a state or a nation does not always get the
dominant influence they deserve. With
gerrymandering strategies, a party can obtain
influence in a state or a nation that is more than the
support they truly have among the people.
EMITI 2025 - International Conference on Engineering Management, Information Technology and Intelligence
480

These issues force the author to confront with a
critical issue: how to balance geographic
representation with the accurate reflection of popular
will. While the district-based majoritarian system
aims to give voice to local communities, they often
distort outcomes-especially when manipulated
through gerrymandering. To uphold democratic
integrity, the author must confront these structural
flaws and pursue reforms-this is an urgent, important,
yet challenging task for all of people.
First of all, the author did not apply all of the
constraints for gerrymandering in this study. As a
result, the model and result does not fully reflect the
real life scenario. Although the author lifts the
restraints on purpose, in the future, researchers should
endeavor to create more complex and robust models
that also addresses the other three constraints-
contiguity, no enclaves, and compactness-since the
model did not function well without all of the
restraints being included. Researchers can try to
model the counties with more complex data structures
such as graphs or use vectors to record a county’s
location relative to other counties.
In addition, the author did not allow counties to be
split into different districts, and the population
equality constraint was affected by that. In the future,
researchers can try to break down a state to the city
level for a more realistic and accurate model.
Furthermore, in future studies, researchers can try
to replicate this study in different states and in
different years and look for patterns on a broader
scope. They may also try to aim for the maximum
benefit of the Democratic Party instead of the
Republican Party or apply a linear programming
model to a situation with more than two parties. They
may also try to aim for optimal fairness instead of
optimal partisan gain when drawing the districts with
a linear programming model.
REFERENCES
Chatterjee, T., DasGupta, B., Palmieri, L., Al‑Qurashi, Z.,
Sidiropoulos, A., (2018). Alleviating partisan
gerrymandering: can math and computers help to
eliminate wasted votes? Annals of Operations Research.
Dugošija, D., Savić, A., Maksimović, Z., (2020). A new
integer linear programming formulation for the
problem of political districting. Annals of Operations
Research, 288, 247–263.
Faure, J. F., et al. (2024). Optimizing representation in
redistricting. Working paper.
Guest, O., Kanayet, F. J., Love, B. C., (2017).
Gerrymandering and computational redistricting.
Scientific Reports.
Jacobs, M., Walch, O., (2018). A partial differential
equations approach to defeating partisan
gerrymandering. Annals of Operations Research.
Okamoto, Y., (2021). Maximizing gerrymandering through
ising model optimization. Scientific Reports, 11(1).
Palomares, J., (2020). Optimal congressional redistricting
and gerrymandering. Scientific Reports.
Trounstine, J., (2025). District vs At-Large Elections.
Center for Effective Government.
Webb, D. P., et al. (2025). Election History, polls, results,
date, and facts. Encyclopedia Britannica.
Zhu, L., Chen, L., Wang, M., (2021). Carbon-adjusted tariff
evaluation model for renewable exports. Energy Policy,
156, 113728.
Application of Linear Programming in Gerrymandering for Optimal Partisan Gain in the United States
481
