
Research on Machine Learning Based Stock Price Prediction Model
Tianhao Xue
a
The School of Computer and Data Engineering, Ningbo Tech University, Ningbo, China
Keywords: Machine Learning, Stock Price Prediction, Financial Market.
Abstract: With the continuous development of the financial market, individual stock price prediction has become an
important research topic in the field of quantitative investment and financial modelling. As one of the world's
leading technology companies, Amazon's stock price fluctuation is highly sensitive to the macroeconomic
environment, industry structure changes, and the company's own operating conditions, showing significant
nonlinear and complex dynamic characteristics. In this paper, the historical stock price data of Amazon from
2000 to 2025 is taken as the research object, and Ridge Regression, Random Forest and Gradient Boosting
Regressor models are constructed for model training. The experimental results show that the Gradient
Boosting Regressor model outperforms the other two models in terms of trend fitting and error control,
showing good generalisation performance and practical potential. This study aims to deepen the understanding
of the dynamic characteristics of financial markets and provide empirical references for individual stock price
prediction.
1 INTRODUCTION
With the development of financial technology and the
wide application of artificial intelligence technology,
data-driven quantitative modelling tools are playing
an increasingly important role in the securities market.
Stock price forecasting, as a core issue in financial
market analysis, is not only a key basis for investment
decisions, but also valuable in risk management, asset
allocation and other areas. Traditional technical
analysis methods and time series models, such as
moving average (MA) and autoregressive sliding
average (ARMA), although effective under specific
conditions, are often inadequate in dealing with the
nonlinear volatility and long- and short-term
dependence characteristics of stock prices.
In the financial market, stock price prediction has
been a hot research issue. With the enhancement of
computing power and the convenience of data access,
data-driven forecasting methods have gradually
replaced traditional statistical modelling methods and
become one of the important research directions in
both academia and practice (Mehtab et al., 2020;
Mehtab & Sen, 2020). In recent years, machine
learning techniques have shown strong potential in
modelling nonlinear relationships and mining time-
series data features (Qi, 2024).
a
https://orcid.org/0009-0004-7320-9531
Among many machine learning methods, Ridge
Regression (RR) is widely used in financial
modelling due to its effective mitigation of the
covariance problem (Ngui, 2023). In addition,
Random Forest Regressor, an integrated learning-
based algorithm, is able to maintain robustness and
interpretability when dealing with high-dimensional
financial data (Zheng et al., 2024; Khaidem et al.,
2016). Gradient Boosting Regressor, on the other
hand, is often used to construct high-performance
predictive models due to its strong fitting ability and
effective correction of bias (Reddy & Kumar, 2022;
Moodi et al., 2023).
It has been shown that these methods outperform
traditional time series models in stock price
forecasting. For example, Mehtab et al. compared the
effectiveness of Random Forest and Deep Learning
methods in price prediction (Mehtab & Sen, 2020);
Reddy and Kumar demonstrated the advantage of
gradient boosting machines over Random Forest in
terms of prediction accuracy (Moodi et al., 2023); and
Qi et al. compared ridge regression with LSTM
models, highlighting the importance of regularisation
in linear models (Adam et al., 2024). Meanwhile,
researchers have also tried to combine multiple
models for integrated prediction to improve stability
and generalisation (Kumar, 2025).
Xue, T.
Research on Machine Learning Based Stock Price Prediction Model.
DOI: 10.5220/0014325100004718
Paper published under CC license (CC BY-NC-ND 4.0)
In Proceedings of the 2nd International Conference on Engineering Management, Information Technology and Intelligence (EMITI 2025), pages 209-215
ISBN: 978-989-758-792-4
Proceedings Copyright © 2025 by SCITEPRESS – Science and Technology Publications, Lda.
209
In this study, the historical stock price data of
Amazon.com from 2000 to 2025 will be used to
assess the comprehensive performance of three
methods, namely ridge regression, random forest
regression and gradient boosted regression, in the
price prediction task through feature engineering and
model comparison. By comparing their performance
in terms of metrics such as Mean Square Error (MSE)
and Coefficient of Determination (R²), the aim is to
select the most suitable modelling solution for this
dataset and to provide a systematic analysis of their
predictive capabilities.
This study is not only of theoretical significance,
which helps to enrich the application scenarios of
machine learning methods in the financial field; but
also of practical value, which provides investors,
quantitative traders and financial institutions with a
feasible modelling solution and tool support.
2 DATA ANALYSIS AND
MODELLING METHODS
Amazon.com, Inc. is a multinational technology
company that operates in a variety of sectors
including e-commerce, cloud computing, artificial
intelligence, digital streaming and logistics. The
company operates multiple global online retail
platforms and offers a wide range of products and
services to consumers and business customers. Its
cloud computing arm, Amazon Web Services (AWS),
is one of the world's leading cloud service providers.
Amazon's stock is listed on the NASDAQ exchange
under the symbol AMZN.
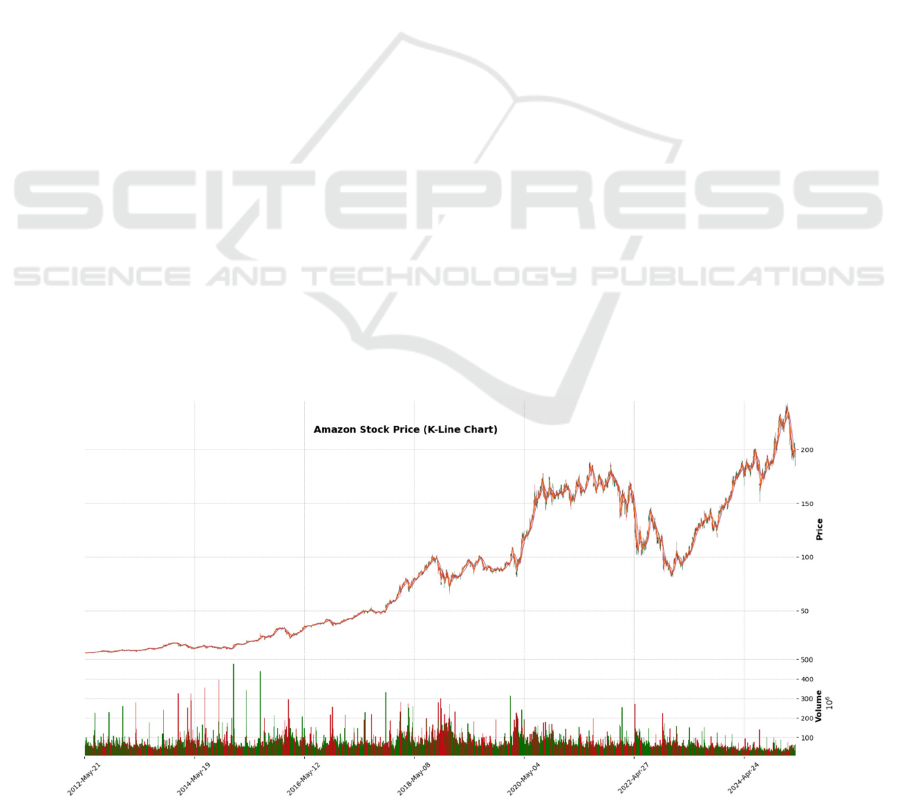
2.1 Stock Data Overview and K-Chart
Analysis
In this paper, the historical stock trading data of
Amazon (Amazon, ticker symbol: AMZN) from
December 2022 to December 2024 are selected,
containing key indicators such as daily opening price,
closing price, high price, low price and volume. In
order to analyse the short-term stock price
fluctuations more visually, the K-plot for the period
from December 2023 to December 2024 (see Figure
1) is plotted in this paper to observe the price trend
and market sentiment during the period.
As can be seen in the Amazon stock K chart
(Figure 1), the stock price showed a clear upward
trend in early 2024. For example, the opening price
on 15 January 2024 was $118.33 and the closing price
was $121.45, forming a positive line and showing a
short-term rise. The stock price fluctuations are
relatively stable, indicating a positive market
sentiment. This volatility is valuable for short-term
trend prediction and feature extraction in machine
learning models.
However, the share price was more volatile on
certain dates, such as 7 February 2024, creating a long
shadow, suggesting that market sentiment was
unstable and affected by external factors.
Nonetheless, the share price ended up closing close to
the opening price, indicating a balanced market
sentiment.
Overall, the K-plot reflects the cyclical
fluctuations of the stock price, the changes in market
sentiment and the impact of volatility on the stock
price, and this information provides key features for
subsequent model training and helps to improve the
accuracy of short-term stock price forecasting.
Figure 1 Amazon stock K chart (Picture credit: Original)
EMITI 2025 - International Conference on Engineering Management, Information Technology and Intelligence
210
2.2 Data Preprocessing
This paper first check for missing data and add the
missing values. Then the date fields are processed by
converting the date column date to datetime type and
extracting the year and month information in
preparation for the subsequent temporal
characterisation. In addition, duplicate values in the
data were identified and processed in this paper to
ensure the uniqueness and integrity of the data.
Descriptive statistical analyses were performed on the
numerical data to understand the distribution and
range of fluctuation of the data. Finally, columns that
were not relevant to the model predictions, including
date, year, month and adj_close (Adjusted Close
Price), were removed, and only variables that were
meaningful to the predictions were retained, such as
open price, close price and volume. These
preprocessing operations provide cleaned and
processed data for subsequent feature engineering
and model training.
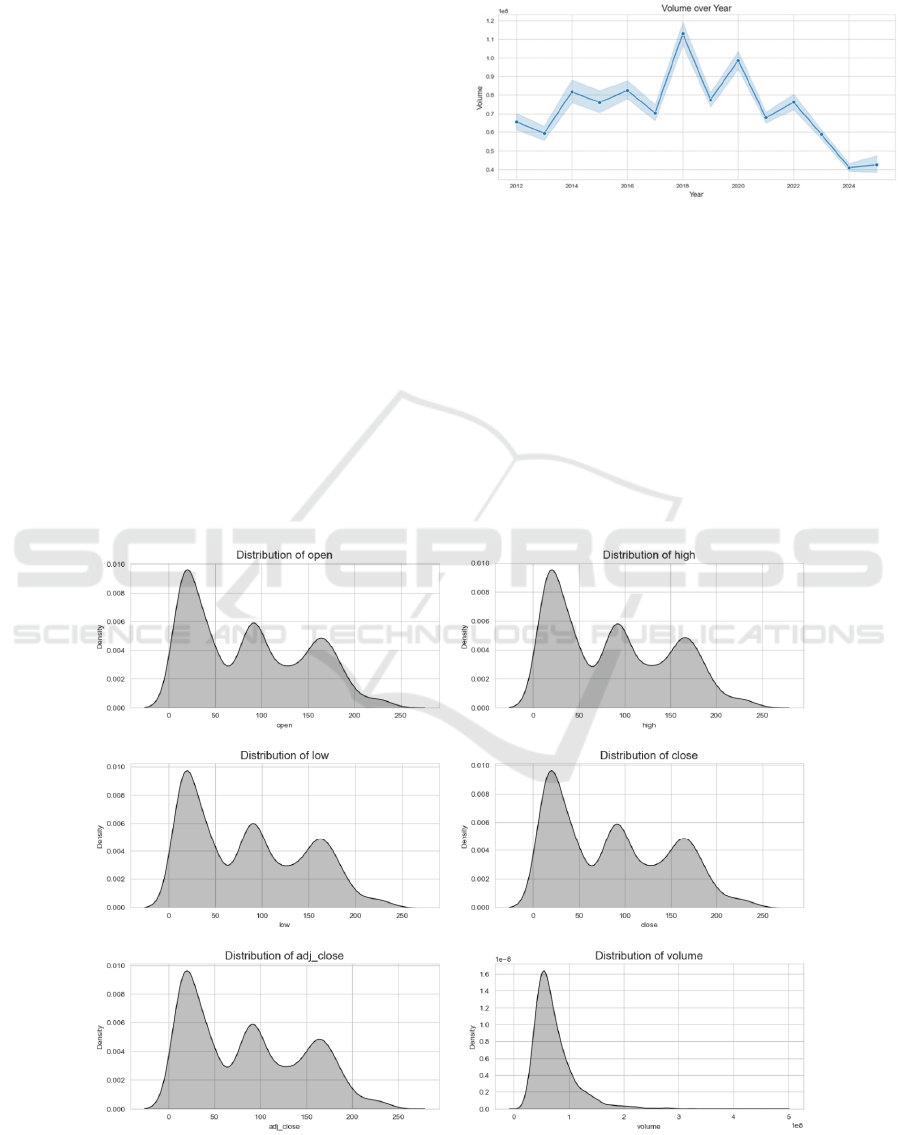
2.3 Feature Engineering
In this paper, by visualising the temporal features, as
in Fig. 2 the volume changes are plotted for different
years and months using sns. lineplot, which helps in
analysing the seasonal fluctuations in stock trading
and market trends.
Figure 2 Amazon stock annual trading volume trend chart
(Picture credit: Original)
In order to analyse stock price trends, as shown in
Figure 3 this paper plots the opening, closing, high
and low prices over time, thus visualising the trend of
price changes and providing a clear graphical
representation for understanding the historical
performance and volatility of stock prices.
To further understand the distribution of features,
as in Figure 4 this paper shows the distribution of
closing prices using violinplot (sns.violinplot), which
helps to identify distributional features and potential
outliers in the data.
Figure 3 Amazon stock characteristics over time (Picture credit: Original)
Research on Machine Learning Based Stock Price Prediction Model
211

Figure 4 Amazon stock closing value violin chart (Picture
credit: Original)
Prior to model training, this paper uses
StandardScaler to normalise the feature data in the
training and test sets to ensure that the data meets the
requirements of the machine learning model and to
avoid model bias due to feature magnitude
differences.
2.4 Model Selection
2.4.1 Random Forest
Random forest is a regression model based on an
integrated learning method, which improves the
accuracy and stability of prediction by constructing
multiple decision trees and weighting the average of
their results. Compared with traditional regression
methods, Random Forest can effectively deal with
complex nonlinear relationships in high-dimensional
feature space and has strong noise immunity. In the
financial market, stock prices are affected by many
factors, and nonlinear relationships and complex
patterns are prevalent, so Random Forest can better
capture these complex market patterns. Although
Random Forest requires more computational
resources for model training and prediction, and
its‘black box’characteristic makes the model less
interpretable, its high prediction accuracy and good
generalisation ability make it an important model in
this study.
2.4.2 Ridge Regression
Ridge regression is an extension of linear regression
that reduces the complexity of the model and solves
the multicollinearity problem by introducing L2
regularisation. The core advantage of ridge regression
is that it avoids overfitting in the presence of highly
correlated features and maintains model stability. In
stock market data, the correlation between features is
strong, and using ridge regression can help alleviate
this problem and improve the predictive power of the
model. Compared with other regression methods,
ridge regression is computationally simple, efficient
in execution, and insensitive to small errors, which
allows it to maintain more reliable prediction results
in the face of complex market data. Therefore, ridge
regression was chosen as one of the benchmark
models for this study to compare with other more
sophisticated models.
2.4.3 Gradient Boosted Regression
Gradient boosted regression is an integrated learning
method that improves the prediction accuracy of a
model by progressively training multiple weak
learners (usually decision trees) and combining their
results to reduce errors in the previous round of
prediction. When dealing with the task of stock price
prediction, gradient boosted regression shows
superior nonlinear fitting and good prediction results,
especially when there are more complex patterns in
the dataset.GBR is able to adapt to trends and
fluctuations in financial market data and capture
subtle changes in the time series. Although the
training process of the method is time-consuming and
sensitive to the adjustment of hyperparameters, its
excellent predictive performance makes it an
important place in this study.
2.4.4 Basis for Model Selection
Three regression models, random forest regression,
ridge regression and gradient boosting regression,
were finally selected for this study with the following
considerations.
First is Adaptability and Performance. Random
Forest Regression and Gradient Boosted Regression
can effectively handle non-linear data and capture
complex market fluctuation patterns, while Ridge
Regression can deal with multicollinearity among
features and has high computational efficiency. The
three complement each other and can show different
advantages in different market situations.
Second is model complexity and computational
efficiency. Ridge regression is computationally
efficient due to its simpler model structure, and is able
to obtain more robust predictions in a short period of
time. In contrast, Random Forest Regression and
Gradient Boosting Regression have longer training
time due to their integrated learning characteristics,
but can provide higher prediction accuracy.
Third is interpretability and stability. Ridge
regression has an advantage in terms of model
interpretability, providing an intuitive analysis of
feature importance. While Random Forest Regression
and Gradient Boosted Regression have high
prediction accuracy, they are more difficult to
EMITI 2025 - International Conference on Engineering Management, Information Technology and Intelligence
212

interpret within the model due to their integration
properties. Nevertheless, when faced with complex
stock market data, these models are able to provide
more accurate predictions and are therefore selected
as the main prediction models in this study.
3 MODEL TRAINING AND
ANALYSIS OF
EXPERIMENTAL RESULTS
3.1 Indicators for Model Evaluation
In order to comprehensively measure the
performance of each regression model in the task of
stock price forecasting, the following Mean Squared
Error (MSE) and Coefficient of Determination (R²)
are selected as the evaluation metrics in this
paper.MSE measures the squared average of the
difference between the predicted value and the actual
value, reflecting the overall prediction accuracy of the
model. n denotes the sample size, i.e., the total
number of data points included in the dataset. Yi
denotes the actual value of the ith sample, i.e., the real
observed data. 𝑦
denotes the predicted value of the ith
sample, i.e., the result predicted by the model based
on the input data. The summation symbols in the
formula are used to sum the errors for all samples,
while the error squared (𝑦
−𝑦
)
denotes the square
of the difference between the actual value and the
predicted value, and the squaring operation removes
the plus and minus signs of error and amplifies the
effects of larger errors. By calculating the MSE, can
quantify the model's prediction error; the smaller the
MSE value, the better the model's prediction.
𝑀𝑆𝐸 =
1
𝑛
(
𝑦
−𝑦
)
(
1
)
The coefficient of determination, R^2is a key
statistical indicator for assessing the predictive
accuracy of a model, with a value between 0 and 1.
The closer it is to 1, the better the model is at
explaining stock price movements. It is defined as:
𝑅
=1−
∑(
𝑦
−𝑦
)
∑(
𝑦
−𝑦
)
(
2
)
where n denotes the sample size, i.e., the total
number of stock price data points used for model
training and testing, 𝑦
is the actual stock price of the
ith sample, 𝑦
is the stock price of the ith sample
predicted by the model, while 𝑦is the average of the
actual stock prices of all the samples, 𝑅
is calculated
by comparing the
difference between the predicted and actual values
of the model (Residual Sum of Squares, RSS) as well
as the difference between the actual value and the
average value (Total Sum of Squares, TSS), whose
value is closer to 1 indicating that the model is more
capable of explaining the changes in stock prices.
3.2 Experimental Environment and
Development Platform
This experiment uses Windows 11 operating system
and Python 3.10 programming language, the
development work is mainly carried out in Jupyter
Notebook, the environment is configured and
managed by Anaconda, Table 1 shows the main
libraries and their functions used in this paper.
Table 1: shows the main libraries used in this paper and their functions.
Librar
y
Name Functional Descri
p
tion
p
andas Data loadin
g
and time series format
p
rocessin
g
num
py
Numerical Calculations and Arra
y
Mani
p
ulation
scikit-learn Provision of Ridge regression models, standardised tools and assessment indicators
matplotlib Plotting prediction comparisons, error visualisation charts
seaborn For o
p
timisin
g
chart aesthetics
3.3 Model Training and Tuning
During the training process, the model
hyperparameters were adjusted as necessary to
optimise the prediction performance. During the
implementation of the Ridge Regression model,
StandardScaler was used in this experiment to
preprocess the features to ensure the stability and
efficiency of model training. By setting the
regularisation parameter alpha to 1200.0 and
significantly enhancing the regularisation strength of
the model, this measure effectively reduces the risk of
overfitting. Thanks to the properties of the ridge
regression algorithm, the model training process not
only converges quickly, but also has a very high
computational efficiency, which makes it a reliable
Research on Machine Learning Based Stock Price Prediction Model
213
choice for dealing with datasets with multiple
covariate features.
When constructing the Random Forest model
(Random Forest), this experiment set the number of
trees (n_estimators) to 9 and the maximum depth
(max_depth) to 1, with a view to striking a balance
between model complexity and generalisation ability.
Initially, the default parameters were adopted as the
baseline model, and the model was carefully tuned
according to the actual performance of the test set.
Random Forest is known for its excellent nonlinear
fitting ability, which makes it particularly suitable for
capturing the volatility characteristics of non-
stationary time series data such as stock prices, and
thus performs well in data analysis.
In constructing the Gradient Boosting Regressor
(GBR) model, the parameter configurations of 0.01
for the base learning_rate and 100 for the number of
iterations (n_estimators) were chosen in this
experiment to strengthen the learning effect of the
model on the data. Compared with the random forest
regression model, gradient boosting regression
focuses more on the fitting of residuals in each
iteration, thus demonstrating its superiority in
generalisation ability. Despite its relatively long
training time, it is usually able to achieve higher
prediction accuracy.
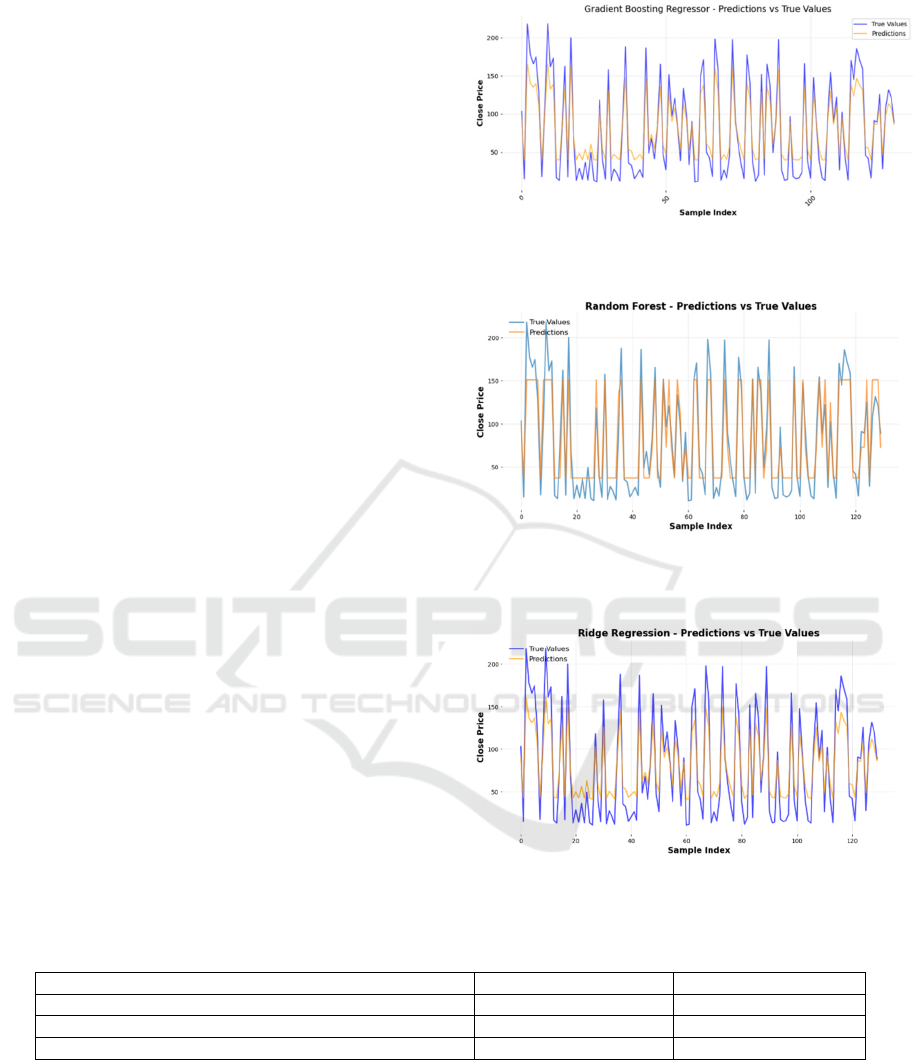
3.4 Presentation and Comparison of
Experimental Results
After the completion of the experiments, line plots of
the predicted value versus the actual stock price of
each model on the test set are plotted (Figure 5, Figure
6, Figure 7) to visually demonstrate the model's
fitting ability and the degree of trend capturing.
Figure 5: Gradient Boosting Regressor Predicted Values vs
True Values.
Figure 6: Comparison of predicted and true values of
Random Forest model.
Figure 7: Ridge regression model predictions vs true values.
Table 2: Comparison of models.
Model name MSE R²
Gradient Boosting Regresso
r
535.13 0.87
Random Forest 440.96 0.87
Rid
g
e Re
g
ression 435.06 0.82
Table 2 shows the experimental results of
different models. From the above experimental
results, it can be seen that the ridge regression model
performs stably within the smooth trend interval of
the data, but its prediction accuracy decreases when
facing large fluctuations in the data. The Random
Forest model, on the other hand, demonstrates the
ability to capture complex nonlinear features and is
particularly suitable for dealing with sudden ups and
downs in the data. The gradient boosting model, on
the other hand, performs the best among all the
models, as it not only achieves the highest R² value,
but also has the smallest integrated error, and is
therefore considered the optimal forecasting model.
EMITI 2025 - International Conference on Engineering Management, Information Technology and Intelligence
214

Taken together, the gradient boosting regression
model satisfies the experimental criteria due to its
superior prediction accuracy and is finally
recommended as the main prediction model in this
paper.
4 CONCLUSIONS
Based on the historical stock price data of
Amazon.com from 2000 to 2025, this paper explores
the performance differences of three typical machine
learning regression models with different feature
dimensions and training strategies around the stock
price prediction task. The experimental results show
that ridge regression has a good fitting effect in the
smoother data interval, and the model is concise and
stable in training; the random forest model shows
some advantages in dealing with nonlinear
relationships and feature interactions, but has a high
parameter dependence and is prone to overfitting on
the training set; and the gradient boosting model
shows stronger generalisation ability and robustness
in capturing stock price trends and detailed
fluctuations, and is suitable for complex financial
forecasting environment. Through comparative
analysis, this study not only verifies the effectiveness
of integrated learning models in stock price
prediction, but also provides empirical references for
modelling practices in related fields.
Although this study has achieved some results,
there are still some limitations. Firstly, limited by the
data structure and feature selection, the model has a
limited ability to respond to unexpected events and
extreme market conditions; secondly, more
sophisticated deep learning models, such as LSTM or
Transformer architectures, were not introduced in the
study, and their potential for modelling time series
has not been fully explored. Future research can
further expand in the following aspects: introducing
heterogeneous data from multiple sources (e.g., news,
financial reports, macro indicators) to improve the
diversity and depth of features; applying deep
learning and hybrid modelling techniques to enhance
the model's ability to understand time series structure
and market sentiment; and further optimising the
model tuning strategy and validation method to
improve the practicability and popularity.
In summary, this study demonstrates the
promising application of machine learning in
financial time series forecasting, showing that data-
driven methods have strong modelling capabilities
and decision support value in complex market
environments.
REFERENCES
Adam, H. A., Raditiansyah, F., Imani, M. R., Fawwaz, M.
F., Julham, J., & Lubis, A. R. (2024). Comparison of
ARIMA and LSTM Models in Stock Price Forecasting:
A Case Study of GOTO. JK. Journal of Informatics and
Telecommunication Engineering, 8(1), 94–105.
Khaidem, L., Saha, S., & Dey, S. R. (2016). Predicting the
direction of stock market prices using random forest.
arXiv preprint arXiv:1605.00003.
Kumar, A. (2025). Developing a Stock Price Predictor:
Enhancing Investment Strategies with Machine
Learning. [Online]. Available:
https://medium.com/@amit.saptech/developing-a-
stock-price-predictor-enhancing-investment-strategies-
with-machine-learning-7bcb5aeb5a85
Mehtab, S., & Sen, J. (2020, November). Stock price
prediction using CNN and LSTM-based deep learning
models. In 2020 International Conference on Decision
Aid Sciences and Application (DASA) (pp. 447–453).
IEEE.
Mehtab, S., Sen, J., & Dutta, A. (2020, October). Stock
price prediction using machine learning and LSTM-
based deep learning models. In Symposium on Machine
Learning and Metaheuristics Algorithms, and
Applications (pp. 88–106). Singapore: Springer
Singapore.
Moodi, F., Jahangard-Rafsanjani, A., & Zarifzadeh, S.
(2023). Feature selection and regression methods for
stock price prediction using technical indicators. arXiv
preprint arXiv:2310.09903.
Ngui, S. W. (2023). How to Use Ridge Regression to
Predict a Stock Price. Medium. [Online]. Available:
https://swngui.medium.com/how-to-use-ridge-
regression-to-predict-a-stock-price-1b0099320ef4
Qi, Y. (2024). Research on Stock Price Prediction Based on
LSTM Model and Random Forest. Advances in
Economics, Management and Political Sciences, 86,
35–42.
Reddy, P. V., & Kumar, S. M. (2022, December). A novel
approach to improve accuracy in stock price prediction
using gradient boosting machines algorithm compared
with naive Bayes algorithm. In 2022 4th International
Conference on Advances in Computing,
Communication Control and Networking (ICAC3N)
(pp. 695–699). IEEE.
Zheng, J., Xin, D., Cheng, Q., Tian, M., & Yang, L. (2024).
The random forest model for analyzing and forecasting
the US stock market in the context of smart finance.
arXiv preprint arXiv:2402.17194.
Research on Machine Learning Based Stock Price Prediction Model
215
