
Construction of College Students' Happiness Index Evaluation Model
and Optimization of Budget Allocation—Integrated Application of
Analytic Hierarchy Process and Linear Programming
Peiwen Luo
a
College of Mathematic and Statistic, Chongqing University, Chongqing, 400000, China
Keywords: College Students, Happiness Index, AHP, Linear Programming, Budget Optimization.
Abstract: The College students constitute a distinct demographic characterized by strong consumption desires coupled
with limited financial resources, which poses challenges to their overall well-being as measured by the
happiness index. This study aims to enhance the happiness index of college students by first collecting
empirical data on the allocation proportions of living expenses and their respective contributions to happiness
through structured questionnaire surveys. The Analytic Hierarchy Process (AHP) employing a 1–9 scale was
utilized to quantitatively assess the happiness index associated with each expenditure category, with
subsequent consistency testing of the judgment matrix confirming the validity of the evaluations. A
constrained linear programming model was then developed, defining the maximization of the aggregate
happiness index as the objective function and treating the proportional distribution of living expenses as
decision variables. By optimizing these allocations, the model seeks to maximize overall student happiness.
Validation through a case study on a randomly selected participant’s expenditure data demonstrated a
substantial increase in the happiness index post-optimization, thereby confirming the model’s applicability
and efficacy. This integrative methodological approach combining AHP and linear programming provides a
novel framework for the quantitative assessment and optimization of subjective well-being among college
students, offering significant implications for targeted financial planning and welfare improvement strategies.
1 INTRODUCTION
From the perspective of consumption, college
students, as an important component of the social
population, have consumption levels that largely
reflect the overall development of the national
economy. Whether their consumption structure is
scientific and reasonable not only affects their own
quality of life but also relates to their personal
financial stability (Gu, 2024). On one hand, college
students tend to have strong consumption desires
while lacking comprehensive spending plans, which
often leads to situations where their consumption
concepts are advanced, but their actual consumption
capacity is insufficient. On the other hand, their
sources of income are relatively singular, with the
vast majority relying on financial support from their
parents for living expenses (Chen, 2020). Based on
these two conditions, it can be observed that the
a
https://orcid.org/0009-0008-6719-9751
income and expenditure patterns of college students
are relatively simple, making them easier to
investigate and optimized yet such efforts are also
highly necessary. From the perspective of happiness
index, the college stage plays a critical role in the
transmission of knowledge and the cultivation of
skills for future labour forces. Therefore, ensuring the
well-being of college students is not only a key factor
in promoting effective learning, but also a proper and
necessary approach in line with the goals of 21st-
century education outcomes (Cosmas et al., 2022).
Consumer behaviour refers to the comprehensive
manifestation of consumers' psychological needs,
purchasing motivations, consumption intentions, and
their actual behaviours (Khairuddin and Mahmud,
2020). The happiness index, on the other hand, is a
quantifiable indicator artificially designed to evaluate
the degree of happiness. By combining the two
aspects-consumer behaviour and the happiness index-
it becomes evident that the sense of satisfaction
Luo, P.
Construction of College Students’ Happiness Index Evaluation Model and Optimization of Budget Allocation—Integrated Application of Analytic Hierarchy Process and Linear Programming.
DOI: 10.5220/0014323900004718
Paper published under CC license (CC BY-NC-ND 4.0)
In Proceedings of the 2nd International Conference on Engineering Management, Information Technology and Intelligence (EMITI 2025), pages 151-156
ISBN: 978-989-758-792-4
Proceedings Copyright © 2025 by SCITEPRESS – Science and Technology Publications, Lda.
151
derived from consumption can influence consumers'
perceived happiness (Shi et al., 2024). Therefore, it
can be reasonably understood that appropriate
consumer behaviour contributes positively to the
improvement of the happiness index. Conversely,
inappropriate or irrational consumption behaviour
can have adverse effects on the happiness index of
college students (Ong et al., 2022).
Existing research generally focuses on the
economic attributes of consumer behaviour,
emphasizing objective indicators such as the Engel
coefficient, while often overlooking the underlying
mechanisms linking consumption choices to
subjective well-being. Although methods such as
Analytic Hierarchy Process (AHP) and linear
programming have been applied in the evaluation of
quantitative data and the study of economic issues,
limited attention has been given to the combined
analysis of college students’ living budgets and the
optimization of quantified happiness indices (Saaty,
2008; Chen and Wang, 2019).
This study innovatively constructs a three-tier
analytical framework of “Consumption Clustering –
Happiness Quantification – Budget Optimization.”
First, by integrating data from questionnaire surveys
and publicly available databases, key expenditure
dimensions in daily life are identified. Subsequently,
an improved Analytic Hierarchy Process (AHP)
model-enhanced with λ-consistency checks and
modified using the entropy weight method-is
employed to quantify the contribution weights of each
dimension to the happiness index (Wen et al., 2018).
Finally, a constrained linear programming model is
established, using the minimum necessary
expenditure as the boundary condition, to solve for
the optimal budget allocation scheme under the
objective function of maximizing the happiness
index. Compared with traditional single-dimensional
economic models, this framework achieves a
dynamic coupling between the objective
quantification of consumption behaviour and the
subjective perception of well-being, thereby
identifying an optimal balance point for budget
optimization and happiness improvement among
college students.
2 METHODS
2.1 Data Resource
The quantitative data on college students’
consumption-related happiness, as well as data on the
primary expenditure categories and their proportions
in students’ living expenses, were obtained through a
questionnaire survey. The survey was conducted
among 100 undergraduate students from various
regions.
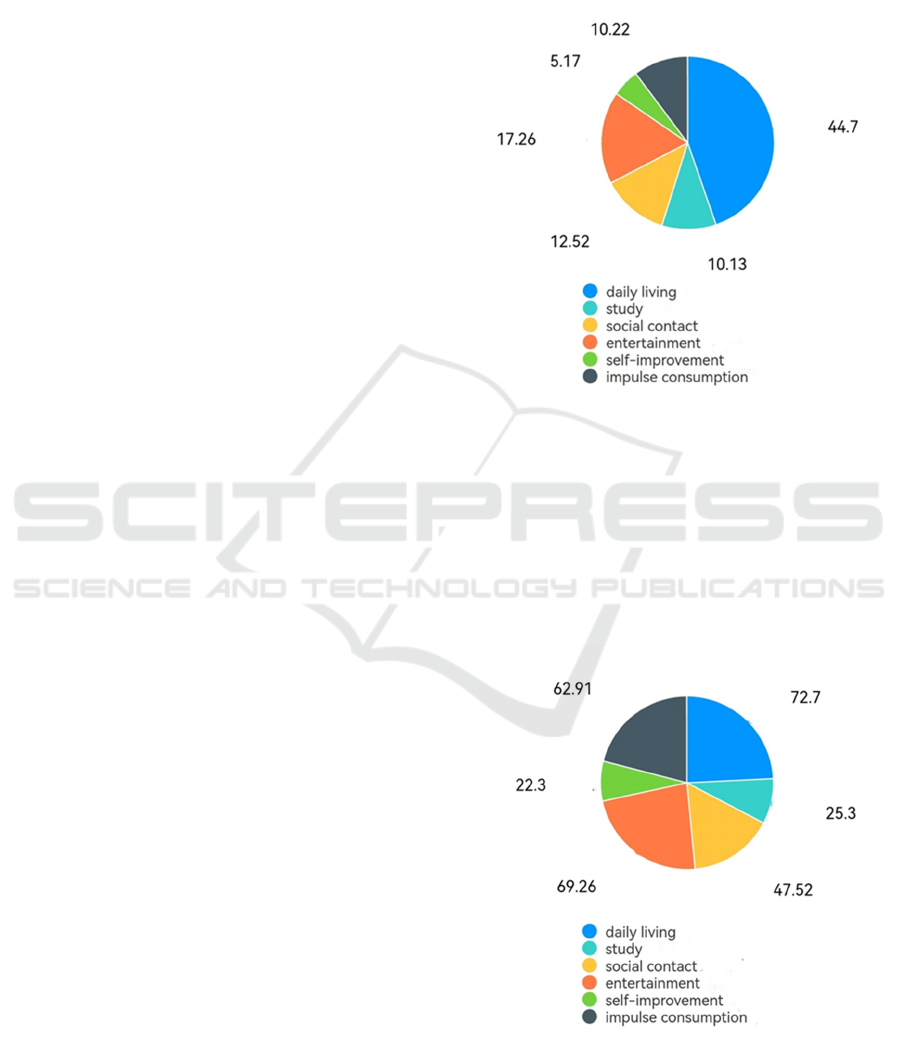
Figure 1: Chart of College Students’ Living Expense
Categories and Their Proportions (Picture credit: Original).
The figure 1 above presents the statistical distribution
of the average proportions of college students’ living
expenses by category, based on data collected
through the questionnaire survey. It reflects the major
expenditure categories and their approximate shares
in the overall budget.
Figure 2: Chart of Contribution Proportions to the
Improvement of College Students’ Happiness (Picture
credit: Original).
EMITI 2025 - International Conference on Engineering Management, Information Technology and Intelligence
152
The figure 2 above presents the average values of the
perceived contribution of each expenditure category
to happiness improvement, based on data collected
through the questionnaire survey (original
proportions normalized from 300%). It reflects a
simplified quantitative assessment of how each
spending category contributes to the enhancement of
college students’ happiness.
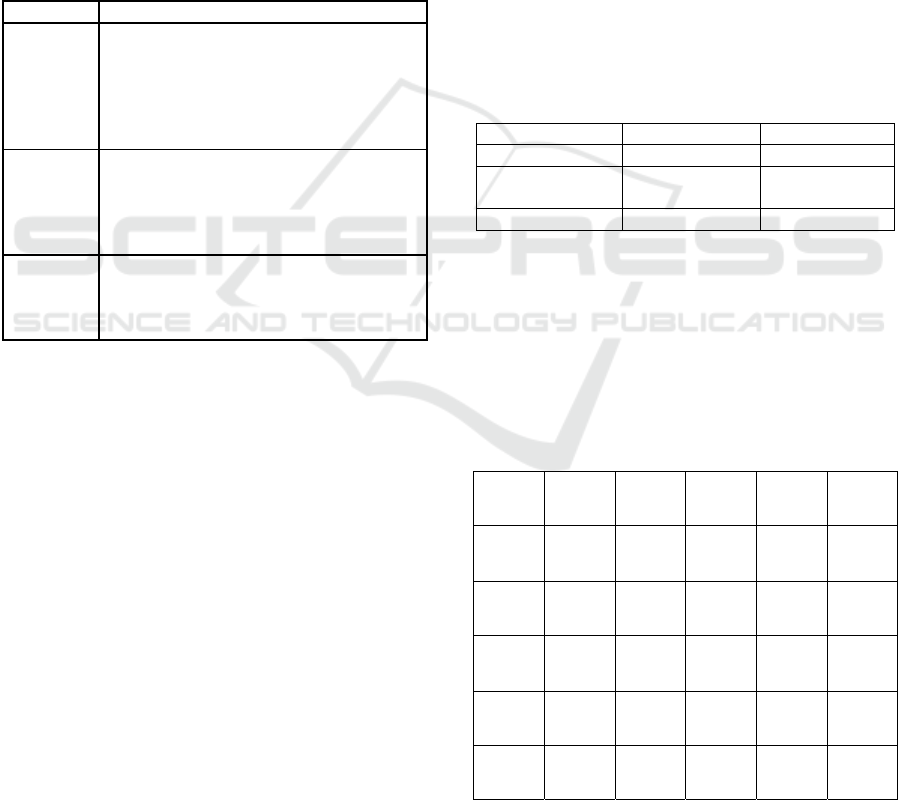
2.2 Variable Description
The table 1 explains the variables that need to be used
in the subsequent mathematical modeling process and
their explanations.
Table 1: Table of variable description
Variable Descri
p
tion
𝑐
Quantitative data of the relatively
subjective comprehensive evaluation of
the happiness index ratings for each
expenditure category of college students’
living expenses, based on the
questionnaire results.
𝑥
Proportion of each expenditure category
in the total living expenses of college
students (calculated as percentages; the
percentage sign is omitted in subsequent
tables).
M The total happiness index calculated by
summing the happiness indices of all
expenditure categories for college
students’ living expenses.
2.3 Method Overview
This paper utilizes data obtained from a survey to
establish a rating system for each category of living
expenses. A judgment matrix is constructed, and the
consistency of the matrix, along with the value of its
determinant, is used to validate the rationality of the
rating system. The happiness rating index for each
expenditure category is then derived. Subsequently,
an objective function is formulated, and constraints
are set based on the relevant data of college students'
living expenses. Using linear programming, the
proportion of each expenditure category is optimized,
aiming to maximize the overall happiness index.
3 RESULTS AND DISCUSSION
3.1 Data Analysis and Production
3.1.1 Quantitative Data for Happiness Index
Ratings
Based on the collected happiness rating data, the 1-9
scale method from the Analytic Hierarchy Process
(AHP) is used to quantify the happiness index-that is,
each expenditure type is rated on a scale from 1 to 9
according to its relative importance (the higher the
score, the more important the category). The
consumption types are categorized into six groups:
daily living, study, social contact, entertainment, self-
improvement, and impulse consumption. The
happiness rating indices are rounded to the nearest
integer to maintain consistency, and the resulting data
are presented in the following table 2:
Table 2: Happiness Index Rating Table
Daily living Study Social contact
72 5
Entertainment
Self-
im
p
rovement
Impulse
consum
p
tion
72 6
The table 2 above presents a scientific quantification
of the happiness index using the 1-9 scale method,
based on the proportional distribution of the
simplified happiness index ratings. A pairwise
comparison matrix is constructed based on the
relative importance between the six influencing
factors, as shown below (Table 3):
Table 3: Judgment Matrix
1 3/7 5/7 1 2/7 6/7
7/3 1 5/3 7/3 2/3 2
7/5 3/5 1 7/5 2/5 6/5
1 3/7 5/7 1 2/7 6/7
7/2 3/2 5/2 7/2 1 3
7/6 1/2 5/6 7/6 1/3 1
Construction of College Students’ Happiness Index Evaluation Model and Optimization of Budget Allocation—Integrated Application of
Analytic Hierarchy Process and Linear Programming
153
The consistency index (CI) is defined as:
𝐶𝐼 =
𝜆−𝑛
𝑛−1
(1)
Where, n represents the order of the judgment matrix,
and λ denotes the maximum eigenvalue of the matrix.
Next, the random index (RI), which corresponds to
the value of n, is obtained from a standard reference
table 4:
Table 4: Random Index (RI) Table (Bi, 2023)
n 3 4 5 6 7 8
RI 0.58 0.90 1.12 1.24 1.32 1.41
The table 4 above presents an empirically derived
statistical value associated with the matrix dimension
n, which is used to assess whether the current
judgment matrix demonstrates greater consistency
than a randomly generated matrix.
Finally, the consistency ratio (CR) is calculated as:
𝐶𝐼 =
𝐶𝐼
𝑅𝐼
(2)
The computation yields CR ≈ 1.43 × 10⁻¹⁶ < 0.1,
which is infinitesimally close to zero. Therefore, the
consistency requirement is satisfied, and the
rationality of the quantified happiness index ratings is
validated, allowing for further data processing.
3.1.2 Range of College Students’ Living
Expense Categories
Based on the collected data on college students’
living expense categories and their corresponding
proportions, the mean (μ) and standard deviation (σ)
for each expenditure category are calculated. To
eliminate the influence of outliers on the normal
range, the interval μ ± σ, which covers approximately
65.26% of the data, is adopted as the reasonable range
for the proportion of each living expense category.
By calculating, the mean proportion μ and standard
deviation σ for each expenditure category were
obtained. To simplify the computational complexity
during model construction, the values were rounded.
The results are as follows:
Table 5: Table of Mean Proportions (μ) for Each
Expenditure Category
Dail
y
livin
g
Stud
y
Social contact
45 10 13
Entertainment
Self-
im
p
rovement
Impulse
consum
p
tion
17 5 10
Table 6: Table of Standard Deviations (σ) of Proportions
for Each Expenditure Category
Daily living Study Social contact
17 6 11
Entertainment
Self-
im
p
rovement
Impulse
consum
p
tion
13 8 9
These two variables from table 5 and 6 can be used to
calculate the normal range of living expense
proportions for each expenditure category among
college students. If the lower bound, calculated as μ -
2σ, is less than 0, it is reasonably adjusted to 0. The
final ranges are shown as follows:
Table 7: Table of Normal Ranges for College Students’
Living Expense Proportions by Expenditure Category
Dail
y
livin
g
Stud
y
Social contact
(28,62) (4,16) (2,24)
Entertainment
Self-
im
p
rovement
Impulse
consum
p
tion
(
4,30
)
(
0,13
)
(
1,19
)
The above table 7 can basically clarify the normal
range of each expenditure direction, that is, the upper
and lower limits of constraints.
3.2 Model Building
3.2.1 Define Decision Variables
Based on the analysis of existing data, it was found
that the data type suitable for adjustment and
optimization is the proportion of college students’
living expenses allocated to different categories.
Therefore, this paper defines 𝑥
is the proportion of
living expenses allocated to the 𝑖 category. This
approach to defining decision variables focuses the
study on the proportions of living expenses, thereby
avoiding difficulties in investigating and collecting
data caused by the diverse and complex family
backgrounds of college students.
3.2.2 Establish the Objective Function
To establish the objective function, the goal must be
clarified: using a mathematical model to optimize the
proportions of college students’ expenditures to
maximize the overall happiness index. Based on the
existing data and analytical results, linear
programming is identified as the optimal method for
this optimization. Therefore, the objective function
can be defined as follows: 𝑀=𝑐
𝑥
. Where, 𝑐
represents the happiness index associated with each
EMITI 2025 - International Conference on Engineering Management, Information Technology and Intelligence
154

expenditure category, and 𝑥
denotes the proportion
of living expenses allocated to each category.
By optimizing this objective function through
adjusting the decision variables, the maximum overall
happiness index can be achieved.
3.2.3 Set General Constraints
Based on previous calculations, the normal range of
the decision variables, the proportions of college
students’ living expenses allocated to each category-
can be clearly defined as: (𝜇
−σ
,𝜇
+σ
), where
μᵢ represents the meaning of the data for the ith
expenditure category, and σᵢ represents the standard
deviation of the data for the ith category. By using the
normal range of college students’ living expense
proportions as constraints on the decision variables,
approximately 98% of the typical data is included,
while the influence of outliers is effectively excluded.
3.2.4 Set Type Constraints
Individual consumption behaviors and habits vary
and tend to be persistent over time. In other words,
long-established consumption habits are difficult to
change drastically in a short period, and abrupt
adjustments to expenditure structures are neither
practical nor scientific. This consideration represents
an innovative aspect of this study. Considering the
diversity of consumption habits among college
students, this paper classifies the population into two
types: impulsive consumers and non-impulsive
consumers.
When the proportion of impulse consumption
exceeds 10% (approximately μ), the individual is
classified as an impulsive consumer. This personality
type is characterized by a lack of clear consumption
plans and a relatively high share of impulsive
expenditures in living expenses. The emotional value
provided by this behavior, i.e., the enhancement
effect on the happiness index, is more pronounced.
Accordingly, this paper sets the constraint on impulse
consumption proportion as: (0.1, μ + σ).
Conversely, when the impulse consumption
proportion does not exceed 10% (approximately μ),
the individual is classified as a non-impulsive
consumer. This personality type features well-defined
consumption plans and a relatively low share of
impulsive expenses, with a weaker contribution to the
improvement of the happiness index. Thus, the
constraint on impulse consumption proportion for this
type is set as: (μ − σ, 0.1).
By incorporating these type-specific constraints,
the model scientifically addresses the optimization
needs of different consumption habit groups among
college students, further enhancing their overall
happiness index.
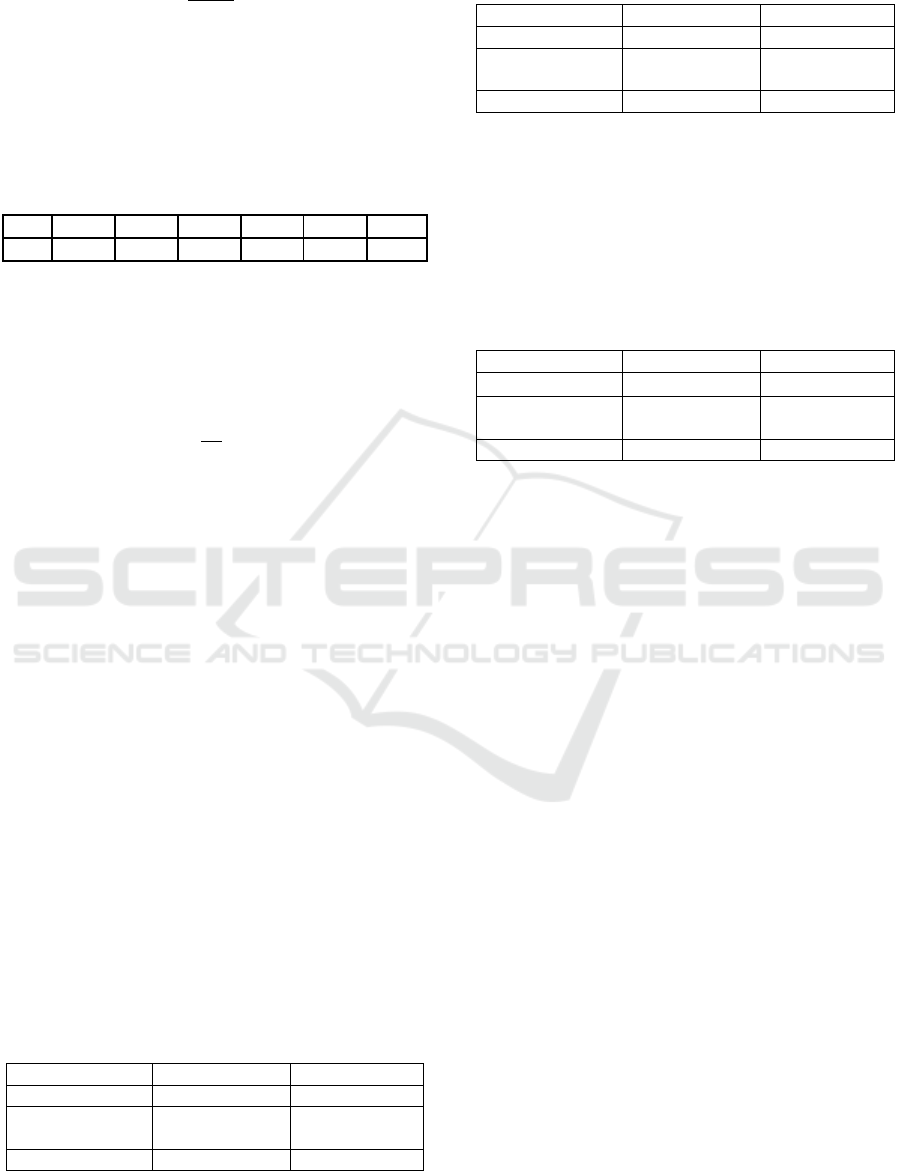
3.3 Model Application
A randomly selected student's living expense
allocation from the questionnaire is used for
optimization. The original proportion data for each
expenditure category is as follows (Table 8, 9):
Table 8: Table of Original Living Expense Proportions.
Dail
y
livin
g
Stud
y
Social contact
40 10 15
Entertainment
Self-
im
p
rovement
Impulse
consum
p
tion
15 10 10
Based on the formula, the original total happiness
index is calculated to be 5.6. The established
mathematical model is then applied to optimize the
living expense proportions. The optimized results are
as follows:
Table 9: Table of Optimized Living Expense Proportions.
Daily living Study Social contact
62 4 2
Entertainment
Self-
improvement
Impulse
consumption
30 0 2
By applying the objective function again, the
optimized total happiness index is calculated to be
6.74, which is significantly higher than the original
value of 5.6. This result validates the effectiveness
and rationality of the proposed model.
4 CONCLUSION
Through the above discussion, this paper constructs a
mathematical model that first quantifies the happiness
index ratings associated with each category of college
students’ living expenses. The model then optimizes
the allocation of these expenses to maximize the total
happiness index. To validate the model’s
effectiveness, a randomly selected student's data was
used for optimization, and the increase in the total
happiness index from pre-optimization to post-
optimization confirmed the model’s feasibility.
This model addresses the challenge of
coordinating college students’ living expense
Construction of College Students’ Happiness Index Evaluation Model and Optimization of Budget Allocation—Integrated Application of
Analytic Hierarchy Process and Linear Programming
155

allocations and contributes to enhancing their overall
happiness index.
However, the model has certain limitations. For
instance, it only considers constraints based on the
average values of each indicator, without accounting
for the differentiated preferences of students with
varying personalities. This presents a potential
direction for future refinement.
REFERENCES
Bi, L., (2023). Research on the Construction of a Complete
Evaluation Index System for Higher Mathematics
Based on the Analytic Hierarchy Process. Shandong
Vocational College of Engineering and Technology.
Chen, L., Wang, Y., (2019). Optimal Personal Financial
Planning Using Linear Programming under Uncertainty.
Journal of the Operational Research Society, 70(9),
1481-1493.
Chen, P., (2020). Investigation and Analysis of College
Students’ Consumption Structure. School of
Mathematics and Computer Science, Hengshui
University.
Cosmas, G., et al., (2022). The effects of resiliency on
university students' happiness and life effectiveness
amid the covid-19 pandemic: religious faith stands as a
moderator. International Journal of Religion &
Spirituality in Society, 12(2).
Gu, K., (2024). Research on the Impact of E-commerce on
Urban-Rural Integration Development. Shandong
University of Finance and Economics.
Khairuddin, M. T., Mahmud, Z., (2020). Modelling the
effects of psychological well-being attributes on
students' happiness. Journal of Physics: Conference
Series, 1496(1).
Ong, A. K., et al., (2022). Factors affecting students'
happiness on online learning during the covid-19
pandemic: a self determination theory approach.
International Journal of Information and Education
Technology.
Saaty, T. L. (2008). Decision Making with the Analytic
Hierarchy Process. International Journal of Services
Sciences, 1(1), 83-98.
Shi, Y., Wu, S., Yuan, Y., (2024). Research on the
Influence Mechanism of Different Types of Sustainable
Consumption Behavior on Consumer Happiness. Asian
Journal of Economics, Business and Accounting, 24(9),
135-145.
Wen, N. L., Guo, Y. H., Ji, J. S., (2018). A study on the
present situation and educational countermeasures of
contemporary female college students' happiness.
Education Teaching Forum.
EMITI 2025 - International Conference on Engineering Management, Information Technology and Intelligence
156
