
Research on Vertical Synergy and Financial Contributions: A Case
Study on Tesla and Solar City
Heming Chen
Monsignor Kelly Catholic High School, Texas, 77707, U.S.A.
Keywords: Vertical Merger, Economies of Scale, Sales Synergy, Market Expansion, Financial Risks.
Abstract: To understand the synergy effect of vertical merger in positive and negative aspects, this paper takes the
vertical merger of Tesla and SolarCity as the case study example. More specifically, this research focuses on
the integration of electric vehicle manufacturer as well as solar energy production in aspects of cost reduction,
sales synergy and market expansion. Internal financial data and industry reports on the vertical merger
implicates that the vertical merger case can result in cost savings in differed operational aspects, in sales
bundling and synergy as well as in market expansion in renewable energy sector. Despite that, vertical merger
also leads to challenges in aspects of cultural clash, the surge in long-term debt as well as antitrust litigation
costs and risks. This research is meaningful as critical financial data in short and long term is analyzed to
understand synergy effects. Overall, this paper implicates that vertical integration can enhance
competitiveness given sales and market synergy and economies of scale, but needs to be managed carefully
in cultural, financial and regulatory aspect.
1 INTRODUCTION
Mergers and acquisitions have become significant
ways to improve market competitiveness and
maximise resource allocation given ongoing
globalisation and technological development (Rohra
& Anita, 2023). Among these, vertical mergers are
especially interesting since they can link the upstream
and downstream portions of the industry chain, hence
generating possible synergies.
The impact of vertical integration has been
explored by various scholars. Although there is no
conclusive evidence indicating M&A’s direct
contribution to value creation through focus-market
measures, accounting measures and mixed measures,
mergers and acquisitions have great contribution to
increased efficiency and profitability in the post
merger and acquisition stage (Rohra & Anita, 2023).
Vertical merger means combining two or more
companies within the industry, which operates in
different stages of the value chain production and
whose functions activities could be interdependent
(Glass & Gori, 2020). Used to enhance synergies,
vertical integration has been accredited for its role in
reducing costs as well as in increasing productivity
and efficiency (Eule – Rich, Kopp & Flügge, 2022).
In the empirical study, efficiency gains of vertical
integration, given the elimination of double
marginalization, improved coordination and
information flow, reduction of transaction cost,
specialization and economies of scale, chances of
innovation and quality control as well as increased
flexibility and responsiveness in the whole supply
chain is elaborated as outcomes of vertical synergy
(De Stefano & Salinger, 2024). Meanwhile, it is
emphasized that economies of scale of vertical
integration can help integrate homogeneous assets
such as production lines and technology to reduce
unit costs and minimize market transactions to cut
down market uncertainties (Lafontaine & Slade,
2007). Economies of scale in vertical integration can
also be represented as technology synergy, market
synergy and financial synergy among firms as well as
sharing of consumer resources (Song & Bin, 2016).
Case study on Yili and Ausnutria concluded that after
vertical integration, the diary giant can integrate both
upstream and downstream resources in the whole
supply chain, helping to assure raw materials supply
stability, improve production efficiency and elevate
product quality (Cao, 2024). In the meantime, it is
concluded that vertical integration has helped two
firms better respond to challenging and competitive
environment as well as market fluctuations to realize
130
Chen, H.
Research on Vertical Synergy and Financial Contributions: A Case Study on Tesla and Solar City.
DOI: 10.5220/0014322800004718
Paper published under CC license (CC BY-NC-ND 4.0)
In Proceedings of the 2nd International Conference on Engineering Management, Information Technology and Intelligence (EMITI 2025), pages 130-137
ISBN: 978-989-758-792-4
Proceedings Copyright © 2025 by SCITEPRESS – Science and Technology Publications, Lda.
sustainable growth of business (Cao, 2024). Through
analyzing data on routes, ticket prices and service
quality, case study in airline industry also implicated
that vertical integration can enhance efficiency and
increase market power (Calrton, Israel, MacSwain &
Orlov, 2019).
The industry and regulatory bodies have paid
great attention to Tesla and SolarCity’s vertical
merger. Founded in 2003 by Elon Musk and other
talented engineers, Tesla’s innovation in electric
vehicle has disrupted the market. With missions to
transit towards sustainable energy and to provide
electric vehicles with clean, efficient and high-
performance features, the company has focused on
synergy and integration in the value chain. Founded
in 2006 by Lyndon and Peter Rive, SolarCity
specialized in designing, installing and financing
solar energy systems for consumers across residential,
commercial and governmental fields. Solar City
became one leading solar panel installers in 2016 in
US with the goal to provide accessible and affordable
solar panels. The year of 2016 marked the decision of
Tesla to acquire SolarCity, with deal value at $2.6
billion. This vertical merger was completed in
November 2016, with SolarCity becoming a
subsidiary of Tesla.
This paper intends to investigate the economic
consequences of Tesla merger, hence investigating
whether the combination can produce the desired
positive outcomes and the negative concerns that
must be handled. By means of this case study, one
may acquire a thorough knowledge of the possible
advantages and obstacles big companies could face
when carrying out merger and acquisition plans.
This article is structured as follows: The second
section examines the favourable economic effects of
this merger—including cost synergies, sales
synergies, and market expansion; the third section
addresses possible negative economic effects, such as
cultural conflicts, financial risks, and antitrust
regulatory risks; finally, the conclusion presents the
research results and provides pertinent insights.
2 FAVORABLE ECONOMIC
RESULTS
2.1 Cost Synergy
The primary benefit of the vertical integration was
cost synergy. As Tesla has control over extensive
solar technology and facility of Solar City post the
vertical merger, Tesla’s reliance on solar components
and energy solutions externally has been cut down.
According to Table 1, the hardware procurement
cost was down by around $150 million within the first
year post the merger (Tesla, 2020). In Pre-merger
stage, Tesla purchased solar parts from third-party
players, which entails 15%-20% markups. However,
post merger, the California factory of Solar City
supplied Tesla directly, cutting down intermediate
cost by $920 million in 2017 alone. Aside from that,
the purchase volume post integration increased to 50
GWh by 2018, three times compared to pre-merger
stage, and the unit cost was down by 22%.
In addition, logistics costs were down after the
integration as the inventory turnover is rising from 4.2
to 6.8 cycles annually, thus making logistics down by
1.2 percent and saving $92 million (Tesla, 2020).
Besides, shared R&D facilities allowed cost on
R&D to be cut by 18% (Tesla, 2020). The
photovoltaic lab of Solar City is merged with R&D
centers of Tesla to share high-end facilities such as
spectral testers and climate simulation chambers.
Besides, the joint team focused on making Powerwall
compatible with vehicle energy management system
of Tesla, which helped reduce battery management
algorithm cycle. Furthermore, the joint team had
eliminated 200 redundant roles, cutting down $210
million annually.
According to Tesla’s investor presentations, long
term cost savings could be up to $250 million given
supply chains and operational process integration
(SolarCity, 2017).
Table 1: Cost Synergy
Cost
Categor
y
2016 (Pre-
Merger)
2020 (Post-
Merger)
Savings
(%)
Hardware
Procurement
$800
million
$650 million 18.75%
R&D
Ex
p
enses
$450
million
$369 million 18.00%
Logistics $120
million
$92 million 23.33%
Data source: Tesla SEC filings 2016–2020 (Tesla,
2020).
2.2 Sales Synergy
Through leveraging Solar City’s energy solutions,
Tesla has implemented bundle sales strategies within
its own electric vehicle ecosystem. For instance,
integrated packages like Powerwall has been
introduced in the market, combining electric vehicles
with solar panels as well as energy storage system.
Those sales strategy enabled Tesla to improve
Research on Vertical Synergy and Financial Contributions: A Case Study on Tesla and Solar City
131
customer engagement, to increase consumer value
and to increase revenue streams, all adding to
increased competitiveness of Tesla in renewable
energy market. Additionally, sales synergy also
allowed Tesla to better acquire customers and
maintain quality relations.
Statistically speaking, there was a 20% drop in
consumer acquisition costs given the integration of
sales and marketing channels (Tesla, 2023). Actually,
the customer base of SolarCity provided Tesla with
150,000 pre-qualified leads in terms of electric
vehicle purchases whereas Tesla’s showroom
network enhanced solar panel installations of
SolarCity by 25% (SolarCity, 2017).
2.3 Increasing Market Share and
Economies of Scale
As Table 2 shows, the transaction overall has
enhanced and consolidated the position of Tesla in
both automotive sector and renewable energy sector.
As compared to competitors such as General Motors,
Tesla’s advantage in cost effectiveness as well as
quality products and services is enhanced. Besides
that, combined brand strengths allowed Tesla to
better expand into international market with better
global presence and market share. Statistically
speaking, Tesla’s EV market share has rose from 12%
to 18% in 2020 whereas its solar installation has
boosted from 3% to 8% (Electrek, 2020).
Table 2: Market Share of EVs in 2020
Pl. Brands Sept sales Year - to - Date sales Market share
1 Tesla 65,814 316,820 18%
2 Volkswagen 24,035 113,091 6%
3 BYD 18,631 104,176 6%
4 BMW 15,525 101,270 6%
5 Renault 13,300 68,928 4%
6 Mercedes - Benz 17,836 68,855 4%
7 Volvo 11,838 67,561 4%
8 Audi 12,385 67,304 4%
9 H
y
undai 11,510 63,679 4%
10 Kia 10,937 59,840 3%
Data Source: Electre
k
(2020)
According to figure 1 and 2, concerning
economies of scale, the production and distribution
processes of both Tesla and Solar City have been
integrated to lower unit costs. For instance, 3 times
the increase in production efficiency in areas such as
battery production has been reported in internal
reports of Tesla. Statistically, the battery cost was
reduced from $1,100 in 2016 to $137 in 2023 given
the sharing of gigafactory resources with SolarCity
(Tesla, 2023).
EMITI 2025 - International Conference on Engineering Management, Information Technology and Intelligence
132
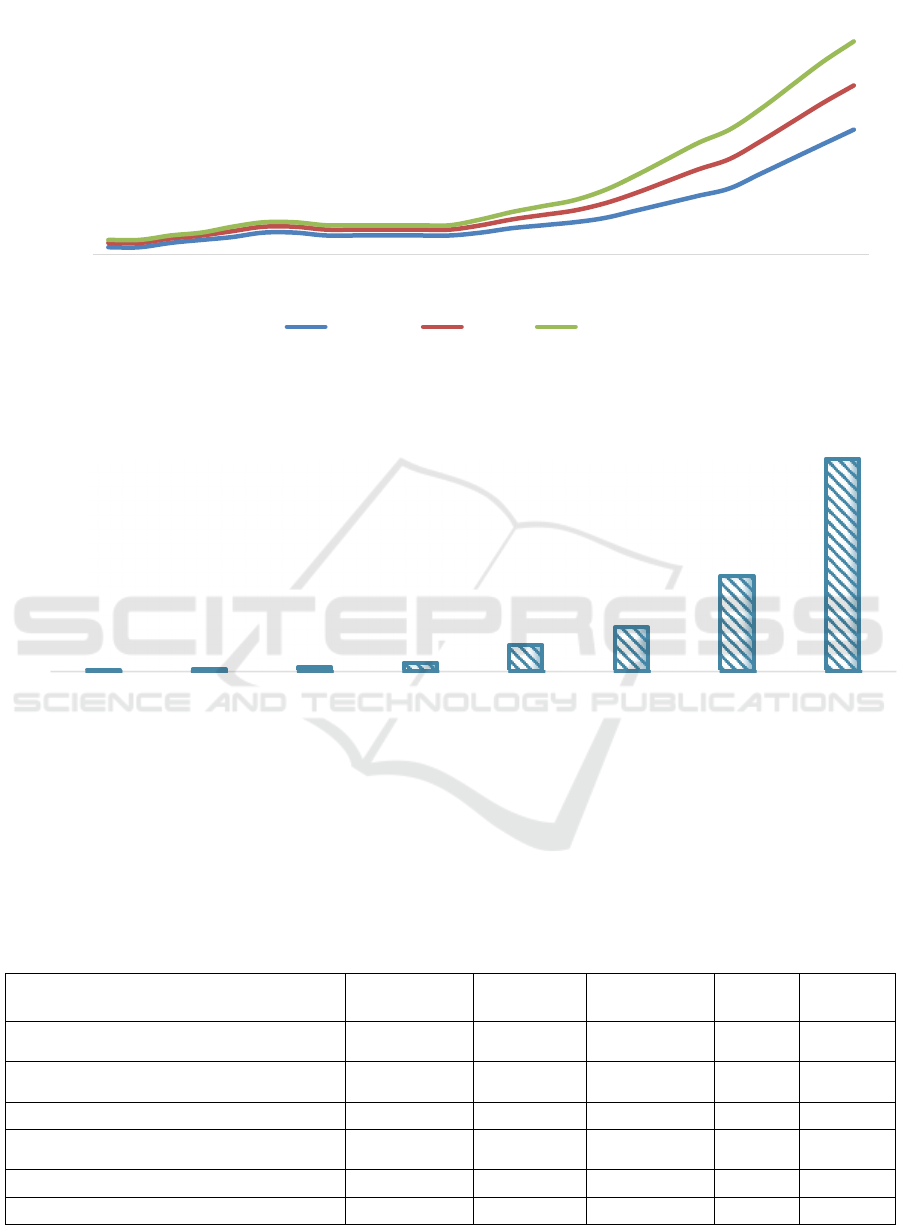
Data Source: Electrek (2020)
Figure 1: Market Share of Tesla Vehicles by Region.
Data Source: Tesla Earnings Report 2023
Figure 2: Energy Storage Deployments.
2.4 Positive Financial Results
As table 3 shows, total operating expenses increased
quarter on quarter under both Non-GAAP and GAAP
approach. Under it, R&D and SG&A increased to
varying degree, indicating Tesla’s expanding of
business or investment during the period (Tesla,
2016). This allowed Tesla to expand investment in
R&D, which is helpful for new technologies
development and application, fostering market
competitiveness and promoting revenue growth.
Table 3: Operating Expenses and Net Results
Dec 31, 2016
($000)
Sep 30, 2016
($000)
Dec 31, 2015
($000)
Change
QoQ
Change
YoY
Total operating expenses - GAAP $ 701,976 $ 551,113 $ 478,897 27% 47%
Total operating expenses - Non-GAAP $ 607,020 $ 470,509 $ 429,287 29% 41%
R&D ex
p
enses - GAAP $ 245,960 $ 214,302 $ 190,243 15% 29%
R&D expenses - Non-GAAP $ 204,656 $ 174,082 $ 164,791 18% 24%
SG&A ex
p
enses - GAAP $ 456,016 $ 336,811 $ 288,654 35% 58%
SG&A expenses - Non-GAAP $ 402,364 $ 296,427 $ 264,496 36% 52%
Data source:
Tesla Q4 Earnin
g
s Report (2016).
0.00%
0.20%
0.40%
0.60%
0.80%
1.00%
1.20%
1.40%
1.60%
Q4
2017
Q1
2018
Q2
2018
Q3
2018
Q4
2018
Q1
2019
Q2
2019
Q3
2019
Q4
2019
Q1
2020
Q2
2020
Q3
2020
Q4
2020
Q1
2021
Q2
2021
Q3
2021
Q4
2021
Q1
2022
Q2
2022
Q3
2022
Q4
2022
Q1
2023
Q2
2023
Q3
2023
Q4
2023
US/Canada Europe China
0.1
0.15
0.3
0.6
1.8
3
6.5
14.5
2015 2016 2017 2018 2019 2020 2021 2022
Research on Vertical Synergy and Financial Contributions: A Case Study on Tesla and Solar City
133
According to table 4, before the vertical
integration, SolarCity has a debt of around $1.5
billion whereas Tesla had around $2 billion in debt.
Positively, cash and cash equivalents increased 183%
year on year on December 2016, suggesting a surge
in funds reserve (Tesla, 2016). On top of that, Tesla
reported positive record with a GAAP profit of $22
million and a cash flow of $176 million post the
synergy (Tesla, 2016). Besides that, revenue of
renewable energy climbed from 3% in 2016 to 15%
in 2020, moving from EV market to comprehensive
solution provider and thus supporting its long-term
financial growth.
Despite that, cash flow registered negative as
compared to last quarter, indicating Tesla’s trouble of
recovering funds short term. Consequently, the
negative cash flow indicates Tesla’s problems with
long term financial sustainability.
Table 4: Cash Flow and Liquidity
Dec 31, 2016
($000)
Sep 30, 2016
($000)
Dec 31,
2015 ($000)
Change -
QoQ
Change -
YoY
Cash and cash equivalents $ 3,393,216 $ 3,084,257 $ 1,196,908 10% 183%
Cash flows provided (used in)
operating activities
($ 448,209) $ 423,650 ($ 29,849) -206% -1402%
Change in collateralized lease
b
orrowin
g
$ 212,040 $ 173,144 $ 208,793 22% 2%
Operating cash flows plus
change in collateralized lease
b
orrowin
g
($ 236,169) $ 596,794 $ 178,944 -140% -232%
Source: Tesla Q4 Earnings Report 2023
3 UNFAVOURABLE FINANCIAL
RESULTS
3.1 Cultural Conflict
Tesla's corporate culture is driven by innovation and
rapid problem-solving whereas Solar City
emphasizes on engineering culture and process
management. These cultural clashes weakened the
realization of synergies in the early stages of the
merger. In terms of decision making, Tesla’s quick
decision approach is in conflict with more cautious
approach in SolarCity, with the latter considered as
too bureaucratic. Furthermore, concerning internal
communication, Elon Musk’s hands-on and high-
intensity approach has created tension in hierarchical
and process-oriented management of Solar City.
Besides the above, zero-tolerance policy of Tesla and
somehow chaotic and flat organizational structure
had resulted in uncertainty and lack of clarity, which
further contributed to loss of some key talents. For
example, the exit of CFO, Treasurer and Head of
Engineering has delayed the integration process by 6
months.
Table 4 SolarCity Key Talents Turnover
Position Tenure at SolarCity Departure Timeline Reason Cited
CFO, Deepak Ahuja 5 years 2017 Q1 Cultural Misalignment
Head of Engineering 8 years 2017 Q2 Decision-Making Clash
Senior Data Scientist 3 years 2017 Q3 Organizational Chaos
Data source: LinkedIn alumni reports and media interviews)
EMITI 2025 - International Conference on Engineering Management, Information Technology and Intelligence
134
3.2 Financial Dangers
As table 5 shows, Tesla acquired SolarCity for $2.6
billion to achieve vertical integration in order to
finish the purchase,. Till December 31, 2023, its debt
increased from $5.5 billion to $13.62 billion (Tesla,
2023). In other words, acquiring SolarCity has
amplified its financial risks.
Concerning long-term solvency, the long-term
debt of Tesla took up 78% of total liabilities, thus
adding to high solvency pressures (Tesla, 2023). As a
high portion of future cash flows may be earmarked
for debt servicing, critical business activities such as
R&D investment and market expansion may be
hindered. The surge in debt affects financial stability
of Tesla, implying greater financial leverage and
volatility of earnings, which could even push the
company into financial distress if sales declines or
cost increases.
Financing of Tesla was also affected post
integration. For Tesla, its interest rate on long-term
debt was 5.10% in 2024, nearly 1.5 time of industry
distress average while the interest expenses was high
as $149.6 million in Q1 2024. High interest rate or
decline in EBIT (earnings before interest and taxes)
could pose risks to financial health (SN&P, 2024).
Credit rating for Tesla was also lowered post the
acquisition, making it even costlier for Tesla to raise
new funds and adding to financial pressure.
Table 5 Liabilities and Equity
Current liabilities 15,255 15,904 15,273 13,937 14,431
Accounts payable and othe
r
8,205 8,378 8,684 8,530 9,080
Accrued liabilities 4,048 4,276 3,904 3,347 3,273
Current portion of debt and finance leases (I) 1,502 1,404 1,459 1,967 2,375
Total current liabilities 26,709 27,436 27,592 26,640 28,748
Debt and finance leases, net of current
p
ortion
(
I
)
1,597 1,272 872 4,226 2,857
Deferred revenue, net of current portion 2,804 2,911 3,021 3,059 3,251
Other liabilities 5,330 5,998 6,409 5,831 6,690
Total liabilities 36,440 37,598 38,409 39,446 43,009
Redeemable noncontrollin
g
interests in subsidiaries 409 407 288 277 242
Total stockholders' e
q
uit
y
47,704 48,054 51,130 53,466 62,634
Noncontrollin
g
interests in subsidiaries 785 774 764 752 733
Total liabilities and equit
y
82,338 86,833 90,591 93,941 106,618
(I) Breakdown of our debt is as follows:
Vehicle and ener
gy
p
roduct financin
g
(
non-recourse
)
2,001 1,708 1,475 3,660 4,613
Recourse debt excluding vehicle and energy product
financing
44 44 44 44 44
Total debt excluding vehicle and energy product
financin
g
44 44 44 44 44
Source: Tesla Q4 Earnings Report 2023
Research on Vertical Synergy and Financial Contributions: A Case Study on Tesla and Solar City
135

3.3 Risk of Antitrust Regulation
During the acquisition process, Tesla faced a lawsuit
from its shareholders. In 2016, Tesla owned a large
portion of SolarCity whereas two of his relatives were
co-founders, making the shareholders believe that the
integration was intended to address financial
struggles of SolarCity. During the lawsuit,
shareholders claimed Musk exerted dominance over
the board and breached fiduciary duty. The lawsuit
lasted for years, with the financial ruling of the
Supreme Court in 2023. This lawsuit has received
extensive media coverage, damaging market
reputation and raising doubts and concerns among
investors and public. What’s worse, the legal fees
exceeded $50 million and Tesla’s stock volatility
surged from 1.2 in 2016 to 1.5 in 2023 given loss of
investor confidence (AP New, 2025).
4 CONCLUSION
This research aims to explore the outcomes of vertical
merger through the case study of Tesla and SolarCity.
More specifically, as previous literature indicates that
vertical mergers can add to cost benefits, market and
sales synergy, as well as economies of scale, this
research have explored the case from the above
angles. Examining the Tesla acquisition of SolarCity
reveals that large-scale vertical mergers can actually
have beneficial consequences in terms of cost
optimization, revenue growth, and market expansion.
Thus, it is implicated that business can use vertical
integration as a way to reduce costs, enhance
competitiveness and realize sustainable growth.
On the other hand, this study has also examined
the possible challenges and risks to yield a more
balanced and fairer conclusion. In this case, cultural
clashes, financial strain, and regulatory scrutiny have
created challenges in both the financial, legal and
operational front. This it is implicated that ssuccessful
mergers and acquisitions not only need correct
evaluation of possible advantages but also demand
complete anticipation and response plans for possible
problems that can occur throughout the integration
process. Overall, businesses should aim for a sensible
balance between synergies and possible hazards
while developing merger and acquisition plans and
look for a sensible balance to produce lasting value.
This paper is limited as it focuses more on
financial and immediate operational aspects, whereas
long term effect of a merger on technological
development and product innovation is not fully
explored. Besides, other factors affecting the post-
acquisition performance of Tesla is not fully explored,
covering external factors such as governmental
policies and industry changes. Given the limitations
of the research, it is suggested that an indepth analysis
on Tesla’s innovation roadmap could be carried out.
Besides that, it is also relevant to take the variables of
external factors such as government policy in the
renewable energy field and automobile field, broad
economic contexts as well as industry dynamics into
consideration, to conclude if those factors can
promote or hinder post-acqusition performance of
Tesla.
REFERENCES
AP News. (2025, February 28). Delaware Supreme Court
upholds judge’s finding that Tesla acquisition of Solar
City was fair. https://apnews.com/article/tesla-elon-
musk-solar-city-shareholder-lawsuit-
362775d28666c40e66ca09117c31f93c
Cao, Z. (2024). Analysis of the risks and performance of
dairy company mergers and acquisitions. Dairy and
Human, (1), 53–58.
Carlton, D. W., Israel, M. A., MacSwain, I., & Orlov, E.
(2019). Are legacy airline mergers pro- or anti-
competitive? Evidence from recent U.S. airline mergers.
International Journal of Industrial Organization, *62*,
58–95.
De Stefano, M., & Salinger, M. A. (2024). The complicated
simple economics of vertical mergers. Working paper.
Lambert, F. (2020, October 30). Tesla increases lead as
world’s best-selling electric vehicle maker. Electrek.
https://electrek.co/2020/10/30/tesla-tsla-market-share-
global-ev-sales-change/
Eule-Rich, M., Kopp, R., & Flügge, B. (2022). Mergers and
acquisitions research—A bibliometric analysis.
European Management Journal, *40*(6), 832–846.
Glass, V., & Gori, S. (2020). Approaches to assessing
vertical mergers: A review and evaluation. In P. L.
Parcu, T. J. Brennan, & V. Glass (Eds.), The changing
postal environment (pp. 381–402). Springer.
Lafontaine, F., & Slade, M. (2007). Vertical integration and
firm boundaries: The evidence. Journal of Economic
Literature, *45*(3), 629–685.
Rohra, N., & Anita. (2023). Impact of mergers &
acquisitions—A critical review of literature. Academy
of Entrepreneurship Journal, *29*(3S), 1–14.
S&P Global Ratings. (2024). Industry credit outlook 2024:
Autos.
https://www.spglobal.com/ratings/en/research/pdf-
articles/240109-industry-credit-outlook-2024-autos-
101591897
SolarCity. (2017). Customer acquisition report.
http://www.solarcity.com/
Song, F., & Bin, Z. (2016). Market synergies in mergers and
acquisitions: Evidence from the Chinese
EMITI 2025 - International Conference on Engineering Management, Information Technology and Intelligence
136

pharmaceutical industry. Journal of Business Research,
*69*(10), 4485–4493.
Tesla. (2016). Tesla fourth quarter & full year 2016 update
[Earnings report]. https://www.teslarati.com/wp-
content/uploads/2017/02/TSLA_Update_Letter_2016-
4Q.pdf
Tesla. (2018). Tesla fourth quarter & full year 2018 update
[Earnings report]. https://cdn.arstechnica.net/wp-
content/uploads/2019/01/Tesla-2018-Q4-Update-
Letter1.pdf
Tesla. (2023). Tesla fourth quarter & full year 2023 update
[Earnings report]. https://digitalassets.tesla.com/tesla-
contents/image/upload/IR/TSLA-Q4-2023-Update.pdf
Tesla. (2023). 2023 annual shareholder meeting [Video].
YouTube.
https://www.youtube.com/watch?v=bZNL_8bUz6A
Tesla, Inc. (2016–2020). *Form 10-K annual reports*. U.S.
Securities and Exchange Commission.
https://www.sec.gov/Archives/edgar/data/1318605/00
0156459021004599/tsla-10k_20201231.htm
Research on Vertical Synergy and Financial Contributions: A Case Study on Tesla and Solar City
137
