
Uncovering Student Engagement and Performance in Applied AI in
Finance: A Learning Analytics Approach
Neslihan Ademi
a
, Aleksandra Porjazoska Kujundziski
b
and Damir Rahmani
c
Faculty of Engineering, International Balkan University, Skopje, North Macedonia
Keywords: Learning Analytics, Educational Data Mining, AI Education, Engagement, Log Analysis.
Abstract: The product of the Erasmus+ project, Transversal Skills in Applied Artificial Intelligence (TSAAI), is the
educational framework FuturIA, which offers a massive open online course focusing on the development of
highly demanded transversal skills. The platform utilizes a unique pedagogical approach centered on solution-
practice triplets and personalized learning pathways, aiming to adapt to individual student needs and foster
effective skill acquisition. The TSAAI expert course was piloted by 30 students from universities participating
in the project, enabling the consortium to refine the curriculum and teaching methodologies before the official
launch of FuturIA. This study focuses on assessing the learning analytics of students, including descriptive
analysis of log data, correlations between grades and course activities, clustering and a gender-based
comparison of students’ success and engagement.
1 INTRODUCTION
The increased utilization of AI technologies has led
to a substantial increase in demand for professionals
proficient in AI, which the current formal educational
system is unable to meet, creating a gap between the
profile of employees available on the labor market
and the industry's escalating needs (Kujundziski et
al., 2024). Hence, to navigate the evolving landscape
of AI-driven job transformation, upskilling and/or
reskilling initiatives are crucial to equip individuals
with the requisite competencies (Wang et al., 2024).
To work effectively alongside AI systems,
individuals must be equipped with a range of
technical, soft, and hybrid skills (Du, 2024), which
emphasize the importance of adapting educational
and training programs and promote a culture of
continuous learning and professional development.
Alongside knowledge specific to the profession,
education systems must prioritize the cultivation of
transversal skills, reflecting the need for the
development of critical thinking, problem-solving,
and digital skills among students (Rudolph et al.,
2024), as well as adaptability, communication, and
interpersonal skills (Kujundziski et al., 2024).
a
https://orcid.org/0000-0002-9510-8182
b
https://orcid.org/0000-0001-8177-3328
c
https://orcid.org/0009-0007-0596-7762
The digital evolution necessitates modifications to
formal higher education curricula. Due to the rapid
pace of technological advancements, the
transformation of study programs faces challenges,
emphasising the need for collaboration between
businesses and educators to ensure that academic
programs align with the demands of the labour market
(Bobițan et al., 2024).
Aiming to diminish the discrepancy between
basic AI knowledge and the growing demand for
experts in AI applications across various fields, the
consortium of the Erasmus+ project Transversal
Skills in Applied Artificial Intelligence (TSAAI)
developed an educational platform called FuturIA,
integrated into the learning management system
(LMS) Moodle. For this purpose, the online course
was developed, consisting of nine modules that cover
AI methods, tools, methodologies, and the
application of AI in various areas, including science,
finance, industry, Information and Communication
Technologies (ICT), and humanities. The online
TSAAI expert course includes written and audio-
visual educational resources covering advancements
in applied artificial intelligence, created to provide
Ademi, N., Porjazoska Kujundziski, A. and Rahmani, D.
Uncovering Student Engagement and Performance in Applied AI in Finance: A Learning Analytics Approach.
DOI: 10.5220/0014309800004848
Paper published under CC license (CC BY-NC-ND 4.0)
In Proceedings of the 2nd International Conference on Advances in Electrical, Electronics, Energy, and Computer Sciences (ICEEECS 2025), pages 249-256
ISBN: 978-989-758-783-2
Proceedings Copyright © 2026 by SCITEPRESS – Science and Technology Publications, Lda.
249

attendees with highly demanded transversal skills
(Kujundziski et al., 2024).
FuturIA distinguishes itself through its unique
pedagogical approach, which is rooted in the creation
of solution-practice triplets including presenting a
problem that resonates with students' experiences,
offering an intuitive and logical methodology for
addressing the problem, and providing a practical,
step-by-step guide to implement the proposed
solution, carefully designed to facilitate effective
learning and skills' acquisition (Kujundziski et al.,
2024). This hands-on approach to learning is
complemented by a strong emphasis on transversal
skills, equipping learners with the competencies
necessary to succeed in multidisciplinary
environments and adapt to the evolving demands of
the AI-driven landscape (Kujundziski et al., 2024).
Providing customized educational pathways that
consider individual learning preferences, the FuturIA
platform encourages personalized learning, adapting
to students' learning paces and knowledge levels
(Demartini et al., 2024), i.e., following students'
learning analytics. By collecting, analyzing, and
reporting data about learners and their learning
environments, such as student interactions with
online learning platforms, assessment results, and
demographic information, one can identify learning
patterns and trends to understand and improve
learning experiences.
Before its official launch, the pilot TSAAI expert
course was tested by 30 students with diverse
educational backgrounds from higher education
institutions participating in the TSAAI project over a
four-month period, from September to December
2024. Piloting the online course, and thus, the
FuturIA educational platform, is necessary for testing
and adapting the system before its full launch for
massive use. This involves making adjustments to the
curriculum, training materials or teaching methods,
which are important for the sustainability of this
learning framework.
Learning analytics is a useful tool for assessing
the taeching and learning process and course
effectiveness (Wong et al., 2025). Log analysis give
opportunities to get insights from the user
engagement in online education settings (Ademi &
Loshkovska, 2019b). Especially AI driven learning
analytics is a potential for the personalized feedback
in learning systems (Vashishth et al., 2024)
Thus, this study aims to assess the learning
analytics of students who have experienced the
TSAAI online course, including descriptive analysis
of log data, such as quiz submissions, lessons viewed,
and time spent on each activity. Additionally, it
examines the correlations between grades and course
activities, as well as a comparison of success based
on gender. It also uses clustering to classify the
students.
2 METHODOOLOGY
This study employed a combination of data mining,
statistical analysis, and correlation analysis to explore
patterns of learner engagement and performance in
the pilot online course Applied AI in Finance. The
methodological process included participant
identification, data collection and preprocessing, data
transformation, and the application of analytical
techniques to quantify learner behaviors.
2.1 Participants
The participants of this study were students from six
different countries, all of whom were enrolled in the
pilot implementation of the Applied AI in Finance
course. These students came from various higher
education institutions involved in the TSAAI
(Transforming Skills in Applied Artificial
Intelligence) project. The cohort represented a diverse
mix of educational and cultural backgrounds,
providing a rich context for analyzing engagement
and learning behaviors in an international, digitally
mediated environment.
2.2 Data Collection and Processing
Data was collected from the FuturIA platform, which
uses Moodle as its learning management system. The
primary source of data was Moodle log files
downloaded in .csv format. These log files captured
granular details of learner interactions with the
course, including events such as page views, quiz
attempts, resource accesses, and system-generated
updates. Each record contained the following fields:
Time, User full name, Affected user, Event context,
Component, Event name, Description, Origin, and IP
address.
To complement the behavioral data, course grade
files were also exported from the platform. These
included key performance indicators such as quiz
results and overall course grades. The grade data was
then merged with the log data based on user
identifiers to support integrated analysis of
engagement and performance.
Before processing the data is anonymized to keep
the privacy of the learners. For this purpose, each
learner is assigned a user ID.
ICEEECS 2025 - International Conference on Advances in Electrical, Electronics, Energy, and Computer Sciences
250

2.3 Data Cleaning
To ensure the analysis focused strictly on student
activity, data preprocessing steps were applied to
filter out logs generated by instructors, system
administrators, and automated background processes.
Duplicate or irrelevant entries were removed and
missing or malformed data were identified and
handled appropriately. Special attention was paid to
encoding and formatting issues to enable consistent
processing across data sources.
2.4 Data Transformation and
Integration
Log records were transformed into aggregated
activity counts per user, capturing the frequency of
key learning actions (e.g., viewing a course module,
submitting a quiz). These behavioral indicators were
standardized and combined with the grade data to
form a unified dataset. This integration enabled a
multi-dimensional analysis that connected learner
behavior with academic outcomes.
2.5 Data Exploration and Analysis
To quantify learner interaction, we introduced a
composite metric called the Engagement Score. This
score was calculated by summing the counts of six
key activity-based events for each user (Table 1).
Table 1: Event types extracted from the logs.
Event Name Description
Course activity
completion updated
Tracks marking of course
items as complete
Course module
viewed
Indicates views of individual
learning modules
Course viewed Counts course landing page
accesses
Quiz attempt
submitted
Shows actual attempts at
submitting quizzes
Quiz attempt started Captures initiation of quiz
activities
Quiz attempt viewed Shows how often users
accessed quiz details
This metric served as a proxy for student
engagement within the platform. Using this measure,
participants were segmented into Low, Medium, and
High engagement levels via quantile-based
classification. Descriptive statistics, histograms, and
correlation matrices were then used to explore the
relationship between engagement and performance
(e.g., quiz percentage and course total grades). These
analyses helped identify patterns and discrepancies
across different engagement tiers.
2.6 Clustering
Clustering analysis was conducted to identify distinct
groups of students based on their activity patterns and
academic performance in the Applied AI in Finance
course. By grouping students with similar behaviors,
such as quiz attempts, course views, and test scores,
this unsupervised learning approach aimed to uncover
hidden patterns in learner engagement.
3 RESULTS
3.1 Student Engagement
Engagement score provides a comprehensive
measure of user participation by integrating various
dimensions of engagement, including navigation
activities (such as page views), active involvement
(like starting or submitting assignments), and
progress tracking. By offering a blended perspective,
the score proves valuable for identifying differences
between highly engaged and passive learners (Ademi
& Loshkovska, 2020), understanding how
engagement correlates with academic performance
(e.g., final grades), and flagging students at risk due
to consistently low interaction levels. Table 2 shows
the summary of engagement levels of the students.
Table 2: Summary by engagement level.
Engagement
Level
Avg.
Engagement
Score
Avg. Quiz
%
Avg.
Course
Total
Low 9.73 95.31% 19.06
Mediu
m
27.62 79.17% 90.28
Hi
g
h 147.60 96.88% 1234.21
High-engagement students consistently
demonstrated significantly higher course totals and
quiz scores, highlighting the strong link between
sustained participation and academic success. In
contrast, students categorized as having medium
engagement showed moderate activity levels but
underperformed on assessments, suggesting they may
benefit from targeted academic support or
intervention strategies. Interestingly, some low
engagement users achieved unexpectedly high quiz
scores, which may indicate prior subject knowledge
or strategic, focused studying rather than ongoing
participation. This pattern emphasizes the need to
consider multiple dimensions of learning behavior
Uncovering Student Engagement and Performance in Applied AI in Finance: A Learning Analytics Approach
251
when interpreting engagement data (Wiedbusch et al.,
2023).
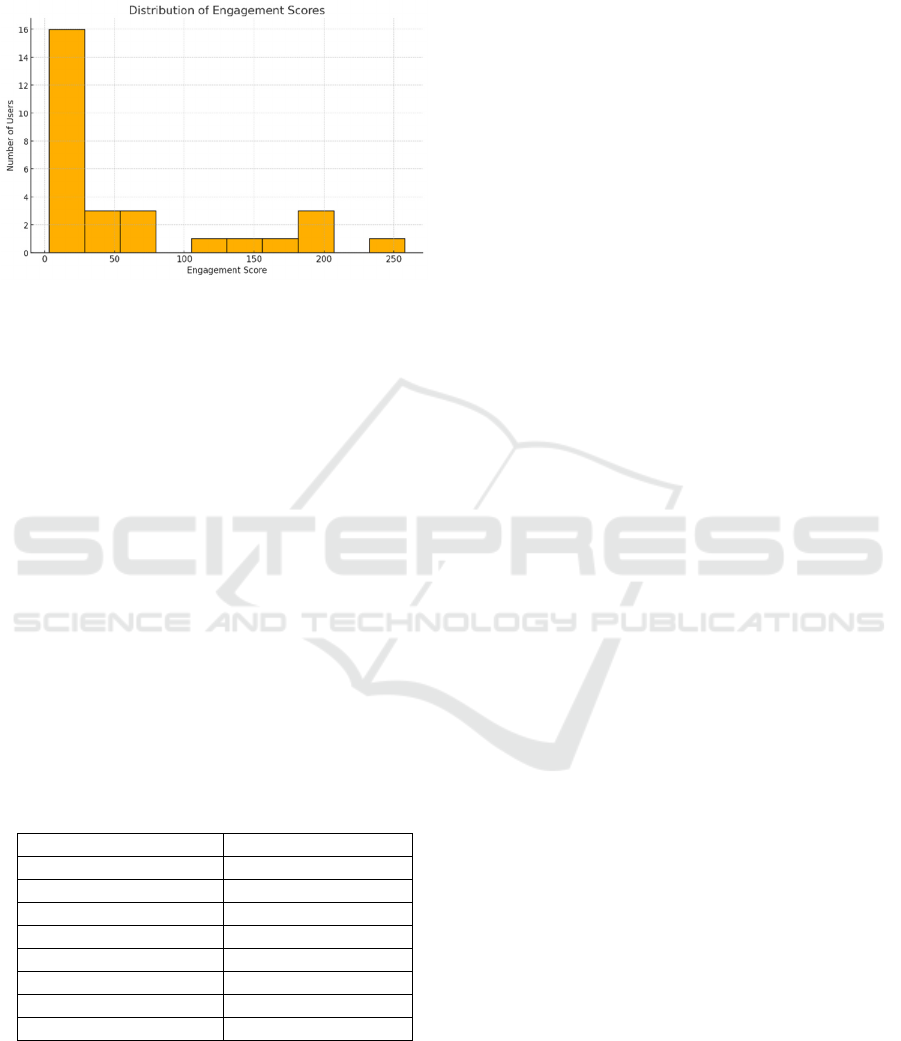
Figure 1 shows the distribution of engagement.
Figure 1: Distribution of Engagement Scores across users.
The distribution of engagement scores among
users reveals a right-skewed pattern, indicating that
while a few users are highly active, the majority show
relatively low levels of engagement. Most users have
engagement scores below 50, with the median at just
21, suggesting that half of the participants performed
fewer than 21 key interactions (such as viewing
modules or submitting quizzes). A small group of
users, however, demonstrated exceptionally high
engagement, with scores reaching up to 258,
significantly raising the average. This disparity
highlights a common pattern in digital learning
environments, where a core group of highly engaged
learners coexists with a larger group of minimally
active participants (Caspari-Sadeghi, 2022). Such
insights can be useful for identifying learners who
may need additional support or encouragement to
participate more actively. Table 3 showing the
summary statistics of engagement score also displays
positively skewed distribution.
Table 3: Summary statistics for the Engagement Score.
Statistic Value
Count 30 users
Mean 62.21
Std. Dev. 74.47
Min 3.00
25th Percentile (Q1) 13.00
Median (Q2) 21.00
75th Percentile (Q3) 69.00
Max 258.00
3.2 Gender Based Engagement
To explore potential differences in learning behavior
and performance, a gender-based analysis was
conducted using student interaction logs and grade
data from the Applied AI in Finance course. Gender
was inferred from students’ names to examine
patterns in course engagement, quiz participation, and
official test performance. While the primary goal was
to identify whether engagement or outcomes varied
meaningfully between male and female students, the
analysis was approached with caution due to the
limitations of name-based gender identification and
the relatively small sample size. Figure 2 shows the
average user activities by gender.
The statistical test compared activity levels
between male and female users using independent t-
tests. Among the various types of user engagement
analyzed, only the "Course viewed" activity showed
a statistically significant difference between genders
(p = 0.045), indicating that male users tend to view
the course more frequently than female users. For all
other measured activities—course activity
completion, module views, grade updates, and grade
report views—there were no statistically significant
differences observed (p > 0.05). This suggests that,
aside from course access frequency, engagement
patterns are generally similar across genders.
3.3 Course Success
The course contained 20 topics and a quiz for each
topic. In the end of the course there was an official
test.
The summary statistics of student quiz scores
across Topics 1 to 20 reveal a pattern of consistently
high achievement, with limited variability in most
topics. Specifically, quizzes from Topics 2, 4, and 5
demonstrate perfect performance across all students,
as indicated by their 100% mean scores and 0.00
standard deviation. This suggests that these quizzes
were either too easy or well-aligned with student
preparation.
In contrast, Topics 1 and 3 show slightly more
variation. For Topic 1, the mean score is 94.67 with a
standard deviation of 11.25, and scores ranging from
73.33 to 100. Topic 3 exhibits a similar pattern with a
mean of 96.19, standard deviation of 10.08, and
minimum score of 73.33. These topics may have
presented more challenging material or revealed
knowledge gaps among some students.
Although the summary includes placeholders for
quizzes up to Topic 20, current data is only available
for the first five. This limits broader trend analysis but
already highlights a strong performance pattern
among students, with most consistently scoring at or
near full marks. The lack of variation in many topics
could
also impact the ability to draw meaningful
ICEEECS 2025 - International Conference on Advances in Electrical, Electronics, Energy, and Computer Sciences
252
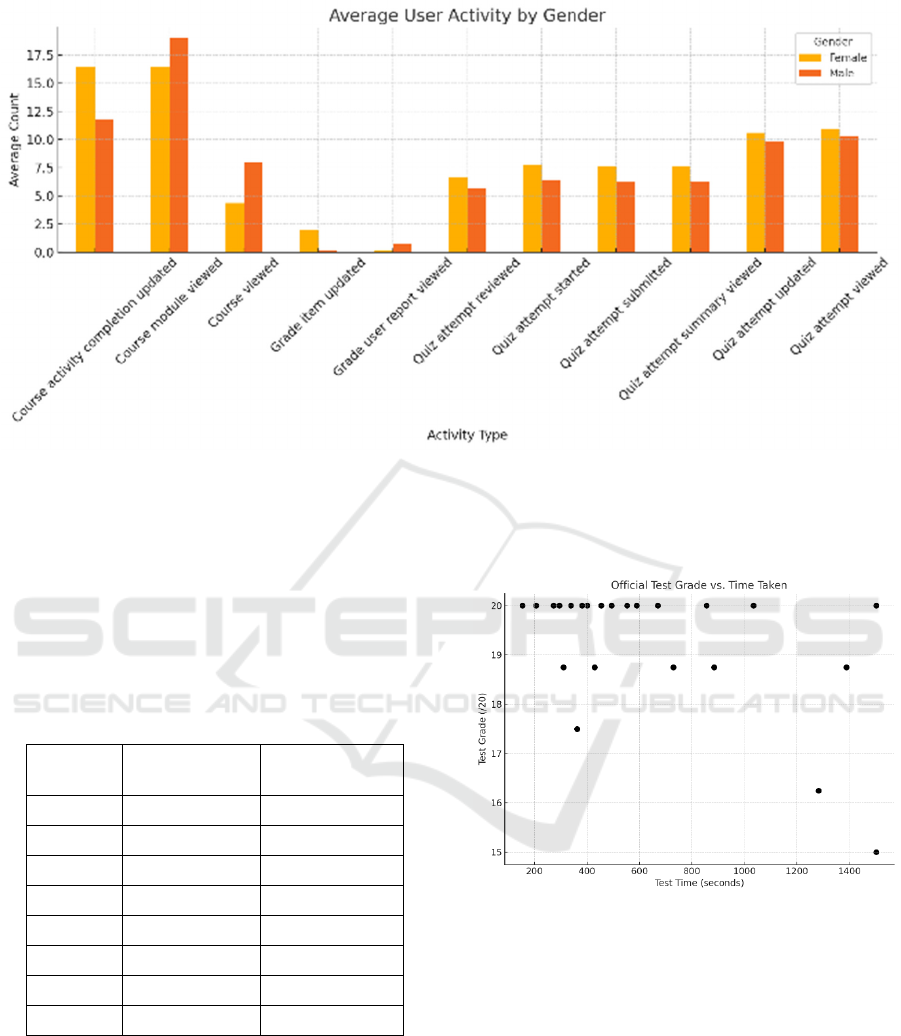
Figure 2 Average user activity by gender.
correlations with broader performance metrics like
the official test grade.
Table 4 shows the summary statistics of the
official test scores and the time taken to complete the
test. Figure 3 is the scatterplot showing the
relationship between Official Test Time (in seconds)
and Official Test Grade (out of 20).
Table 4: Summary statistics for the official test score and
time taken.
Official Test
Grade
Official Test
Time (secs)
count 29 23
mean 15.26 655.91
std 8.02 421.8
min 0 154
Q1 16.25 350.5
median 20 494
Q3 20 870
max 20 1502
The scatterplot illustrates a wide range of test
durations among students, with many achieving full
marks (20/20) regardless of how much time they
spent on the test. There is no clear linear relationship
between time taken and performance—some students
completed the test quickly and scored highly, while
others took longer with mixed outcomes. Notably, a
few students who spent a considerable amount of time
on the test ended up with lower scores, which may
suggest difficulties in understanding the material or
external distractions during the assessment.
Figure 3 Official Test Grade vs. Official Test Time
relationship.
3.4 Correlations
To better understand the relationships between
student engagement and academic performance, a
correlation analysis was conducted using key activity
metrics and grade data from the course. The analysis
focused on identifying how behaviors such as quiz
participation, course views, and test durations relate
to outcomes like quiz averages and official test
scores. By examining these correlations, the aim was
to uncover which types of engagement are most
strongly associated with academic success, providing
Uncovering Student Engagement and Performance in Applied AI in Finance: A Learning Analytics Approach
253
insights for enhancing future course design and
learner support.
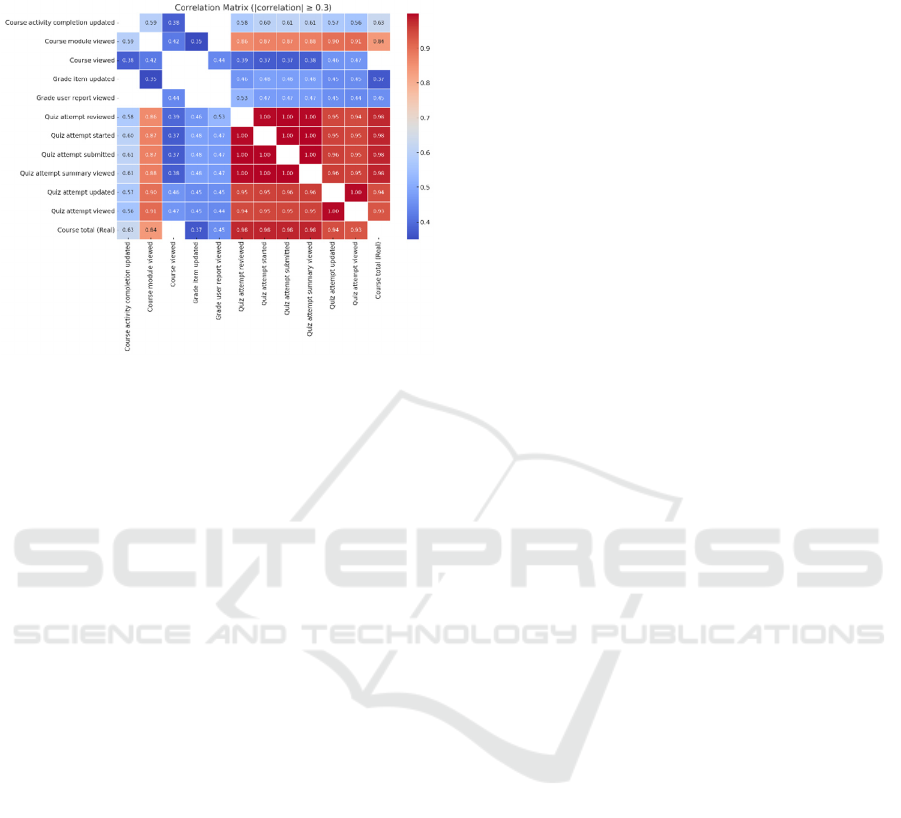
Figure 4: Correlation matrix activities vs grade.
The correlation matrix of significant features
(where the correlation coefficient is ≥ 0.3 or ≤ -0.3)
was visualized using a heatmap to reveal relationships
between key course engagement metrics and student
performance. A notable pattern emerged among quiz-
related activities—such as quizzes submitted,
reviewed, and viewed—which showed extremely
high intercorrelation (above 0.9). This indicates that
students who engage in one aspect of quiz activity
tend to participate actively in others as well.
Furthermore, these quiz metrics also demonstrated a
strong positive correlation with the final course grade
(Course total - Real), suggesting that consistent
engagement with quizzes plays a central role in
academic success. In addition to quiz activities,
metrics such as "Course module viewed" and "Course
activity completion updated" displayed moderate
correlations with both quiz engagement and final
grades, highlighting their contributory role in learning
outcomes. Lastly, although less pronounced, features
like "Grade item updated" and "Grade user report
viewed" also exhibited modest yet meaningful
correlations, reinforcing the importance of active
monitoring and feedback in the learning process.
3.5 Clustering
The clustering analysis revealed three distinct groups
of students based on their activity and performance
patterns. Cluster 0 consists of students with moderate
engagement: they viewed an average of 48.3 course
modules and started 23 quizzes, while only lightly
browsing the course itself (8.3 views). Despite this,
they achieved perfect scores across all topics and the
official test, suggesting they are efficient, high-
performing learners who engage selectively. Cluster
1 includes students who browse the course content
more frequently (22.0 views – the highest among
clusters) and started 29 quizzes on average, yet
achieved a slightly lower average official test grade
of 18.75. This indicates a group of curious but slightly
less consistent performers, possibly relying more on
passive review. Cluster 2 represents the most actively
engaged and highest-performing students, with the
highest averages in course module views (84.5) and
quiz attempts (31.0), while maintaining perfect scores
across the board. This group demonstrates strong,
consistent participation and academic success,
reflecting deep engagement with the course material.
4 CONCLUSIONS
The analysis of student activity logs, quiz
performances, and official test results from the
Applied AI in Finance course reveals several key
insights into learner engagement and achievement.
Overall, students demonstrated high levels of success
in quizzes, with average scores above 94% and many
achieving perfect scores, particularly in Topics 2, 4,
and 5. This consistency suggests strong content
understanding or possibly low quiz difficulty in some
topics.
However, the official test scores showed greater
variability, with an average of 15.26 out of 20,
indicating a broader range of mastery when assessed
more comprehensively. The correlation between quiz
scores and official test performance was weak, likely
due to limited score variation in the quizzes. Activity
metrics such as quiz attempts, course module views,
and total engagement showed stronger alignment
with test performance, especially among highly active
students.
Clustering analysis further revealed distinct
learner profiles — from highly engaged top
performers to moderate users achieving similar
grades. Gender-based analysis showed minimal
differences in activity and performance, with only a
slight statistical difference in course views.
In conclusion, while quiz performance was uniformly
strong, meaningful differentiation among learners
emerged only when considering broader engagement
metrics and the official assessment. These findings
underscore the importance of combining activity-
based data with performance outcomes to obtain a
clearer picture of student learning behavior and
success.
ICEEECS 2025 - International Conference on Advances in Electrical, Electronics, Energy, and Computer Sciences
254

As the course was a pilot study, number of
students and the amount of data is limited. The small
sample size and inconsistent quiz participation
reduced the statistical power of the findings and
limited their generalizability to broader student
populations.
This analysis can be performed in a systematic
way in the future trials of the FuturIA platform when
there will be higher number of students. In the future
analysis can be done dynamically before the end of
the course so that they would give an early picture of
the situation with the course and the students to take
preventive actions for the dropouts and low scores
(Ademi & Loshkovska, 2019a). These analyses could
be embedded in the form of dashboards so that the
instructors can see what is going on with the students
and this may help them to take decisions about the
ongoing teaching process. Learning Analytics
dashboards are also helpful for the learners as they
can see how they are performing within the group
(Paulsen & Lindsay, 2024). Furthermore, these
analytics can be used to provide adaptation and
personalize the learning (Ademi & Loshkovska,
2025).
ACKNOWLEDGEMENTS
The data used for the analysis in this paper is
extracted from the FuturIA platform, which is the
result of the project "Transversal Skills in Applied
Artificial Intelligence" (TSAAI), supported by the
Erasmus+ Programme for Strategic Partnership. The
learner data is anonymized and does not contain any
private information.
REFERENCES
Ademi, N., & Loshkovska, S. (2019a). Early Detection of
Drop Outs in E-Learning Systems. Academic
Perspective Procedia, 2(3), 1008–1015.
https://doi.org/10.33793/acperpro.02.03.112
Ademi, N., & Loshkovska, S. (2019b). Exploratory
Analysis of Student Activities and Success Based On
Moodle Log Data. 16th International Conference on
Informatics and Information Technologies.
Ademi, N., & Loshkovska, S. (2025). Data-Driven
Adaptive Course Framework—Case Study: Impact on
Success and Engagement. Multimodal Technologies
and Interaction 2025, Vol. 9, Page 74, 9(7), 74.
https://doi.org/10.3390/MTI9070074
Ademi, N., & Loshkovska, S. (2020). Clustering Learners
in a Learning Management System to Provide
Adaptivity. ICT Innovations Web Proceedings, 82–95.
https://proceedings.ictinnovations.org/attachment/pape
r/529/clustering-learners-in-a-learning-management-
system-to-provide-adaptivity.pdf
Bobitan, N., Dumitrescu, D., Popa, A. F., Sahlian, D. N., &
Turlea, I. C. (2024). Shaping Tomorrow: Anticipating
Skills Requirements Based on the Integration of
Artificial Intelligence in Business Organizations—A
Foresight Analysis Using the Scenario Method.
Electronics, 13(11), 2198.
https://doi.org/10.3390/electronics13112198
Caspari-Sadeghi, S. (2022). Applying Learning Analytics
in Online Environments: Measuring Learners’
Engagement Unobtrusively. Frontiers in Education, 7,
840947.
https://doi.org/10.3389/FEDUC.2022.840947/BIBTE
X
Demartini, C. G., Sciascia, L., Bosso, A., & Manuri, F.
(2024). Artificial Intelligence Bringing Improvements
to Adaptive Learning in Education: A Case Study.
Sustainability, 16(3), 1347.
https://doi.org/10.3390/su16031347
Du, J. (2024). AI and Your Job What’s Changing and
What’s Next. Frontiers in Science and Engineering,
4(7), 116-124. https://doi.org/10.54691/0dbksd82
Paulsen, L., & Lindsay, E. (2024). Learning analytics
dashboards are increasingly becoming about learning
and not just analytics - A systematic review. Education
and Information Technologies, 29(11), 14279–14308.
https://doi.org/10.1007/S10639-023-12401-
4/TABLES/8
Porjazoska Kujundziski, A., Domazet, E., Kamberaj, H.,
Rahmani, D., Feta, A. A., Valverde, F. L., Gálvez, S.,
Petlenkov, E., Vassiljeva, K., Štajduhar, I., Hagen, T.,
Gradišek, A., & Zidanšek, A. (2024). Transversal skills
in applied Artificial Intelligence - the case of the
financial sector. e-mentor, 2(104), 82-90.
https://doi.org/10.15219/em104.1658
Porjazoska Kujundziski, A., Kamberaj, H., Domazet, E.,
Feta, A., Rahmani, D., Ademi, N., Valverde F. L.,
Rojas, S. G., Pletenkov E., Vassiljeva, K., Štajduhar, I.,
Hagen, T., Gradišek, A., & Zidanšek, A. (2022).
Transversal skills in applied artificial intelligence –
curriculum development. In Proceedings of the 4
th
International Applied Sciences, Engineering, and
Mathematics Congress (ICASEM2022) (pp. 291–305).
https://www.researchgate.net/publication/380073696_
Proceedings_of_the_4th_International_Applied_Scien
ces_Engineering_and_Mathematics_Congress_ICASE
M2022
Rudolph, J., Ismail, M.F., & Popenici, S. (2024). Higher
Education’s Generative Artificial Intelligence Paradox:
The Meaning of Chatbot Mania. Journal of University
Teaching and Learning Practice, 21(6).
https://doi.org/10.53761/54fs5e77
Vashishth, T. K., Sharma, V., Sharma, K. K., Kumar, B.,
Panwar, R., & Chaudhary, S. (2024). AI-Driven
Learning Analytics for Personalized Feedback and
Assessment in Higher Education. 206–230.
https://doi.org/10.4018/979-8-3693-0639-0.CH009:
Uncovering Student Engagement and Performance in Applied AI in Finance: A Learning Analytics Approach
255

Wang, X., Chen, M., & Chen, N. (2024). How artificial
intelligence affects the labour force employment
structure from the perspective of industrial structure
optimisation. Heliyon, 10(5), e26686.
https://doi.org/10.1016/j.heliyon.2024.e26686
Wiedbusch, M., Dever, D., Li, S., Amon, M. J., Lajoie, S.,
& Azevedo, R. (2023). Measuring Multidimensional
Facets of SRL Engagement with Multimodal Data.
141–173. https://doi.org/10.1007/978-3-031-30992-
2_10
Wong, B. T. M., Li, K. C., & Liu, M. (2025). The Role of
Learning Analytics in Evaluating Course Effectiveness.
Sustainability 2025, Vol. 17, Page 559, 17(2), 559.
https://doi.org/10.3390/SU17020559
ICEEECS 2025 - International Conference on Advances in Electrical, Electronics, Energy, and Computer Sciences
256
