
TabM vs. Traditional ML for e-Commerce Product Ranking: A
Multi-Signal Framework for Frequently Bought Together
Recommendations
Dilge Karakas¸, Enis Teper and Okan Kaya
Hepsiburada, Istanbul, Turkey
Keywords:
e-Commerce, Purchase Frequency Prediction, Customer Behavior, Machine Learning.
Abstract:
We present a machine learning framework for ranking products in e-commerce recommendation systems,
specifically targeting “Frequently Bought Together” scenarios. Leveraging a TabM neural architecture with
parameter-efficient BatchEnsemble mechanisms for ensemble learning, our system integrates similarity scores,
position signals, and commercial performance metrics to optimize purchase probability predictions. Deployed
on a major e-commerce platform, our approach demonstrates improved ranking performance while main-
taining computational efficiency through strategic weight sharing across ensemble members. TabM model
achieves 23.5% improvement in HR@5 over position-based baseline and 14.5% improvement in NDCG@10
over logistic regression. The model effectively handles class imbalance through diverse ensemble perspectives
and significantly outperforms traditional machine learning approaches including gradient boosting and logistic
regression.
1 INTRODUCTION
In the competitive e-commerce landscape, product
ranking plays a pivotal role in ”Frequently Bought To-
gether” (FBT) contexts, especially in shaping user be-
havior and driving sales (Keskin et al., 2024b). FBT
recommendations traditionally rely on co-purchase
signals, but capturing these effectively while balanc-
ing relevance, business objectives, and computational
constraints remains a significant challenge for large-
scale platforms.
Recent BERT-like models treat purchase histories
as sequences, significantly improving recommenda-
tion accuracy and NDCG scores (Sun et al., 2019).
Studies on e-commerce ranking identify key chal-
lenges including heterogeneous data, class imbalance,
and balancing customer relevance with business goals
(Kabir et al., 2024). New recommendation systems
use logical reasoning to learn asymmetric product re-
lationships (e.g., batteries complement flashlights but
not vice versa), going beyond simple co-purchase pat-
terns (Wu et al., 2022). Analyses of commercial FBT
systems reveal built-in biases and strategic position-
ing effects that impact business outcomes.
Despite these advances, existing approaches often
suffer from: (1) limited scalability for real-time in-
ference, (2) lack of interpretability required for busi-
ness operations, or (3) insufficient integration of di-
verse signal types (similarity, commercial, and posi-
tional). There is a need for a practical framework that
balances predictive performance with operational re-
quirements.
We compare advanced neural architectures
(TabM with parameter-efficient BatchEnsemble
mechanisms) against traditional machine learning
approaches, ultimately demonstrating that deep
learning models like TabM (Gorishniy et al., 2024)
can achieve strong performance while meeting
production constraints.
This paper makes several contributions:
• A systematic comparison of neural (TabM) and
traditional ML approaches for FBT ranking,
with detailed analysis of performance-complexity
trade-offs
• A comprehensive feature selection analysis us-
ing Weight of Evidence binning and Information
Value
• A production deployment case study demonstrat-
ing real-world implementation challenges and so-
lutions in a large-scale e-commerce environment
Karaka¸s, D., Teper, E. and Kaya, O.
TabM vs. Traditional ML for e-Commerce Product Ranking: A Multi-Signal Framework for Frequently Bought Together Recommendations.
DOI: 10.5220/0014297100004848
Paper published under CC license (CC BY-NC-ND 4.0)
In Proceedings of the 2nd International Conference on Advances in Electrical, Electronics, Energy, and Computer Sciences (ICEEECS 2025), pages 243-248
ISBN: 978-989-758-783-2
Proceedings Copyright © 2026 by SCITEPRESS – Science and Technology Publications, Lda.
243
2 RELATED WORKS
Product ranking in e-commerce has evolved sig-
nificantly, transitioning from rule-based heuristics
and standalone retrieval systems to learning-to-rank
(LTR) models that integrate heterogeneous signals.
Early approaches, such as collaborative filtering and
content-based ranking, often decoupled retrieval and
ranking stages. Modern architectures now favor uni-
fied pipelines that jointly optimize both tasks to align
with user preferences and business objectives (Kabir
et al., 2024).
LTR models, especially those based on gradient
boosting, have gained prominence for their predic-
tive strength and flexibility in handling mixed fea-
ture types. XGBoost (Chen and Guestrin, 2016) and
LightGBM (Ke et al., 2017) are frequently employed
in large-scale ranking tasks due to their scalability and
regularization techniques. CatBoost (Prokhorenkova
et al., 2018), in particular, excels at handling categor-
ical variables without preprocessing, making it well-
suited for e-commerce data with diverse categorical
attributes. In parallel, ensemble methods like Ran-
dom Forests and Extra Trees (Geurts et al., 2006)
serve as strong baselines for both model interpretabil-
ity and feature importance estimation. HistGradient-
Boosting, available via scikit-learn, offers computa-
tional efficiency by combining histogram-based train-
ing with support for monotonic constraints and miss-
ing values.
Despite the advancements in tree-based models,
logistic regression continues to be widely used in
real-time production environments for its low infer-
ence latency, simplicity, and well-calibrated proba-
bilistic outputs. When paired with systematic fea-
ture selection techniques—such as sequential forward
selection and Weight of Evidence (WoE) (Raymaek-
ers et al., 2021) binning—logistic regression achieves
strong performance while maintaining interpretability
(Loukili et al., 2023).
Beyond product recommendation, similar ranking
strategies have been applied to other personalization
tasks. For instance, a recent study on homepage ban-
ner optimization demonstrates that click prediction-
based ranking using logistic regression leads to mea-
surable improvements in click-through and conver-
sion rates (Keskin et al., 2024a). This application fur-
ther supports the viability of interpretable models in
latency-sensitive production systems.
Finally, fairness and transparency concerns are
increasingly relevant in commercial ranking. Stud-
ies have revealed that certain platforms may intro-
duce systemic biases—such as favoring private-label
or sponsored items—through opaque ranking poli-
cies. These findings underscore the importance of
explainability and bias-aware evaluation in deployed
recommendation models.
3 DATA COLLECTION
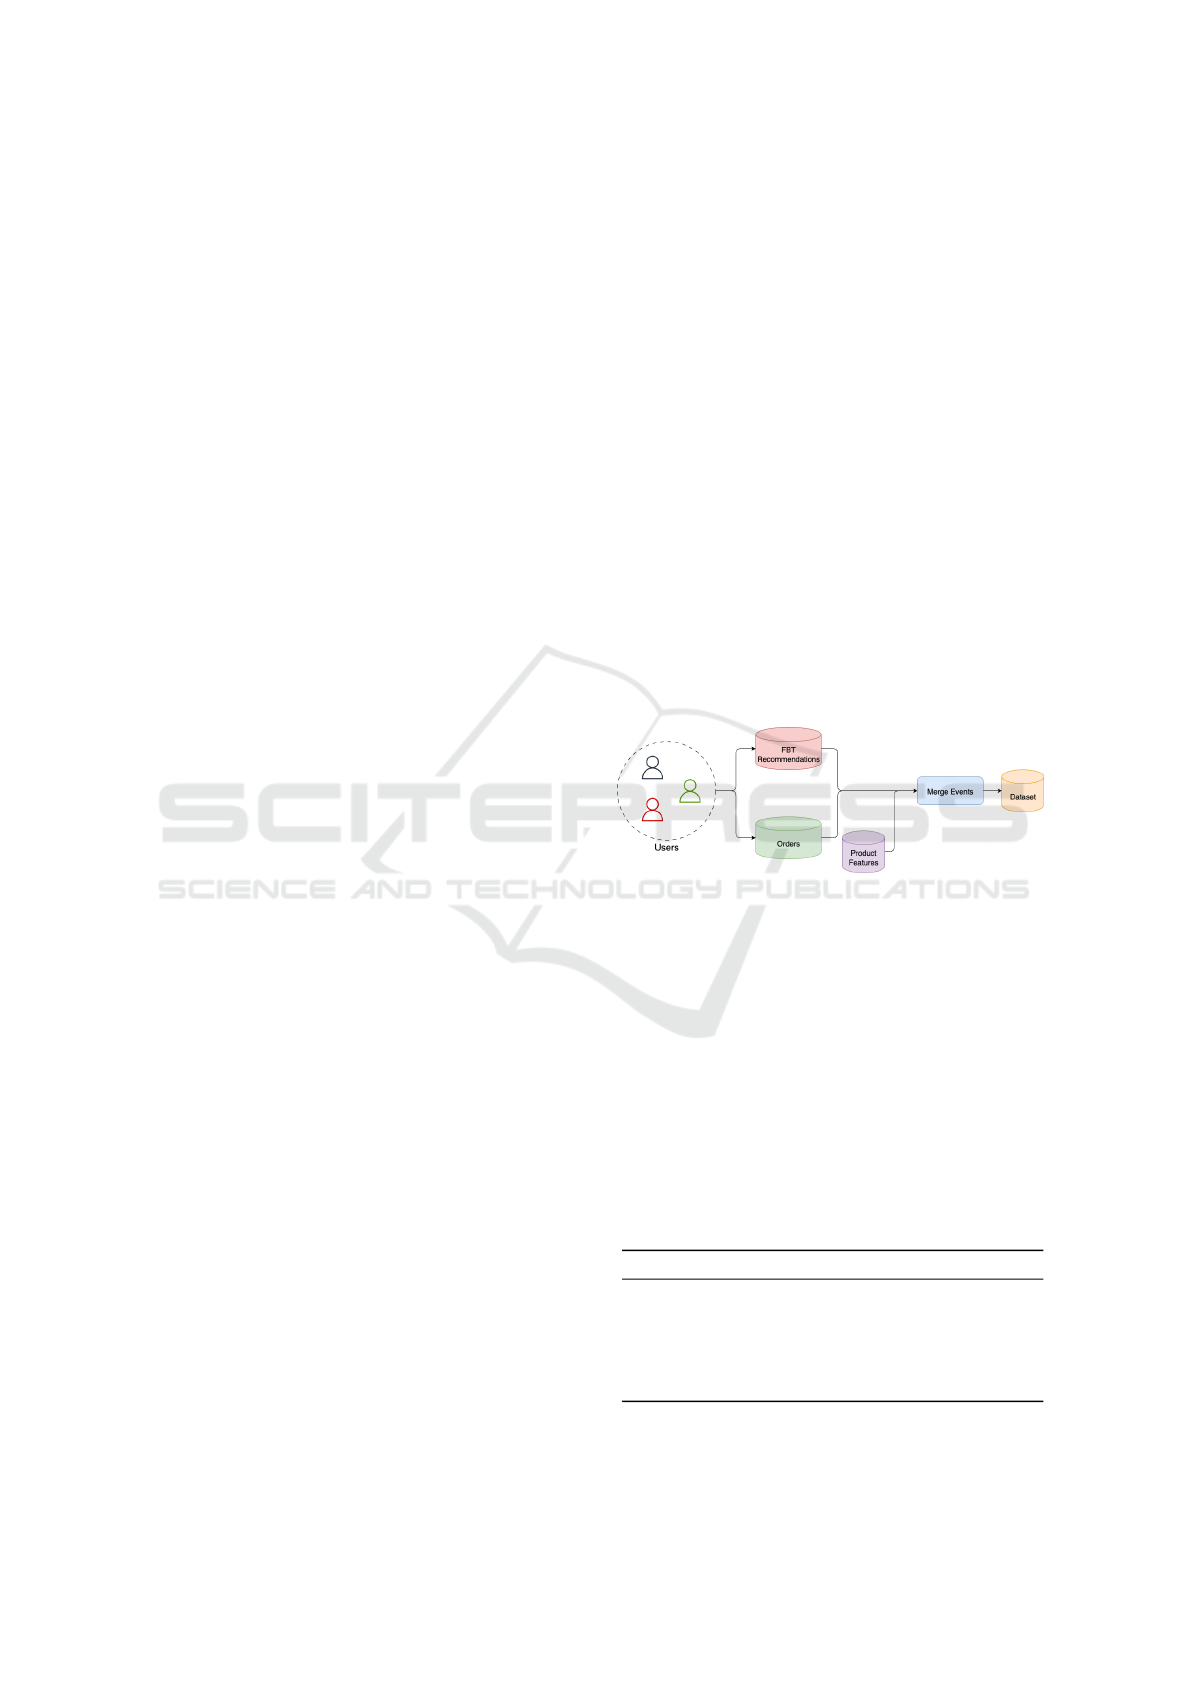
To support ”Frequently Bought Together” (FBT) rec-
ommendations, we construct a training dataset by in-
tegrating user interaction history, candidate recom-
mendations, and product metadata. As illustrated in
Figure 1, users generate both recommendation ex-
posures and order events, which are then merged
with product-level features to form labeled product
pairs. Candidate products are first retrieved using
embedding-based similarity, ranked by (1−distance).
Positive labels are assigned when the candidate was
co-purchased with the main product in the same order,
while negatives are drawn from unpurchased but rec-
ommended items. Data is split chronologically into
70% training, 15% validation, and 15% test to simu-
late real-world deployment.
Figure 1: Overview of the data collection and merging
pipeline.
The dataset integrates features from multiple
sources, including product catalog (category hierar-
chy, brand, merchant, reviews), pricing (listing prices,
view events, and historical orders), and user engage-
ment metrics (views, clicks, sales across six plat-
form touchpoints). Performance signals such as click-
through rate (CTR), conversion rate (CR), and per-
centile rankings are also incorporated.
Table 1 summarizes the groups. Prices follow a hi-
erarchical imputation strategy listing → view → order
→ default and are log-transformed to reduce skew.
Table 1: Overview of feature groups used in the ranking
model.
Feature Group # Features Source
Similarity & Position 2 Embedding, rank
Categorical Matching 5 Category, brand
Engagement Metrics 12 Views, clicks
Performance Ratios 6 CTR, CR
Commercial Signals 8 Price, reviews
Derived Features 4 Composites
ICEEECS 2025 - International Conference on Advances in Electrical, Electronics, Energy, and Computer Sciences
244
The binary target variable indicates whether the
candidate product was purchased after the user
viewed the main product. Temporal constraints en-
sure that purchases are linked to recent exposures to
prevent spurious attribution. This binary setup aligns
with the goal of maximizing conversion probability
and supports interpretable model evaluation.
Feature selection is performed using Information
Value (IV) analysis to identify the most predictive fea-
tures. The IV metric quantifies a feature’s discrimi-
native power based on the distribution of positive and
negative classes across binned intervals, calculated as:
IV =
∑
i
(P
i
− N
i
) × ln
P
i
N
i
Based on IV scores, we selected the most important
features with high discriminative power for the final
ranking model.
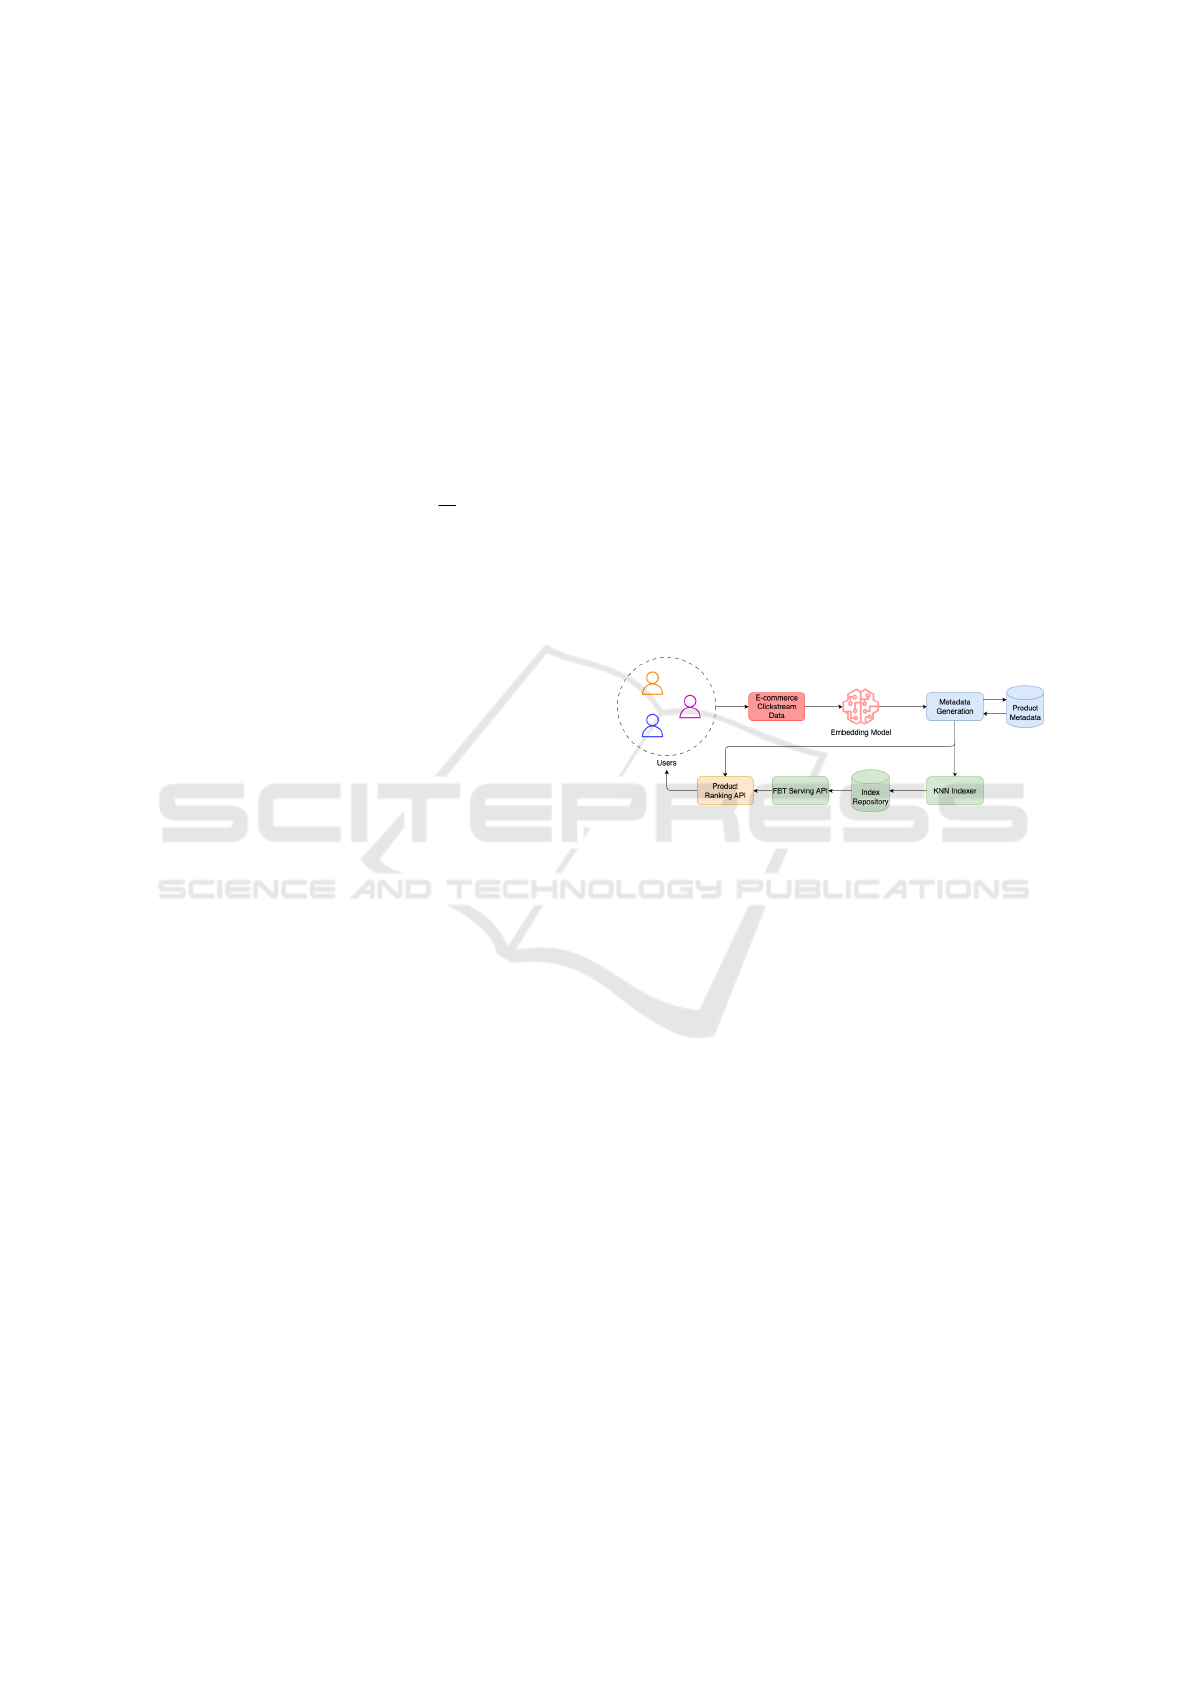
4 SYSTEM ARCHITECTURE
AND PIPELINE
Our modeling framework supports an end-to-end
pipeline for ”Frequently Bought Together” (FBT) rec-
ommendations, integrating both candidate generation
and ranking stages in a production environment. The
full architecture is illustrated in Figure 2.
The process begins with user interactions col-
lected from e-commerce clickstream data, which are
passed through a trained embedding model to com-
pute dense product representations. These embed-
dings are enriched with metadata (e.g., category,
brand, price, and reviews), and stored in a centralized
product metadata repository. The resulting vectors are
indexed using a K-Nearest Neighbor (KNN) indexer,
enabling fast retrieval of similar products.
4.1 Serving API and Online Inference
The Serving API acts as the central online service for
delivering FBT recommendations to end users in real
time. When a user visits a product detail page, the
API orchestrates the following steps:
1. Candidate Retrieval: The API queries the KNN
index with the embedding of the currently viewed
product to retrieve top-k candidate items.
2. Feature Enrichment: Retrieved candidates are
enriched with additional metadata (e.g., product
category, brand, price, ratings, and recent engage-
ment statistics) from the centralized product meta-
data repository.
3. Ranking Inference: The enriched candidates are
passed to the Product Ranking API, which ap-
plies the trained model to compute purchase like-
lihood scores. This ranking step balances simi-
larity, commercial performance, and engagement
signals.
4. Response Delivery: The final ranked list is re-
turned as a JSON response to the frontend service,
where it is displayed as ”Frequently Bought To-
gether” recommendations.
The Serving API is optimized for low-latency,
high-throughput environments. It leverages caching
for popular product embeddings, parallel batch
queries for feature retrieval, and asynchronous com-
munication with the ranking service. This ensures
that recommendation responses are typically gener-
ated within 20–30 milliseconds, meeting the strict la-
tency requirements of large-scale e-commerce plat-
forms.
Figure 2: End-to-end FBT candidate generation and ranking
pipeline.
5 METHODOLOGY
We conduct a comprehensive experimental evalua-
tion comparing TabM neural ensembles with tradi-
tional machine learning approaches on the FBT rank-
ing task.
5.1 Experimental Setup
Our evaluation framework compares the following al-
gorithms:
• TabM: Parameter-efficient neural ensemble with
BatchEnsemble mechanisms
• CatBoost: Gradient boosting optimized for cate-
gorical features
• XGBoost: Tree-based ensemble with regulariza-
tion
• Random Forest: Bagging ensemble for baseline
comparison
• Logistic Regression: Linear model with L2 reg-
ularization
TabM vs. Traditional ML for e-Commerce Product Ranking: A Multi-Signal Framework for Frequently Bought Together Recommendations
245
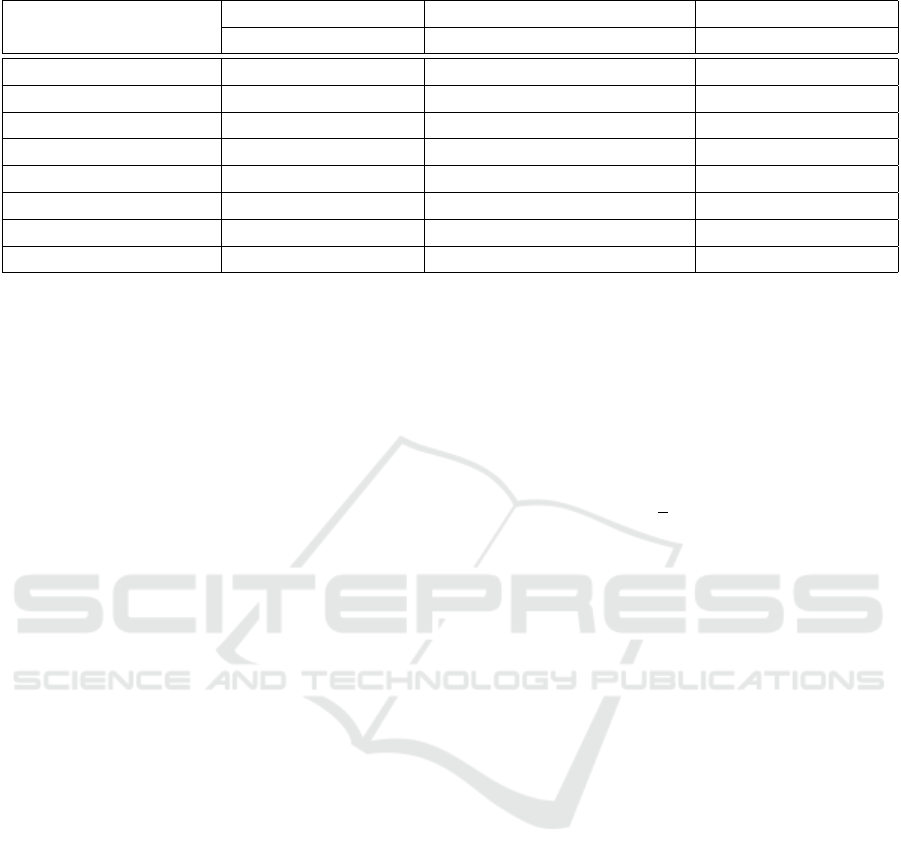
Table 2: Model Performance Comparison on Test Set.
Model Hit Rate NDCG Precision
@1 @3 @5 @1 @3 @5 @10 @1 @5 @10
TabM 0.451 0.709 0.826 0.451 0.551 0.608 0.666 0.451 0.219 0.138
CatBoost 0.429 0.698 0.814 0.429 0.534 0.590 0.650 0.429 0.215 0.137
XGBoost 0.411 0.684 0.802 0.411 0.518 0.575 0.639 0.411 0.210 0.136
Random Forest 0.400 0.670 0.790 0.400 0.506 0.563 0.629 0.400 0.206 0.135
HistGradientBoosting 0.389 0.669 0.786 0.389 0.500 0.556 0.621 0.389 0.204 0.134
Extra Trees 0.339 0.596 0.724 0.339 0.439 0.497 0.569 0.339 0.186 0.127
Logistic Regression 0.359 0.614 0.732 0.359 0.456 0.510 0.574 0.359 0.189 0.125
Position Baseline 0.321 0.561 0.669 0.321 0.412 0.459 0.531 0.321 0.170 0.118
Our model selection process balances three criti-
cal factors:
1. Offline Performance: Evaluated using HR@5,
NDCG@10, and Precision metrics
2. Production Constraints: Inference latency <
30ms, memory footprint < 1GB
3. Operational Requirements: Model inter-
pretability for business stakeholders
5.2 TabM Model Architecture
TabM (Tabular Multiple predictions) is based on
parameter-efficient ensembling techniques (Gorish-
niy et al., 2024), which employs BatchEnsemble
mechanisms specifically designed to efficiently rep-
resent multiple MLPs while sharing most param-
eters. The model uses strategic weight sharing
through learnable adapters and simultaneous training
to achieve superior performance on tabular datasets.
The core TabM architecture consists of k implicit
ensemble members, where each member processes in-
puts through modified linear layers with shared and
non-shared components:
l
BE
(X) = ((X ⊙ R)W) ⊙ S + B (1)
where X ∈ R
k×d
contains k object representa-
tions (one per ensemble member), R, S, B ∈ R
k×d
are
the non-shared adapters for each ensemble member,
W ∈ R
d×d
is the shared weight matrix, and ⊙ denotes
element-wise multiplication.
The feature transformation for each ensemble
member i follows:
h
[i]
= s
i
⊙ (W(r
i
⊙ x
i
)) + b
i
(2)
where r
i
, s
i
, b
i
represent the individual adapters
for ensemble member i, and x
i
is the input represen-
tation for that member.
The critical first adapter initialization ensures
proper ensemble diversity:
R
[1]
∼ N (0, 1), R
[l]
, S
[l]
= 1 for l > 1 (3)
The final prediction aggregates predictions from
all ensemble members:
ˆy =
1
k
k
∑
i=1
f (h
[i]
) (4)
where f (·) represents the output transformation
(sigmoid for classification, identity for regression).
For our implementation, we configure TabM with
k = 32 ensemble members, network depth N = 3 lay-
ers, and hidden dimension d = 512. The preprocess-
ing pipeline follows TabM’s advanced data prepara-
tion strategy: numerical features undergo Quantile-
Transformer normalization with noise injection for
stability, while categorical features are label-encoded
with cardinality tracking. We employ PiecewiseLin-
earEmbeddings with 48 bins and 16-dimensional em-
beddings for numerical features, and apply dropout
regularization during training. The model is trained
using AdamW optimizer with weight decay, and Fo-
cal Loss (α = 0.25, γ = 2.0) to handle class imbal-
ance.
6 RESULTS AND DISCUSSION
The Information Value analysis demonstrates that ini-
tial ranking position provides the strongest predictive
signals, while commercial performance differentials
and categorical matching offer valuable supplemen-
tary information.
6.1 Model Performance Comparison
We evaluate multiple models using ranking metrics
commonly adopted in recommendation systems: Hit
ICEEECS 2025 - International Conference on Advances in Electrical, Electronics, Energy, and Computer Sciences
246

Figure 3: Ranking model outputs for Android Phone (left) and Laptop (right) showing recommended complementary products.
First row shows the baseline recommendation order, second row shows our model’s reranked choices. Items outlined in green
represent actual co-purchases from historical transaction data, demonstrating the model’s ability to prioritize frequently bought
together items.
Rate at rank 5 (HR@5), Normalized Discounted Cu-
mulative Gain at rank 10 (NDCG@10), and Pre-
cision at ranks 5 and 10 (P@5, P@10). Among
these, NDCG is particularly informative as it accounts
for both the position and relevance of recommended
items, assigning higher scores when correct predic-
tions appear earlier in the ranked list.
TabM emerges as the clear performance leader,
achieving the highest scores across all evaluation
metrics. The neural ensemble demonstrates supe-
rior ranking quality with an HR@5 of 0.826 and
NDCG@10 of 0.666, representing substantial im-
provements over traditional machine learning ap-
proaches. CatBoost follows as the second-best per-
former among tree-based methods, while logistic re-
gression provides a strong baseline despite its sim-
plicity.
Figure 3 illustrates these quantitative improve-
ments through qualitative examples, showing how our
model effectively prioritizes items that were actu-
ally co-purchased (highlighted in green) compared to
baseline rankings. This demonstrates improved align-
ment with actual user purchase behavior while main-
taining recommendation diversity.
7 CONCLUSION AND FUTURE
WORK
This paper presented a comprehensive evaluation
of machine learning approaches for product rank-
ing in ”Frequently Bought Together” e-commerce
recommendation systems. We systematically com-
pared neural (TabM) and traditional ML methods,
ultimately demonstrating that deployment decisions
require careful consideration of the performance-
complexity-interpretability trade-off space.
7.1 Key Contributions
Our research makes several contributions to practical
recommendation systems:
1. Empirical Comparison: We provide a thor-
ough comparison of TabM neural ensembles
against traditional ML approaches, demonstrat-
ing that deep learning can indeed outperform gra-
dient boosting methods in tabular recommenda-
tion tasks. TabM achieves superior performance
across all metrics, with notable improvements of
+23.5% HR@5 over position baseline, +14.5%
NDCG@10 over logistic regression, and consis-
tent gains over state-of-the-art gradient boosting
methods including CatBoost and XGBoost.
2. Neural Architecture Validation: We
demonstrate that TabM’s parameter-efficient
BatchEnsemble mechanisms can effectively
challenge the dominance of gradient boosting in
tabular data scenarios, particularly in e-commerce
ranking tasks where complex feature interactions
are crucial.
Future research directions include:
• Multi-objective optimization techniques balanc-
ing conversion probability with revenue and in-
ventory management objectives
• Personalization strategies incorporating user-
specific preferences and historical interaction pat-
terns
• Dynamic reranking approaches that adapt to real-
time inventory and promotional considerations
• Cross-category recommendation expansion using
graph-based relationship modeling
This research contributes to the growing field of
practical recommendation systems in e-commerce,
providing a framework that prioritizes deployabil-
ity, interpretability, and business alignment alongside
predictive performance.
TabM vs. Traditional ML for e-Commerce Product Ranking: A Multi-Signal Framework for Frequently Bought Together Recommendations
247

REFERENCES
Chen, T. and Guestrin, C. (2016). Xgboost: A scalable
tree boosting system. In Proceedings of the 22nd acm
sigkdd international conference on knowledge discov-
ery and data mining, pages 785–794.
Geurts, P., Ernst, D., and Wehenkel, L. (2006). Extremely
randomized trees. Machine learning, 63(1):3–42.
Gorishniy, Y., Kotelnikov, A., and Babenko, A. (2024).
Tabm: Advancing tabular deep learning with
parameter-efficient ensembling.
Kabir, M. A., Hasan, M. A., Mandal, A., Tunkelang, D.,
and Wu, Z. (2024). A survey on e-commerce learning
to rank. arXiv preprint arXiv:2412.03581.
Ke, G., Meng, Q., Finley, T., Wang, T., Chen, W., Ma, W.,
Ye, Q., and Liu, T.-Y. (2017). Lightgbm: A highly
efficient gradient boosting decision tree. Advances in
neural information processing systems, 30.
Keskin, M., Teper, E., B
¨
uk, B., and Sezgin, M. S.
(2024a). Banner ranking based on click prediction
in the e-commerce. In 2024 International Congress
on Human-Computer Interaction, Optimization and
Robotic Applications (HORA), pages 1–6.
Keskin, M., Teper, E., and Kurt, A. (2024b). Comparative
evaluation of word2vec and node2vec for frequently
bought together recommendations in e-commerce. In
2024 9th International Conference on Computer Sci-
ence and Engineering (UBMK), pages 1–5.
Loukili, M., Messaoudi, F., and El Ghazi, M. (2023).
Machine learning based recommender system for e-
commerce. IAES International Journal of Artificial
Intelligence, 12(4):1803–1811.
Prokhorenkova, L., Gusev, G., Vorobev, A., Dorogush,
A. V., and Gulin, A. (2018). Catboost: unbiased boost-
ing with categorical features. Advances in neural in-
formation processing systems, 31.
Raymaekers, J., Verbeke, W., and Verdonck, T. (2021).
Weight-of-evidence 2.0 with shrinkage and spline-
binning. arXiv preprint arXiv:2101.01494.
Sun, F., Liu, J., Wu, J., Pei, C., Lin, X., Ou, W., and Jiang,
P. (2019). Bert4rec: Sequential recommendation with
bidirectional encoder representations from transform-
ers. In Proceedings of the 28th ACM International
Conference on Information and Knowledge Manage-
ment, pages 1441–1450. ACM.
Wu, L., Zhou, Y., and Zhou, D. (2022). Towards high-order
complementary recommendation via logical reason-
ing network. In 2022 IEEE International Conference
on Data Mining (ICDM), pages 1227–1232. IEEE.
ICEEECS 2025 - International Conference on Advances in Electrical, Electronics, Energy, and Computer Sciences
248
