
Evaluation of Solar Resource Availability and Smart Load
Scheduling for Residential Buildings
William Olurotimi Falana
1a
, Ikechukwu Samuel Obidi
2b
and Samuel Nii Tackie
1c
1
Dept. of Electrical and Electronic Engr, Near East University, Nicosia, Cyprus
2
Dept. of Electronics and Computer Engr, University of Nigeria, Enugu, Nigeria
Keywords: Solar Resources, Smart Load Scheduling, Energy Management, Electric Grid.
Abstract: Residential energy applications based on solar resources are rapidly becoming the norm due to the enormous
advantages of solar energy. In this study we investigated and evaluated the amount of solar resources available
around the year using Cyprus has a case study. This was done by understanding the seasonal trends and
potential solar outputs that can be available to a hypothetical residential load which were classified into two.
Fixed load of 2.5kw and flexible load of 1.5kw making the total load 4kw. To achieve this we used a dataset
from NASA POWER that provides us with important information about our case study Cyprus such has All
Sky Surface Shortwave Downward Irradiance and All sky isolation clearness index which was used for this
analysis. An evaluation model is created using Python to simulate the availability and reliability of solar
energy resources for a potential smart load scheduling strategy using the hypothetical residential load of 4kw.
The results shows that during the summer period there is abundance of solar resources to cater for our
hypothetical residential load of 4kw (fixed and flexible loads), with an average daily energy production of
6.83 kWh and a clearness score of 0.66, this suggest that during this period the sky conditions is perfect for
solar collecting. During the winter period the result suggest that there was less solar resources availability to
cater for our hypothetical residential load of 4kw, with an average daily energy production of 2.46 kWh and
a clearness score of 0.49, suggest that during this period the solar resources can only cater for the fixed load,
this is as a result of frequent cloud cover and limited sun. Spring and autumn indicated moderate levels with
some variation.
1 INTRODUCTION
The energy demands around the world are steadily
increasing, especially for clean, reliable and
sustainable energy (Obaideen et al., 2023), indicating
the need for intelligent and highly efficient energy
management methods and strategies, particularly in
residential buildings. Smart load scheduling involves
methods and strategies used for managing and
prioritizing electrical loads based on availability,
cost, and user preferences (Yang et al., 2023).
Residential buildings mostly have need for systems
and gadgets which are mostly energy dependent and
expensive to run. Sustainable energy sources like
solar photovoltaic systems if properly explored, has
the ability to reduce grid power consumption and save
a
https://orcid.org/0009-0002-4339-7418
b
https://orcid.org/0009-0003-6357-7608
c
https://orcid.org/0000-0002-5141-9974
cost. An example of this optimization technique is
smart load scheduling. This is critical for energy
efficiency, lower energy costs, and grid sustainability.
The availability of Sustainable energy sources,
such as solar energy, is fast becoming increasingly
popular in Cyprus, particularly in residential
applications (Kassem, Gokcekus, & Aljatlawe,
2023). With new innovations in smart grid
technologies and efficient energy management
systems, using solar energy in residential building is
more feasible and effective. (Khan et al., 2022).
Natural events like Seasonal and climatic changes
have posed a major challenge on the solar energy
supply, leading to solar energy's fluctuation which is
a significant problem in maximizing its usage for load
scheduling. Smart load scheduling is the process of
Falana, W. O., Obidi, I. S. and Tackie, S. N.
Evaluation of Solar Resource Availability and Smart Load Scheduling for Residential Buildings.
DOI: 10.5220/0014288600004848
Paper published under CC license (CC BY-NC-ND 4.0)
In Proceedings of the 2nd International Conference on Advances in Electrical, Electronics, Energy, and Computer Sciences (ICEEECS 2025), pages 203-210
ISBN: 978-989-758-783-2
Proceedings Copyright © 2026 by SCITEPRESS – Science and Technology Publications, Lda.
203

strategic management of energy resources. In the case
of solar resources, it is the efficient management of
energy consumption in accordance with periods of
maximum solar energy availability (Dragomir &
Dragomir, 2023). For effective load scheduling, it is
critical to understand the patterns of solar irradiance
and their implications on energy generation. Making
use of dataset like that of NASA’s power for the
Prediction of Worldwide Energy Resources data
(NASA, 2025), helps to provide a dependable method
for analysing solar resource availability in Cyprus as
a case study. In this study, our goal is to evaluate the
seasonal changes in solar resources using NASA
power dataset to estimate the monthly energy output
by conducting an analysis using metrics like all-sky
surface shortwave downward irradiance and all-sky
isolation clearness index. This study is intended to
support and provide useful and important insight to
homeowners, planners, and policymakers in making
informed decisions on the usage of solar resources
and grid reliance throughout the year.
2 LITERATURE REVIEW
Smart load scheduling and solar resource availability
are very important for efficient energy usage,
especially in applications related to solar energy
generation. With respect to this, there have been
several related works on smart load scheduling
strategies that have been considered in several
instances and solar resource evaluations.
Chreim et al introduce a price-based demand
response system for residential smart homes that
combines renewable energy, battery storage, and
electric cars. It employs a hybrid algorithm for
optimal load scheduling and a machine learning-
based clustering technique to learn user preferences
from real-world consumption data. The result was
tested using actual smart house traces and put on a
Raspberry Pi to assess performance and energy
consumption. (Chreim et al., 2022).
Remani et al provide an average home load
scheduling model that incorporates renewable energy
sources such as PV into any tariff structure. It
proposes a reinforcement learning (RL)-based
strategy for managing load commitment under
uncertainty while retaining customer satisfaction.
(Remani et al., 2018).
Chen et al describe a demand response scheduling
strategy for residential buildings that aims at four
types of loads, including air conditioning and other
deferrable/interruptible categories. It uses the
Nondominated Sorting Genetic Algorithm II to
balance power costs and user discomfort. The method
is evaluated on an ASHRAE 140 standard building
under both working and nonworking day conditions.
The results indicate successful peak load shifting,
lower power expenses, and sustained occupant
comfort (Chen et al., 2022).
Albogamy et al proposed an (EMC) that uses a
hybrid Enhanced Differential Evolution and Genetic
Algorithm (EDGE) to automate home load
scheduling. The EMC responds to demand response
signals by managing three types of home loads:
interruptible, non-interruptible, and hybrid.
Simulation findings demonstrate that EDGE
outperforms current algorithms such as BPSO, GA,
WDO, and EDE across all performance measures
(Albogamy et al., 2022).
Ikram et al Investigated Two meta-heuristic
optimization strategies for scheduling flexible
household loads in a smart home equipped with
rooftop solar, battery storage, and grid connectivity.
The goal is to cut power bills and peak-to-average
ratios while keeping users comfortable. The
simulation findings reveal a 4.5% decrease in daily
power costs from 507.12 to 484.33 BDT,
demonstrating the effectiveness of both optimization
strategies without shutting off necessary loads (Ikram
et al., 2024).
Abdelhameed et al present smart home load
scheduling as a multi-objective restricted mixed-
integer optimization problem (CP-MIP) for lowering
power costs and increasing user comfort. The strategy
is evaluated using time-of-use pricing and two power
modes: grid-only and grid-tied PV. Four
metaheuristic algorithms are compared, including
CL-JAYA and SOH-PSO. The results demonstrate
considerable bill savings (up to 56.1%), with CL-
JAYA delivering the best user comfort
(Abdelhameed et al., 2023).
Stroia et al present a networked sensor system for
real-time monitoring and forecasting of domestic
appliance power usage and ambient variables. It
enables load modelling, database building, and
testing of load-scheduling algorithms at various sizes,
ranging from single residences to large cities. A
hardware/software co-designed architecture
combines building automation and energy
management technologies. The use of piecewise
linear (PWL) load profile representations is proven to
enhance peak shaving compared to standard average-
based techniques (Stroia et al., 2022).
Qayyum et al investigation looks into the
integration of energy management systems in smart
residential structures as key components of smart
cities. It examines the relationship between smart
ICEEECS 2025 - International Conference on Advances in Electrical, Electronics, Energy, and Computer Sciences
204

grids, energy storage, infrastructure, and urban
sustainability without using mathematical models.
The study discusses how developing energy sources
and efficient transportation affect smart urban
systems, emphasizing the importance of cross-
disciplinary, holistic methods. (Qayyum et al., 2023).
Tackie & Özerdem evaluated the performance of
the 1.275 MW Kib-Tek solar power facility in
Northern Cyprus. It evaluates plant efficiency,
capacity factor (17.71%), and performance ratio
(85.77%) using PVsyst simulations. The addition of a
single-axis tracker decreased the payback period from
nine to seven and increased production by 27.88%. At
the simulated locations of Famagusta, Girne, and
Lefkosa, grid-injected energy increased by 31.22%
with tracking (Tackie & Özerdem, 2022).
Ozerdem et al. evaluated the performance of the
1.2 MW Serhatkoy PV power plant, the first grid-
connected plant in North Cyprus. This study
simulation was used to determine important
parameters, including performance ratio (PR) and
capacity factor (CF), using PVSyst software and
NASA weather data. In order to facilitate future
development, maintenance planning, and investment
evaluation, the payback period is also approximated,
taking currency exchange rates into account
(Ozerdem et al., 2015).
3 ANALYTICAL FRAMEWORK
3.1 Data Overview
The Goal of this evaluation is to study the availability
and reliability of solar energy resources in Cyprus
using NASA POWER satellite-derived data (NASA,
2025). And to evaluate the possibility of adopting
intelligent load scheduling systems in residential
buildings. Furthermore, to estimate solar energy
output and analyse its temporal trends (daily,
monthly, and seasonal). In regard to this, the dataset
covers the period of 1st January 2019 to December
31st 2024, which contains the following:
• All Sky Surface Shortwave Downward
Irradiance (kWh/m²/day): This contains the
total amount of solar irradiance information
that reached the earth irrespective of
different sky conditions.
• All sky isolation clearness index: This
contains the ratio of real solar irradiance to
theoretical clear sky irradiance, which
indicates cloudiness.
3.2 Seasonal Classification
To study seasonal patterns in solar irradiance and
energy output, each record was labelled as winter,
spring, summer, and fall for each month.
3.3 Solar Resources Analysis
To carry out this study, the daily solar irradiance data
are analysed to calculate monthly averages for solar
irradiance and clearness index. Classify days as
Sunny, Partly Cloudy, or Cloudy using clearness
index criteria (≥0.8 sunny, 0.5 ≤ CI < 0.8 partly
cloudy, <0.5 cloudy).
3.4 Solar Energy Output Estimation
The goal is to estimate the solar energy output for a
hypothetical household photovoltaic system. This is
achieved by using the site-specific environmental
data and panel characteristics such as the following
parameters:
Panel area A = 6.4 m²
Panel efficiency μ=18%
Performance ratio PR = 0.8 (accounting for system
losses)
The daily energy output was calculated as:
E daily = A x μ x PR x Irradiance......... (1)
These parameters were considered under standard
conditions.
Panel Area
For a residential building in Cyprus
A normal solar panel = 1.63 m² (Mokhtara et al.,
2019)
A residential building in this hypothetical simulation
has an estimated number of 4 solar panels.
Panel area = 1.63 m² x 4 = 6.52 (rounded up to 6.5)
Panel efficiency
Considering the type of solar panel in this case, we
considered a modern monocrystalline panel, whose
efficiency of converting sunlight into electricity is
around 18 – 22%. We selected the least case for this,
which is 18% (Vodapally & Ali, 2022).
Performance ratio PR
We considered a PR value as a case of a standard and
a well-maintained solar panel, which is 0.8 in this
case.
Scenario 1:
Evaluation of Solar Resource Availability and Smart Load Scheduling for Residential Buildings
205
To estimate the solar energy output for the 2
nd
day of
January 2019.
Panel area A = 6.5 m²
Panel efficiency μ=18%
Performance ratio PR = 0.8
According to the dataset, the all-sky surface
shortwave downward irradiance for the 2
nd
day of Jan
2019 is estimated to be 1.17 kWh/m²/day
E daily = A x μ x PR x Irradiance
E daily = 6.5 m² x 0.18 x 0.8 x 1.17 = 1.095 kWh.
The total energy generated on the 2
nd
day of January
2019 is 1.095 kWh.
3.5 Smart Load Scheduling Model
To facilitate smart load scheduling, residential energy
demand was estimated and divided into two
categories: fixed loads and flexible loads. In a
hypothetical situation, fixed loads were projected to
consume around 1.5 kWh/day, while flexible loads
consumed 2.5 kWh/day, for a total daily consumption
of 4.0 kWh. The identified peak sun hours were
projected to yield 40% of the total daily solar energy.
The purpose of the scheduling model is to determine
how much of a household's electricity use could be
covered by solar energy during the four hours of the
day when sunshine is at its strongest. Additionally, it
examined how much electricity could be saved from
the grid by relocating flexible appliances (such as
water heaters or washing machines) to run during
those sunny hours. Through the use of daily data on
solar energy production and household power usage,
the model assisted in assessing the monthly
effectiveness of a potential smart load scheduling
strategy to improve solar energy usage and lessen the
load’s reliance on the grid.
Grid Energy Savings (kWh): The amount of energy
saved by using solar to replace grid usage.
Peak Grid consumption reduction (kW): An
estimated decrease in peak electricity consumption
based on a 4-hour peak period.
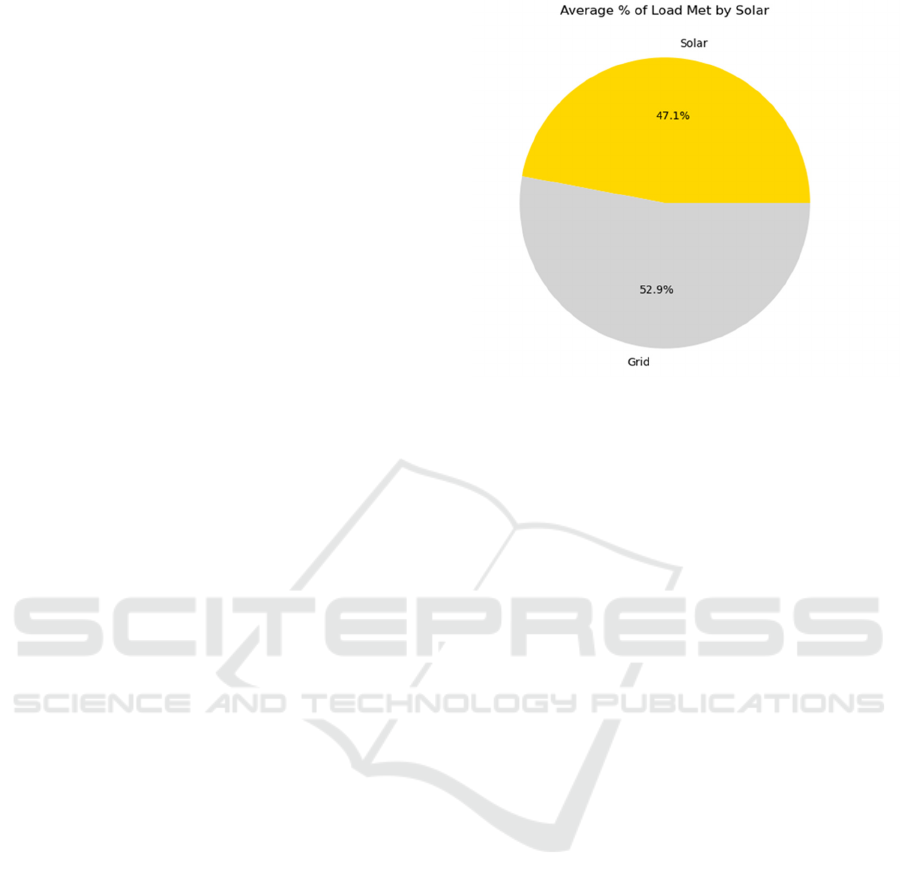
3.6 Average Percentage of Load Met by
Solar
The average percentage of load met by solar metric
indicates how much of a household's or building’s
energy demand could be catered for by solar energy,
often during peak sunshine hours.
Figure 1: Average Percentage of Load Met by Solar.
From Fig. 1, the data reveal that solar energy accounts
for roughly 47% of the home load during peak hours.
Solar energy makes a significant contribution, but
does not entirely meet energy demand with present
system characteristics (PV size = 6.5 m², efficiency =
18%, PR = 0.8). A 47% solar contribution shows the
possibilities for partial load scheduling or battery
integration. To attain more independence from grid
power, expanding PV capacity, enhancing system
efficiency, or optimizing flexible load scheduling
may be put into consideration.
Scenario 2:
From Scenario 1 on the 2
nd
of January 2019, the total
energy generated is 1.095 kWh of electric energy.
We have a fixed load of 1.5kwh/day
And a flexible load of 2.5kwh/day
Total load = 4kwh/day
Total energy generated on the 2
nd
of January 2019 =
1.095 kWh
Grid Energy Savings (kWh) = Total energy generated
on day 2 = 1.095 kWh
During the Peak solar hours, it was anticipated to
generate 40% of the daily solar energy
40% of daily solar energy = 438wh.
Peak Grid Consumption Reduction (kW) = an
estimated decrease in peak electricity consumption
based on a 4-hour peak period.
= 438wh/4h = 109.5 watt.
ICEEECS 2025 - International Conference on Advances in Electrical, Electronics, Energy, and Computer Sciences
206
Average percentage of load met by solar on 2nd of
Jan 2019 = Total energy generated on 2nd of Jan 2019
/ Total load energy x 100% = 27.3%.
Average percentage of load met by solar on 2nd of
Jan 2019 at Peak solar hours = Solar Energy during 4-
hour peak (kWh)/ load during the 4-hour peak period
x 100%
Assume all 4 kWh is available during the 4-hour
peak period
Load during 4 hours peak period = 4.000kwh/4h
=1000watt
Average percentage of load met by solar =
109.5/1000 x 100 = 10.95%
4 EVALUATION OUTCOMES
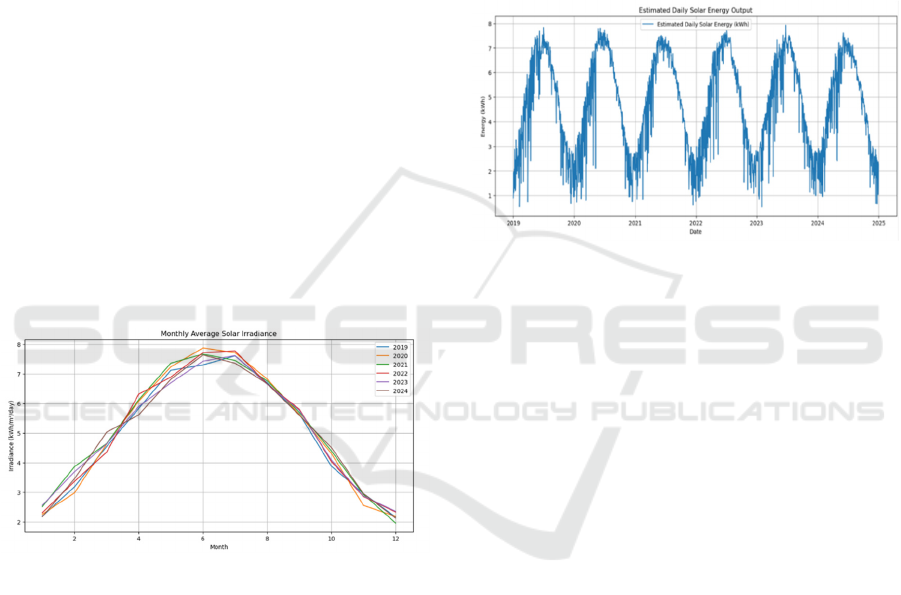
4.1 Monthly Average Solar Irradiance
The monthly average solar irradiance graph
(Irradiance vs. Month) is an important tool for
accessing solar energy potential throughout the year.
Figure 2: Monthly average solar irradiance.
• Seasonal Trends
From Fig. 2, it is observed that there is higher
irradiance between March and October,
corresponding to Cyprus's late spring in March,
summer, and early fall. This is due to the fact that
between these months, there are often clearer skies.
• Solar planning insights:
From Fig. 2, it is observed that months with the
highest irradiation, which are between June to
August, are the best for solar PV performance. This
helps us to anticipate system performance,
particularly for off-grid or hybrid solar systems.
• Yearly Comparison
From Fig. 2, it is observed that there is consistency
and slight variation from 2019 to 2024 solar resource,
which further suggests reliable energy yield planning.
4.2 Estimated Daily Solar Energy
Output
The Estimated Daily Solar Energy Output graph is an
important outcome of this study because it converts
solar irradiance into real usable energy (in kWh) that
a solar photovoltaic (PV) system would produce
daily.
Figure 3: Estimated daily solar energy output.
• Daily Variability:
From Fig. 3, Peaks indicate clear, bright days with a
high solar output, while the dips indicate cloudy or
rainy days, or periods with reduced irradiance. From
2019 to 2024, we estimated daily solar energy output
for 2025, taking the average of irradiance from 2019
to 2024 for each day.
• Seasonal Performance:
From Fig. 3, it is observed that during the summer
season, between June to August, output is high and
consistent. During winter seasons, output drops due
to cloud cover.
• Energy Forecasting:
From this information, it is easier to forecast how
much energy you can expect daily/monthly, which is
important for battery size, load planning, and
determining grid backup requirements.
• Supports Smart Load Scheduling:
From this information, it helps indicate when flexible
appliances can be booked on peak solar generating
days.
Evaluation of Solar Resource Availability and Smart Load Scheduling for Residential Buildings
207
4.3 Monthly Grid Energy Savings and
Demand Reduction
From the estimated daily solar energy consumption,
we are able to calculate how much grid electricity can
be saved each month by using solar power during
peak hours, as well as how much this solar usage
decreases the grid's maximum demand.
Table 1: Monthly Grid Energy Savings and Demand
Reduction for Jan – May 2019.
Year Month
Grid
Energy_Savings
(kWh)
Peak Grid
Demand
Reduction (kW)
2019 Jan 25.496 0.205
2019 Feb 33.418 0.298
2019 Mar 52.779 0.425
2019 Apr 64.126 0.534
2019 May 75.696 0.610
The monthly grid energy savings and demand
reduction statistics show how solar PV integration
reduces dependency on traditional grid electricity.
For example, in January 2019, solar power reduced
roughly 25.5 kWh of energy that would otherwise
have come from the grid, resulting in a 0.21 kW
reduction in peak demand. This shows the ability for
solar energy to not only lower monthly energy bills
but also reduce too much load on the power grid
during peak demand hours, contributing to more
reliable and sustainable energy systems.
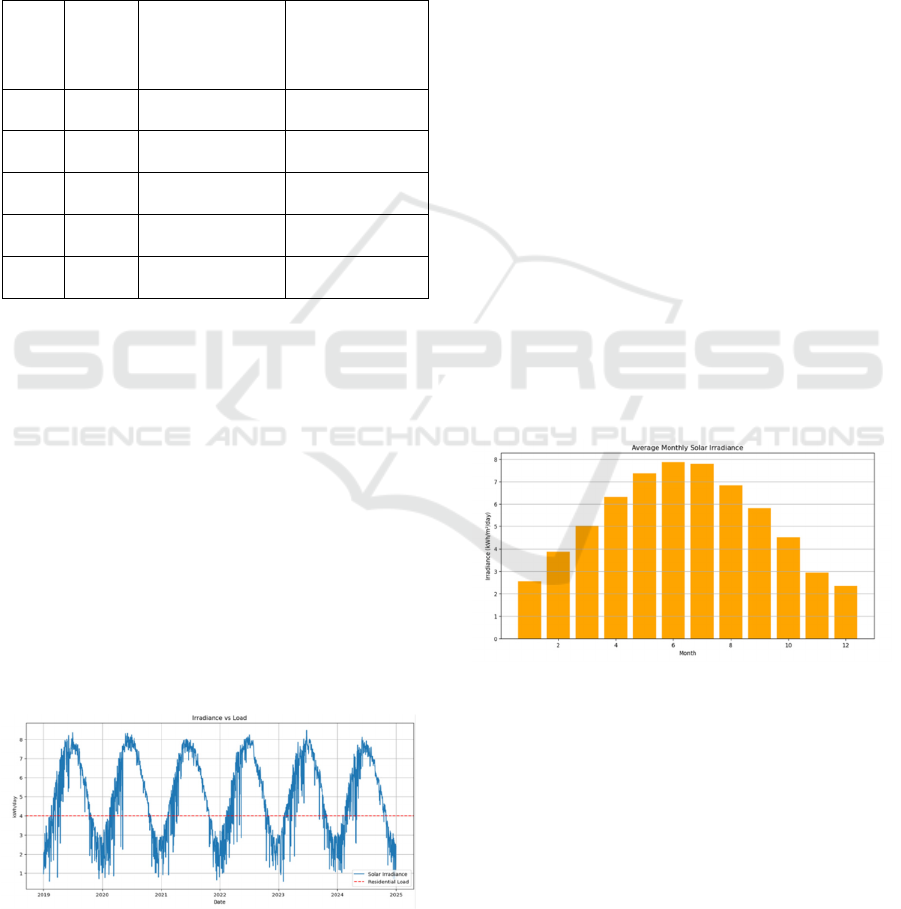
4.4 Irradiance vs Load
The goal here is to determine if the solar irradiation
on each day is adequate to fulfil a household's energy
requirements, especially during peak seasons.
Figure 4: Irradiance vs load.
From Fig. 4, the irradiance versus load graph shows
how solar resource availability varies over time in
relation to residential energy consumption. The curve
steadily grows, reaches a peak (summer), and finally
decreases (winter). The red dashed line represents a
fixed value, which is the daily energy requirement of
the hypothetical household or system.
Above the red line shows the months in, solar
irradiation meets or exceeds demand, allowing the
building to be self-sufficient or even create extra
energy. Below the red line shows months that solar
irradiation is not enough, necessitating grid help to
satisfy electricity demand.
• Energy Surplus Periods: the period when
irradiance exceeds load suggests the
possibility of grid export, battery charging,
or load scheduling.
• Insufficient Periods: the period when
irradiance falls below demand, during this
period there is grid reliance, backup
generators, or load prioritizing becomes
more necessary.
4.5 Average Monthly Solar Irradiance
The average monthly solar irradiance is the amount
of solar energy received per square meter per day in
each month. This helps in sizing solar panels,
predicting seasonal energy output, and designing
smart load scheduling systems.
Figure 5: Average monthly solar irradiance.
The average monthly solar irradiance in Cyprus
shows a unique seasonal trend, with peak values
observed during the summer season (June–August)
and a noticeable dip during the winter season
(September - May). These seasonal changes and
variations are very important for optimizing solar
power system performance and load scheduling
methods in residential buildings.
ICEEECS 2025 - International Conference on Advances in Electrical, Electronics, Energy, and Computer Sciences
208

4.6 Seasonal Solar Energy Summary
Seasonal Solar Energy Summary shows how solar
energy availability and sky conditions fluctuate
throughout the year. This includes:
Mean Daily Energy Output (kWh): is defined has the
average quantity of solar energy gathered each day
during each season.
Maximum and Minimum Energy: The best and worst
daily performance recorded throughout that season.
All-sky isolation clearness index is a measure of sky
clarity (near 1 = clear skies, < 0.5 = hazy).
Table 2: Seasonal Solar Energy Summary.
Season
Daily
Energy
Kwh
Mean
Max
Min
Clearness
Index
Fall 3.98 6.14 0.94 0.59
Sprin
g
5.50 7.76 0.73 0.59
Summe
r
6.83 7.92 4.37 0.66
Winte
r
2.46 4.82 0.53 0.48
• Daily energy (kWh)
From Table 2, summer has the highest mean daily
solar energy (6.83 kWh), with the lowest difference
between minimum and maximum values, showing a
consistent excellent solar performance. Winter has
the lowest average (2.46 kWh), with greater
unpredictability and less dependable solar energy
output. Spring and autumn are transitional seasons,
with modest sun availability.
• Clearness Index (CI)
The CI is the ratio of real solar radiation to clear-sky
radiation (0–1). Higher readings (~0.66 in summer)
indicate a cleaner sky and improved sun conditions.
Lower values (~0.49 in winter) imply cloudier
circumstances and more atmospheric interference.
5 CONCLUSIONS
This study used NASA POWER dataset from 2019 to
2024 to assess solar resource availability and its
implications for smart load scheduling in Cyprus
residential buildings. There were several Key
characteristics that are were considered which were
daily solar irradiance, clearness index, predicted solar
energy output, and the extent to which solar energy
can balance grid demand during peak solar hours. The
investigation indicates that the monthly average solar
irradiation is high enough throughout the year to
sustain dependable photovoltaic (PV) power. Daily
solar energy output (based on a 6.5 m² panel at 18%
efficiency and a 0.8 performance ratio) ranged from
2.5 to 6.1 kWh/day, with greater performers seen
during the summer season. During peak sunshine
hours, solar output met 49% of the home load (which
included both fixed and flexible components). This
implies a high potential for load-shifting solutions,
particularly for flexible appliances or battery
charging. The irradiance vs. load study revealed that
solar generation outperformed basic home
consumption levels for several months, particularly
during the summer season. The monthly grid energy
savings and peak demand reduction estimations
indicate that solar integration can considerably
decrease strain on the national grid infrastructure. In
months with high irradiance, flexible loads might be
totally powered by solar energy, saving money and
improving grid dependability.
The seasonal solar energy summary showed strong
trends:
• Summer is the best time to schedule big or
important solar-dependent loads due to high
irradiance and reasonably predictable
weather patterns.
• Winter poses problems, with lower
irradiance levels and more fluctuation,
demanding a larger dependence on grid
assistance or energy storage options.
• Spring and fall offer intermediate conditions
in which partial battery storage or adaptive
scheduling may be most effective in
ensuring energy dependability.
The result of this study demonstrates the potential of
solar-assisted smart load scheduling as a means of
ensuring sustainable energy access, particularly in
Cyprus. Energy planners are advised to use these
seasonal insights when developing demand-side
management programs, home solar incentives, or
hybrid solar-grid systems to increase energy reliance.
REFERENCES
Abdelhameed, E. H., Abdelraheem, S., Mohamed, Y. S., &
Diab, A. A. Z. (2023). Effective hybrid search
technique based constraint mixed-integer programming
for smart home residential load scheduling. Scientific
Reports, 13(1), 21870. https://doi.org/10.1038/s41598-
023-48718-w
Albogamy, F. R., Khan, S. A., Hafeez, G., Murawwat, S.,
Khan, S., Haider, S. I., ... & Thoben, K. D. (2022). Real-
time energy management and load scheduling with
renewable energy integration in smart grid.
Evaluation of Solar Resource Availability and Smart Load Scheduling for Residential Buildings
209

Sustainability, 14(3), 1792.
https://doi.org/10.3390/su14031792
Chen, Z., Chen, Y., He, R., Liu, J., Gao, M., & Zhang, L.
(2022). Multi-objective residential load scheduling
approach for demand response in smart grid.
Sustainable Cities and Society, 76, 103530.
https://doi.org/10.1016/j.scs.2021.103530
Chreim, B., Esseghir, M., & Merghem-Boulahia, L. (2022).
LOSISH—LOad Scheduling In Smart Homes based on
demand response: Application to smart grids. Applied
Energy, 323, 119606.
https://doi.org/10.1016/j.apenergy.2022.119606
Dragomir, O. E., & Dragomir, F. (2023). Application of
scheduling techniques for load-shifting in smart homes
with renewable-energy-sources integration. Buildings,
13(1), 134. https://doi.org/10.3390/buildings13010134
Ikram, A. I., Ullah, A., Datta, D., Islam, A., & Ahmed, T.
(2024). Optimizing energy consumption in smart
homes: Load scheduling approaches. IET Power
Electronics, 17(16), 2656–2668.
https://doi.org/10.1049/pel2.12674
Kassem, Y., Gokcekus, H., & Aljatlawe, A. (2023).
Utilization of solar energy for electric vehicle charging
and the energy consumption of residential buildings in
northern Cyprus: a case study. Engineering,
Technology & Applied Science Research, 13(5),
11598-11607.
Khan, N., Shahid, Z., Alam, M. M., Bakar Sajak, A. A.,
Mazliham, M. S., Khan, T. A., & Ali Rizvi, S. S. (2022).
Energy management systems using smart grids: An
exhaustive parametric comprehensive analysis of
existing trends, significance, opportunities, and
challenges. International Transactions on Electrical
Energy Systems, 2022(1), 3358795.
https://doi.org/10.1155/2022/3358795
Mokhtara, C., Negrou, B., Settou, N., Gouareh, A., &
Settou, B. (2019). Pathways to plus-energy buildings in
Algeria: design optimization method based on GIS and
multi-criteria decision-making. Energy Procedia, 162,
171-180.
NASA Prediction of Worldwide Energy Resources
(POWER). (2025, July 16). NASA POWER | Data
Access Viewer. https://power.larc.nasa.gov/data-
access-viewer/
Obaideen, K., Olabi, A. G., Al Swailmeen, Y., Shehata, N.,
Abdelkareem, M. A., Alami, A. H., ... & Sayed, E. T.
(2023). Solar energy: Applications, trends analysis,
bibliometric analysis and research contribution to
sustainable development goals (SDGs). Sustainability,
15(2), 1418.
Ozerdem, O. C., Tackie, S., & Biricik, S. (2015, November).
Performance evaluation of Serhatkoy (1.2 MW) PV
power plant. In 2015 9th International Conference on
electrical and Electronics Engineering (ELECO) (pp.
398-402). IEEE.
Qayyum, F., Jamil, H., & Ali, F. (2023). A review of smart
energy management in residential buildings for smart
cities. Energies, 17(1), 83.
https://doi.org/10.3390/en17010083
Remani, T., Jasmin, E. A., & Ahamed, T. I. (2018).
Residential load scheduling with renewable generation
in the smart grid: A reinforcement learning approach.
IEEE Systems Journal, 13(3), 3283–3294.
https://doi.org/10.1109/JSYST.2018.2824841
Stroia, N., Moga, D., Petreus, D., Lodin, A., Muresan, V.,
& Danubianu, M. (2022). Integrated smart-home
architecture for supporting monitoring and scheduling
strategies in residential clusters. Buildings, 12(7),1034.
https://doi.org/10.3390/buildings12071034
Tackie, S., & Özerdem, Ö. (2022). Performance Evaluation
and Viability Studies of Photovoltaic Power Plants in
North Cyprus. International Journal of Renewable
Research, 2237-2247.
Vodapally, S. N., & Ali, M. H. (2022). A comprehensive
review of solar photovoltaic (PV) technologies,
architecture, and its applications to improved efficiency.
Energies, 16(1), 319.
Yang, J., Sun, Q., Yao, L., Liu, Y., Yang, T., Chu, C., ... &
Zhu, L. (2023). A novel dynamic load-priority-based
scheduling strategy for home energy management
system. Journal of Cleaner Production, 389, 135978.
ICEEECS 2025 - International Conference on Advances in Electrical, Electronics, Energy, and Computer Sciences
210
