
Impact of Signal Segmentation on EEG-Based Seizure Detection: A
Comparative Time-Frequency Analysis
Nuri Ikizler
*
a
and Gunes Ekim
b
Department of Electronics and Automation, Trabzon Vocational School, Karadeniz Technical University, Trabzon, Turkey
*
Keywords: EEG Signal Segmentation, Epileptic Seizure Detection, Random Forest, Discrete Wavelet Transform, Power
Spectral Density.
Abstract: Accurate and timely detection of epileptic seizures from EEG signals is essential for reliable clinical decision
support and patient monitoring. In this study, the impact of data segmentation on seizure detection
performance is systematically investigated using the publicly available EEG dataset from the University of
Bonn. Two commonly applied feature extraction methods, Discrete Wavelet Transform and Power Spectral
Density, are evaluated in combination with a Random Forest classifier across multiple segmentation levels.
A fully automated experimental framework is developed in MATLAB, and classification tasks of varying
complexity, including binary and multi-class problems, are considered. The results reveal that signal
segmentation significantly affects classification performance, with moderate segmentation generally
improving accuracy for both Discrete Wavelet Transform and Power Spectral Density features. While
excessive segmentation degrades performance in the Discrete Wavelet Transform based approach, the Power
Spectral Density based method demonstrates greater robustness across segmentation levels. These findings
underline the critical role of segmentation strategy in EEG-based seizure detection and highlight the
importance of optimizing this parameter based on the chosen feature extraction technique. The insights
obtained from this study can guide the development of more efficient, real-time, and clinically applicable
seizure monitoring systems.
1 INTRODUCTION
Epilepsy is a chronic neurological disorder
characterized by recurrent, unprovoked seizures
resulting from abnormal electrical activity in the
brain. Affecting over 50 million individuals
worldwide, epilepsy significantly impairs quality of
life and, in severe cases, poses life-threatening risks
(World Health Organization, 2025). Accurate
detection and monitoring of epileptic seizures are
essential for effective disease management, yet
conventional diagnosis heavily relies on manual
inspection of electroencephalogram (EEG)
recordings by trained specialists. This process is time-
consuming, labour-intensive, and prone to subjective
interpretation, especially in long-term monitoring
scenarios (Milligan, 2021).
To address these challenges, automated seizure
detection systems based on EEG signal analysis have
a
https://orcid.org/0000-0002-7632-1973
b
https://orcid.org/0000-0003-4867-3100
been extensively investigated in recent years (Naidu
and Zuva, 2023). Numerous studies have explored
different approaches for extracting discriminative
features from EEG recordings, ranging from time-
domain methods to advanced time-frequency and
spectral techniques. Among these, Discrete Wavelet
Transform (DWT) and Power Spectral Density (PSD)
have gained significant attention due to their ability
to capture both transient and stationary characteristics
of EEG signals associated with seizure activity (Liu
et al., 2023, Kinaci et al., 2024).
In parallel, various machine learning algorithms,
including Support Vector Machines (SVM), k-
Nearest Neighbors (k-NN), and ensemble classifiers
such as Random Forests, have been employed to
classify extracted features with promising results
(Siddiqui et al., 2021). Despite these advancements,
many existing studies rely on pre-segmented datasets
or fixed-length signals, often overlooking the critical
Ikizler, N. and Ekim, G.
Impact of Signal Segmentation on EEG-Based Seizure Detection: A Comparative Time-Frequency Analysis.
DOI: 10.5220/0014284900004848
Paper published under CC license (CC BY-NC-ND 4.0)
In Proceedings of the 2nd International Conference on Advances in Electrical, Electronics, Energy, and Computer Sciences (ICEEECS 2025), pages 305-312
ISBN: 978-989-758-783-2
Proceedings Copyright © 2026 by SCITEPRESS – Science and Technology Publications, Lda.
305
role of signal segmentation strategy in the overall
classification performance (Thangavel, 2022).
Moreover, the selection and configuration of
segmentation parameters remain largely empirical in
literature, and their interaction with feature extraction
techniques is not systematically explored. This gap is
particularly relevant for real-world clinical
applications, where signal length, processing time,
and system responsiveness are key considerations.
The aim of this study is to systematically
investigate how different signal segmentation
strategies affect seizure detection performance using
two widely adopted feature extraction methods, DWT
and PSD, in combination with Random Forest
classification. To ensure comprehensive evaluation,
experiments were conducted on the well-established
University of Bonn EEG dataset, which is frequently
utilized as a benchmark in the field.
Unlike many previous studies, this work focuses
specifically on the relationship between segmentation
granularity, feature extraction approach, and
classification accuracy. The results demonstrate that
appropriate segmentation can significantly enhance
detection performance, while suboptimal
segmentation may degrade system reliability. These
findings not only contribute to a better understanding
of the signal processing pipeline for EEG-based
seizure detection but also provide practical insights
for developing more robust, real-time, and clinically
applicable monitoring systems.
2 MATERIAL AND METHODS
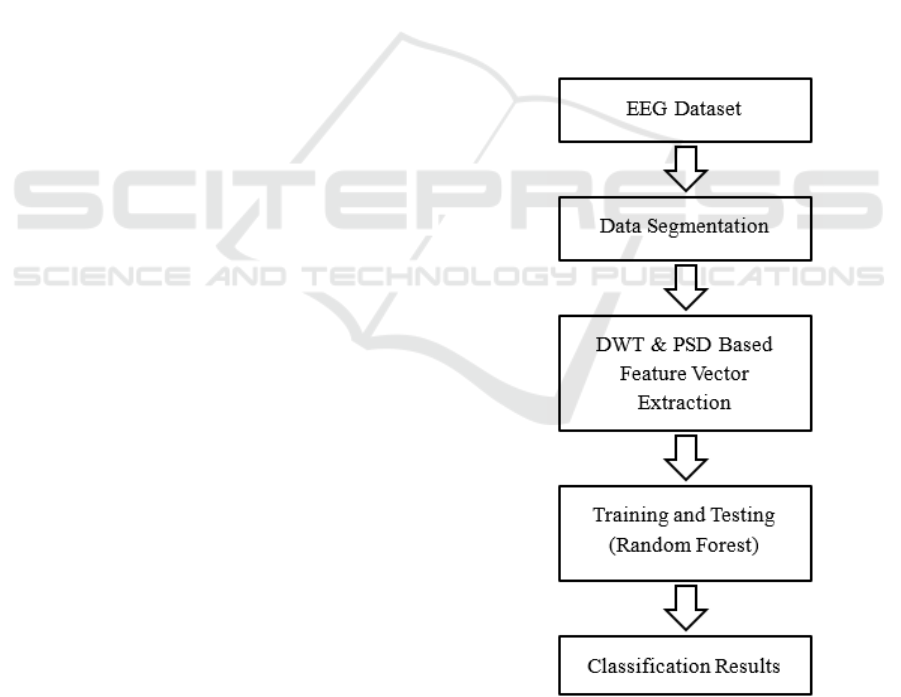
Block diagram of proposed study is given in Figure 1.
2.1 EEG Dataset
This study utilizes the publicly available EEG dataset
provided by the Department of Epileptology at the
University of Bonn, which has been extensively used
for seizure detection research. The dataset consists of
five subsets, each containing 100 single-channel EEG
recordings. Sets A and B represent surface EEG
recordings from healthy individuals with eyes open
and eyes closed, respectively. Sets C, D, and E
contain intracranial EEG recordings from epilepsy
patients, with set E specifically representing seizure
activity (Andrzejak et al., 2001).
Each EEG recording is composed of 4096
samples, acquired at a sampling frequency of 173.61
Hz. To investigate the effect of signal segmentation
on classification performance, the recordings were
divided into smaller, equally sized segments.
Different segmentation scenarios were applied,
including 1 (no segmentation), 2, 4, 8, and 16
segments per signal, allowing for a systematic
evaluation of how segment length influences feature
extraction and subsequent classification.
Segmenting the signals into smaller portions
provides both an increased number of training
examples and an opportunity to capture localized
signal variations, which is particularly relevant for the
detection of transient events such as epileptic
seizures.
2.2 Data Segmentation
Signal segmentation was performed by evenly
dividing each 4096-sample EEG recording into
smaller non-overlapping segments based on the
chosen segmentation factor. For instance, applying a
segmentation factor of 2 results in segments of 2048
samples each, whereas a factor of 16 yields segments
of 256 samples.
Figure 1: Block diagram of proposed study.
This segmentation process serves multiple
purposes. Firstly, it increases the total number of
available data samples, which is beneficial for
ICEEECS 2025 - International Conference on Advances in Electrical, Electronics, Energy, and Computer Sciences
306

training machine learning models and reducing the
risk of overfitting. Secondly, it allows for finer
temporal analysis by focusing on shorter signal
windows, which can reveal localized patterns and
frequency components that may be less visible in
longer segments. Importantly, the segmentation
strategy can influence the ability of feature extraction
methods to capture relevant information, making its
optimization a critical step in EEG-based
classification tasks (Zhou et al, 2024).
2.3 Feature Extraction
Two distinct feature extraction techniques were
applied to characterize the EEG signal segments:
Discrete Wavelet Transform (DWT) and Power
Spectral Density (PSD) analysis. Both approaches
aim to quantify the essential temporal and spectral
properties of the EEG signals by generating 10-
dimensional feature vectors for each segment.
2.3.1 Discrete Wavelet Transform Features
Discrete Wavelet Transform (DWT) provides a
multiresolution time-frequency analysis of the EEG
signals, effectively capturing both low and high
frequency components (Almahdi et al., 2021, Subekti
et al., 2024). In this study, each EEG segment was
decomposed into four levels using the Daubechies 4
(db4) mother wavelet. From the resulting
approximation and detail coefficients, the following
10 statistical features were extracted to form the
DWT-based feature vector:
D
1
: Mean of the approximation coefficients at
level 4.
D
2
: Standard deviation of the approximation
coefficients at level 4.
D
3
: Mean of the detail coefficients at level 4.
D
4
: Standard deviation of the detail coefficients
at level 4.
D
5
: Mean of the detail coefficients at level 3.
D
6
: Standard deviation of the detail coefficients
at level 3.
D
7
: Mean of the detail coefficients at level 2.
D
8
: Standard deviation of the detail coefficients
at level 2.
D
9
: Mean of the detail coefficients at level 1.
D
10
: Standard deviation of the detail
coefficients at level 1.
These features collectively capture signal energy
distribution, variability, and frequency content across
multiple scales, which are essential for distinguishing
seizure activity from normal brain signals.
2.3.2 Power Spectral Density Features
To characterize the frequency-domain properties of
the EEG segments, the Welch method was applied to
estimate the PSD of each segment and its
corresponding reference signal. Based on the PSD
distributions, the following 10 features were
calculated to construct the PSD-based feature vector:
P
1
: Kullback-Leibler divergence between the
segment PSD and the reference PSD.
P
2
: L2-norm (Euclidean distance) between the
segment PSD and the reference PSD.
P
3
: Difference in total spectral power between
the segment and reference PSD.
P
4
: Difference in spectral entropy between the
segment and reference PSD.
P
5
: Difference in spectral flatness between the
segment and reference PSD.
P
6
: Difference in spectral bandwidth between
the segment and reference PSD.
P
7
: Frequency corresponding to the maximum
power in the segment PSD.
P
8
: Median frequency of the segment PSD.
P
9
: Variance of the segment PSD.
P
10
: Maximum absolute difference between the
segment PSD and the reference PSD.
These features collectively reflect both absolute
and relative spectral characteristics, providing a
robust representation of the signal’s frequency
content and its deviation from baseline patterns
(Ikizler and Ekim, 2025a, Ikizler and Ekim 2025b).
2.4 Classification and Performance
Evaluation
A Random Forest (RF) classifier was employed to
distinguish between different EEG classes based on
the extracted features. RF is an ensemble learning
method known for its robustness in overfitting and its
ability to handle high-dimensional, complex data
structures. Its use in EEG signal classification has
been well documented due to these advantages (Kode
et al., 2024, Kunekar et al., 2024).
The classification performance was assessed
using standard metrics, including accuracy and
precision, across both binary and multi-class
classification tasks. These metrics provide a reliable
indication of the model's ability to correctly identify
seizure-related activity and differentiate it from non-
seizure EEG patterns (Farawn et al., 2025).
All feature extraction, segmentation, and
classification procedures were implemented in
MATLAB within a fully automated framework,
Impact of Signal Segmentation on EEG-Based Seizure Detection: A Comparative Time-Frequency Analysis
307

ensuring consistency and reproducibility across all
experiments. To ensure a reliable and unbiased
evaluation of the proposed classification framework,
a 10-fold cross-validation strategy was adopted in all
experiments. In this approach, the dataset was
randomly partitioned into 10 equal-sized folds, with
each fold serving as a test set exactly once while the
remaining nine folds were used for training. This
process was repeated iteratively to guarantee that all
data samples contributed to both training and testing,
providing a comprehensive estimate of the model's
generalization ability. The reported accuracy and
precision results represent the average performance
across all 10 folds.
3 RESULTS
In this study, the publicly available EEG dataset
provided by the University of Bonn was utilized to
evaluate the impact of data segmentation on the
classification performance of epileptic seizure
detection. The dataset consists of five distinct classes
(A, B, C, D and E), containing both healthy and
epileptic EEG recordings. Various binary and multi-
class classification tasks were designed by combining
different subsets of these classes to comprehensively
assess the system's effectiveness.
All experimental procedures, including signal
preprocessing, segmentation, feature extraction,
classification, and performance evaluation, were
implemented entirely in a MATLAB environment
using a custom-developed program. This program
was designed to perform the entire experimental
workflow in a fully automated manner, ensuring
consistency and repeatability across all tests.
In the experimental setup, the effect of signal
segmentation was investigated by dividing each EEG
recording into 1, 2, 4, 8, and 16 equal-length
segments. Two widely used feature extraction
techniques were employed separately for each
scenario: DWT and PSD. The extracted features were
subsequently classified using a Random Forest
algorithm, which has been shown to be effective for
EEG based classification tasks due to their robustness
and ensemble learning capabilities.
For each segmentation level and classification
task, both accuracy and precision metrics were
calculated to evaluate the system's performance. The
entire set of experiments, covering 16 different
classification tasks and five segmentation levels for
both DWT and PSD-based feature sets, was
conducted on a personal computer equipped with an
Intel 12th Generation i5 processor and 16 GB of
RAM, running a standard Windows 11 operating
system. The computational environment provided
sufficient processing power to efficiently handle the
relatively large number of experiments without
introducing hardware-related performance
limitations.
The following sections present detailed
experimental results, including quantitative tables
and visual analyses, to reveal the effect of
segmentation on classification accuracy for both
feature extraction approaches.
The effect of data segmentation on the
classification performance was systematically
evaluated using both DWT-based, and PSD-based
feature extraction approaches combined with
Random Forest classification. The detailed results for
each classification task and segmentation level are
presented in Table 1 (DWT) and Table 2 (PSD),
respectively.
In general, increasing the number of segments
applied to the EEG recordings leads to noticeable
changes in classification accuracy. This effect is
evident across both feature extraction strategies,
though with slight differences in magnitude and
behaviour depending on the method.
For the DWT-based feature extraction, the
segmentation process initially contributes positively
to classification performance. Specifically,
segmenting the signals into 2 and 4 parts often results
in improved accuracy compared to the non-
segmented scenario, particularly for complex
classification tasks such as multi-class problems (e.g.,
A-B-C, A-B-C-D-E). However, excessive
segmentation (i.e., 16 segments) tends to degrade
performance, especially in binary tasks such as A-B
and A-C, where a decline in accuracy is observed.
This suggests that excessive division of signals may
disrupt the temporal structure and statistical
characteristics captured by the DWT, negatively
impacting the representational power of the extracted
features.
On the other hand, the PSD-based feature
extraction exhibits a more consistent and stable
improvement trend with increasing segment count. In
particular, the classification accuracy for difficult
tasks such as C-D, C-D-E, and A-B-C-D-E shows
substantial gains as the number of segments
increases. Notably, even at 16 segments, no severe
performance degradation is observed, indicating that
PSD features can benefit from finer temporal
resolution without sacrificing signal integrity. This
can be attributed to the frequency-domain nature of
PSD, which allows for effective characterization of
spectral content even in short signal segments.
ICEEECS 2025 - International Conference on Advances in Electrical, Electronics, Energy, and Computer Sciences
308

When comparing the two methods, it is evident
that while both DWT and PSD benefit from moderate
segmentation (2 to 4 segments), PSD-based features
demonstrate greater robustness to higher
segmentation levels, particularly in multi-class and
challenging binary classification scenarios. In
contrast, the DWT-based approach appears to be
more sensitive to over-segmentation, emphasizing the
need to carefully select the segmentation parameter
based on the chosen feature extraction method.
Overall, these results highlight the critical role of
segmentation in optimizing the classification
performance of EEG signals, as well as the interaction
between segmentation strategy and feature
representation. The findings suggest that an optimal
segmentation level exists that maximizes
classification accuracy, and that this optimum may
vary depending on the feature extraction technique
applied.
In addition to the tabular results, Figures 2 and 3
visually illustrate the impact of data segmentation on
the mean classification accuracy across all 16 tasks
for both DWT-based and PSD-based feature
extraction methods, respectively.
Table 1: Classification performance (Accuracy and Precision) of Random Forest for different segment counts and
classification tasks using DWT-based features.
Tasks Metric
DWT-
b
ase
d
Feature Vecto
r
1 segment 2 segment 4 segment 8 segment 16 segment
A-E
Accurac
y
% 99,50 99,50 100,0 100,0 99,78
Precision % 99,55 99,52 100,0 100,0 99,78
A-D
Accurac
y
% 96,50 97,25 97,75 96,69 94,34
Precision % 96,89 97,38 97,79 96,74 94,36
A-C
Accuracy % 98,50 97,75 98,12 97,12 94,75
Precision % 98,64 97,85 98,16 97,17 94,79
A-B
Accurac
y
% 92,00 93,75 92,63 91,75 89,41
Precision % 92,72 94,01 92,80 91,80 89,49
C-D
Accuracy % 68,00 76,50 77,75 77,25 74,97
Precision % 68,95 77,20 78,11 77,34 75,03
C-E
Accuracy % 97,50 98,25 98,37 98,81 98,53
Precision % 97,88 98,38 98,42 98,82 98,54
B-E
Accurac
y
% 97,50 98,75 99,12 98,25 97,84
Precision % 97,94 98,79 99,15 98,26 97,86
B-C
Accuracy % 97,50 97,50 98,38 98,31 96,97
Precision % 97,73 97,61 98,40 98,35 96,99
B-D
Accurac
y
% 97,00 98,75 98,00 98,06 97,03
Precision % 97,35 98,83 98,04 98,11 97,05
A-B-C
Accurac
y
% 92,67 93,83 93,17 92,04 88,67
Precision % 93,23 94,11 93,30 92,18 88,74
A-B-D
Accuracy % 93,00 92,67 93,42 91,58 88,71
Precision % 93,69 93,19 93,69 91,76 88,86
A-B-E
Accurac
y
% 94,33 94,83 94,08 93,25 91,40
Precision % 94,78 95,07 94,29 93,31 91,48
C-D-E
Accurac
y
% 73,33 81,83 83,92 83,29 81,33
Precision % 73,29 82,13 84,08 83,29 81,21
A-B-C-E
Accuracy % 94,00 94,25 94,38 93,03 89,97
Precision % 94,71 94,51 94,56 93,14 90,05
A-B-C-D
Accurac
y
% 78,50 82,38 83,69 82,16 77,73
Precision % 79,08 82,72 83,97 82,20 77,74
A-B-C-D-E
Accuracy % 82,40 84,60 85,60 84,22 79,96
Precision % 82,80 84,63 85,76 84,16 79,86
Impact of Signal Segmentation on EEG-Based Seizure Detection: A Comparative Time-Frequency Analysis
309

Table 2: Classification performance (Accuracy and Precision) of Random Forest for different segment counts and
classification tasks using PSD-based features.
Tasks Metric
PSD-
b
ase
d
Feature Vecto
r
1 segment 2 segment 4 segment 8 segment 16 segment
A-E
Accuracy % 100,0 99,75 99,75 99,94 99,88
Precision % 100,0 99,76 99,76 99,94 99,88
A-D
Accurac
y
% 99,00 99,25 98,62 97,88 96,37
Precision % 99,09 99,29 98,65 97,89 96,42
A-C
Accuracy % 96,50 98,50 96,62 96,62 93,88
Precision % 96,88 98,55 96,73 96,65 93,92
A-B
Accuracy % 91,50 92,75 91,88 95,63 96,56
Precision % 91,97 93,17 92,05 95,64 96,60
C-D
Accurac
y
% 83,00 92,75 87,75 90,00 90,75
Precision % 83,91 93,06 87,90 90,10 90,81
C-E
Accuracy % 98,50 99,50 99,63 99,94 99,88
Precision % 98,55 99,50 99,63 99,94 99,88
B-E
Accurac
y
% 98,50 99,00 99,88 99,88 99,62
Precision % 98,64 99,09 99,88 99,88 99,63
B-C
Accurac
y
% 97,50 98,75 98,62 99,31 97,94
Precision % 97,63 98,83 98,66 99,32 97,95
B-D
Accuracy % 99,00 99,75 99,12 98,64 98,06
Precision % 99,09 99,76 99,16 98,96 98,08
A-B-C
Accurac
y
% 91,33 95,33 93,25 95,21 93,50
Precision % 92,65 95,64 93,42 95,29 93,53
A-B-D
Accuracy % 94,67 94,50 93,75 95,52 94,62
Precision % 95,01 94,71 93,93 95,44 94,68
A-B-E
Accuracy % 94,33 95,50 94,92 97,25 97,52
Precision % 94,78 95,74 95,03 97,27 97,54
C-D-E
Accurac
y
% 87,33 93,00 91,17 93,08 93,23
Precision % 88,34 93,16 91,49 93,09 93,25
A-B-C-E
Accuracy % 93,25 95,88 94,37 96,12 95,00
Precision % 93,63 96,50 94,46 96,19 95,02
A-B-C-D
Accuracy % 86,00 92,50 88,75 90,66 89,73
Precision % 86,39 92,76 88,96 90,72 89,78
A-B-C-D-E
Accurac
y
% 87,20 93,00 90,15 92,33 91,36
Precision % 88,11 93,37 90,30 92,39 91,39
Figure 2: The effect of the number of segments on the mean
classification accuracy across 16 classification tasks using
Random Forest and DWT-based features.
Figure 3: The effect of the number of segments on the mean
classification accuracy across 16 classification tasks using
Random Forest and PSD-based features.
12 4 8 16
Number of Segments
65
70
75
80
85
90
95
100
12 4 8 16
Number of Segments
60
65
70
75
80
85
90
95
100
ICEEECS 2025 - International Conference on Advances in Electrical, Electronics, Energy, and Computer Sciences
310

As observed in Figure 2, the DWT-based
approach exhibits a characteristic trend where the
mean accuracy initially improves with segmentation
but shows a gradual decline beyond a certain point.
Specifically, segmenting the EEG signals into two
parts yields a noticeable improvement in overall
accuracy, suggesting that limited segmentation helps
capture localized temporal patterns more effectively.
However, as the number of segments increases
beyond four, the mean accuracy begins to deteriorate.
This indicates that excessive segmentation may
fragment the temporal structure of the signal,
reducing the ability of the DWT to extract meaningful
features, especially for complex classification tasks.
In contrast, Figure 3 demonstrates a more stable
behaviour for the PSD-based approach. Although
slight fluctuations are present, the mean accuracy
remains consistently high across different
segmentation levels, with the best performance
generally achieved between two and eight segments.
This suggests that the PSD method, being inherently
focused on frequency domain information, is less
sensitive to signal segmentation and can maintain
high classification performance even with finer
temporal resolution. Furthermore, the relatively flat
accuracy curve indicates that PSD-based features are
more robust to variations in the segmentation
parameter compared to DWT-based features.
These graphical results confirm that while
segmentation is a valuable strategy for enhancing
classification performance, its optimal configuration
depends significantly on the chosen feature extraction
method. The DWT method benefits from moderate
segmentation but is more vulnerable to over-
segmentation, whereas the PSD approach
demonstrates greater resilience across a wider range
of segmentation levels.
4 DISCUSSION
The results of this study provide important evidence
regarding how the segmentation strategy directly
shapes the performance of seizure detection systems
utilizing EEG signals. While the technical aspects of
the experimental design are described earlier, it is
crucial to emphasize the broader implications of the
observed trends.
The most striking finding is the clear dependence
of classification success on the interplay between
segmentation and feature extraction technique. The
DWT-based method exhibited notable sensitivity to
the segmentation parameter. Moderate segmentation
levels contributed positively by enhancing the
system's ability to capture transient patterns
characteristic of epileptic seizures. However,
excessive segmentation led to performance
degradation, highlighting a potential trade-off
between temporal resolution and the preservation of
signal integrity.
On the other hand, the PSD-based approach
demonstrated greater stability across different
segmentation levels. The ability to extract consistent
spectral information even from short signal segments
explains the more gradual variations in classification
accuracy observed in this method. This robustness
makes PSD-based features particularly attractive for
real-time seizure detection applications, where short
analysis windows and rapid decision-making are
required.
These findings carry direct implications for
practical, clinically oriented EEG monitoring
systems. Particularly in portable or continuous
monitoring setups, signal segmentation becomes
inevitable due to hardware limitations, memory
constraints, or the need for prompt seizure detection.
The results suggest that careful selection of
segmentation parameters, aligned with the
characteristics of the chosen feature extraction
approach, can maximize detection reliability without
sacrificing system efficiency.
Furthermore, the observed differences between
DWT and PSD approaches highlight that there is no
universal segmentation strategy suitable for all signal
processing pipelines. Instead, a task-specific
optimization process is required, especially for
systems intended for deployment in critical care
environments where false positives or delayed
detections may have severe consequences.
5 CONCLUSIONS
This study provides a comprehensive analysis of how
EEG signal segmentation influences seizure detection
performance, offering valuable insights for the
development of reliable, real-world clinical decision
support systems.
The findings demonstrate that segmentation is not
merely a technical preprocessing step but a decisive
factor that interacts with the feature extraction
strategy to shape classification success. Moderate
segmentation enhances performance, particularly for
methods that exploit time-frequency characteristics,
such as DWT. Meanwhile, PSD-based approaches
offer greater flexibility and resilience to
segmentation, making them promising candidates for
continuous, real-time monitoring scenarios.
Impact of Signal Segmentation on EEG-Based Seizure Detection: A Comparative Time-Frequency Analysis
311

These insights lay the groundwork for future
research directions. Moving forward, extending the
analysis to more heterogeneous and clinically
realistic EEG datasets is essential to validate these
findings under practical conditions. Furthermore,
incorporating advanced deep learning architectures
capable of learning optimal segmentation schemes
adaptively, rather than relying on fixed segment
counts, may yield further improvements in both
accuracy and system efficiency.
In addition, future work should investigate the
trade-offs between segmentation, classification
performance, and computational cost to ensure that
proposed methods are not only effective but also
suitable for deployment in low-power, wearable, or
mobile seizure detection platforms. Ultimately, this
line of research contributes to the development of
more accessible, accurate, and patient-friendly
solutions for epilepsy monitoring and management.
REFERENCES
Almahdi, A. J., Yaseen, A. J., & Dakhil, A. F. (2021). EEG
signals analysis for epileptic seizure detection using
DWT method with SVM and KNN classifiers. Iraqi
Journal of Science, 54-62.
Andrzejak, R. G., Lehnertz, K., Mormann, F., Rieke, C.,
David, P., & Elger, C. E. (2001). Indications of
nonlinear deterministic and finite-dimensional
structures in time series of brain electrical activity:
Dependence on recording region and brain state.
Physical Review E, 64(6), 061907.
Al Farawn, A., Al-Khammasi, S., Alhilali, A. H., & Ali, N.
S. (2025). EEG Feature Selection Techniques for
Epileptic Seizure Detection: Performance and
Evaluation Study. International Journal of
Mathematics, Statistics, and Computer Science, 3, 345-
358.
Ikizler, N., & Ekim, G. (2025a). High-Resolution Power
Spectral Density Approaches for Epileptic Seizure
Detection. Politeknik Dergisi, vol. 1, no. 1.
Ikizler, N., & Ekim, G. (2025b). Investigating the effects of
Gaussian noise on epileptic seizure detection: The role
of spectral flatness, bandwidth, and entropy.
Engineering Science and Technology, an International
Journal, 64, 102005.
Kınacı, E. B., H. Bal, and H. Kınacı., (2024). A Novel
Support Regression-Based Classification Approach for
Epileptic Seizure Detection. Politeknik Dergisi, vol. 27,
no. 2, pp. 587-601.
Kode, H., Elleithy, K., & Almazedah, L. (2024). Epileptic
Seizure detection in EEG signals using Machine
Learning and Deep Learning Techniques. IEEE Access.
Kunekar, P., Kumawat, C., Lande, V., Lokhande, S.,
Mandhana, R., & Kshirsagar, M. (2024). Comparison
of different machine learning algorithms to classify
epilepsy seizure from EEG signals. Engineering
Proceedings, 59(1), 166.
Liu, S., et al. (2023). Epileptic Seizure Detection and
Prediction in EEGs Using Power Spectra Density
Parameterization.” IEEE Transactions on Neural
Systems and Rehabilitation Engineering, vol. 31, pp.
3884-3894.
Milligan, T. A. (2021). Epilepsy: A Clinical Overview. The
American Journal of Medicine, vol. 134, no. 7, pp. 840-
847.
Naidu, G., T. Zuva, & E. M. Sibanda. (2023). A Review of
Evaluation Metrics in Machine Learning Algorithms. In
Computer Science On-Line Conference, Springer
International Publishing, pp. 15-25.
Siddiqui, M. K., et al. (2021). A Review of Epileptic
Seizure Detection Using Machine Learning Classifiers.
Brain Informatics, vol. 7, no. 1, p. 5.
Subekti, S., Indriyanto, S., Rizal, A., Triwiyanto, T., &
Ziani, S. (2024, September). Epileptic Seizure
Detection using DWT-based on MRMR Feature
Selection Method. In 2024 International Conference on
Electrical and Information Technology (IEIT) (pp. 84-
89). IEEE.
Thangavel, P., Thomas, J., Sinha, N., Peh, W. Y., Yuvaraj,
R., Cash, S. S., & Dauwels, J. (2022). Improving
automated diagnosis of epilepsy from EEGs beyond
IEDs. Journal of neural engineering, 19(6), 066017.
World Health Organization (WHO). Accessed 26.05.2025,
https://www.who.int/news-room/fact-
sheets/detail/epilepsy
Zhou, X., Liu, C., Yang, R., Zhang, L., Zhai, L., Jia, Z., &
Liu, Y. (2024). Learning robust global-local
representation from EEG for neural epilepsy detection.
IEEE Transactions on Artificial Intelligence.
ICEEECS 2025 - International Conference on Advances in Electrical, Electronics, Energy, and Computer Sciences
312
