
Enhancing Lontara Script Handwritten Recognition with Zoning and
Convolutional Neural Networks
Sri Wulan Dari
1
, Zahir Zainuddin
1
, Mukarramah Yusuf
1
and Herviana
2
1
Department of Informatics, Hasanuddin University, Gowa, Indonesia
2
Department of Electrical Engineering, Korea National University of Transportation, Chungju, Republic of Korea
Keywords: Handwriting, Artificial Neural Network, Lontara Script, Zoning, CNN.
Abstract: This paper addresses the challenge of improving handwritten recognition of Lontara script, particularly for 23
characters and an additional 5 characters with the O diacritic. Recognition errors often occur due to the high
visual similarity between characters and the diversity in handwriting styles, which remain significant barriers
in the existing literature. Despite advances with contour-based features and sliding window methods,
confusion between visually similar characters such as 'Ta' and the diacritic 'O' remains unresolved. To fill this
gap, this study introduces an integrated approach that combines Zoning for enhanced feature extraction with
Convolutional Neural Networks (CNN) for classification. The proposed method overcomes these challenges
by capturing distinct localized features, which are crucial for accurate recognition, improving the
classification accuracy by 21%. This improvement significantly enhances the model's ability to differentiate
similar characters, thus contributing to more reliable handwritten Lontara character recognition.
1 INTRODUCTION
Even though the world has shifted to the digital age,
there are still some situations where the use of paper
and pen is unavoidable. Character recognition systems
can be used to read both typed text and
handwriting(Alrobah and Albahli 2021). The
automated recognition of handwriting is a complex
task due to the inherent variability of handwriting
style, as well as the diverse character set and extensive
vocabulary in different languages (V. Jayanthi 2023).
The visual similarity between character shapes and the
limited availability of high-quality training datasets
remain significant barriers to achieving high accuracy
in handwritten word recognition (Chithambaramani et
al. 2023). Handwriting recognition still imposes a
challenge due to the uniqueness of how each person
writes a character, unlike printed documents, where
characters are well defined and standardized (Diaz,
Vicerra, and Bandala 2021). This challenge is even
greater for Lontara script - a traditional writing system
indigenous to Bugis and Makassar ethnic of Sulawesi,
Indonesia. Research on object recognition in images is
very interesting on the topic of computer vision.
Various methods are proposed to perform object
recognition, such as machine learning or deep learning
to perform object classification (Susanto et al. 2021).
Although previous contour-base features and
sliding window methods have demonstrated
considerable success in Lontara manuscript
recognition, a persistence challenge remains in
distinguishing visually similar characters, especially
a frequent confusion between the character “Ta” and
the diacritic “O” (Hidayat, Nurtanio, and Tahir 2019).
To address this challenge, the authors proposed an
integrated method combining the zoning feature
extraction with Convolutional Neural Network-based
classification. The zoning technique divides the
character image into small zones or regions to capture
local information. This approach allows the model to
capture distinctiveness and localized features that
might be lost in general analysis. These extracted
features subsequently form the feature vector for a
CNN. Through this process, CNN is trained to
distinguish nuanced visual patterns, resulting in
improved classification accuracy.
2 PROPOSED METHOD
This section is divided into two parts. The first covers
the preprocessing process including data collection,
preparation, and division. The second part explains the
84
Dari, S. W., Zainuddin, Z., Yusuf, M. and Herviana,
Enhancing Lontara Script Handwritten Recognition with Zoning and Convolutional Neural Networks.
DOI: 10.5220/0014276400004928
Paper published under CC license (CC BY-NC-ND 4.0)
In Proceedings of the 1st International Conference on Research and Innovations in Information and Engineering Technology (RITECH 2025), pages 84-89
ISBN: 978-989-758-784-9
Proceedings Copyright © 2025 by SCITEPRESS – Science and Technology Publications, Lda.
research method, integrated zoning for feature
extraction and CNN architecture for classification
model.
2.1 Preprocessing Stage
2.1.1 Data Collection
This study utilized a dataset of handwritten Lontara
script collected from computer science students and
high school students. To capture a natural writing
style, the samples were first written on paper. These
documents were then documented using a high-
resolution smartphone camera to guarantee every
detail of the script was clear. To train a more
adaptable model, we expand the variety of dataset
through image augmentation.
2.1.2 Data Preparation
The data preparation consists of three key stages:
resizing, image augmentation, and normalization.
These steps are designed to standardize the input and
improve training efficiency.
-Resizing
All images are resized to standardized dimensions of
128x128 pixels. This ensures the uniformity input for
the model, simplifies computational processing, and
accelerates training time without reducing the clarity
of character details.
- Image Augmentation
To improve the model's robustness to diverse
handwriting styles, real-time image augmentation
was applied during training. This technique
artificially introduces variation into each data batch
without permanently expanding the original dataset,
which is an effective strategy for reducing overfitting
(Gadhiya et al. 2023). The following transformations
were randomly applied:
- Rotation: A range of ±10 degrees to simulate
variations in page orientation
- Shifting: Horizontal and vertical shifts to
mimic differences in character positioning.
- Shearing: A range of ±20% to distort
characters slightly, simulating natural
variations in writing shape.
- Zooming: A range of ±20% to account for
differences in character size.
- Flipping: Horizontal flipping to further
increase data variety.
By exposing the model to these synthetic variations at
each training step, we significantly improve its ability
to generalize to unseen handwriting samples.
- Normalization
Finally, the pixel values are normalized from their
original range [0, 255] to the scale range [0, 1]. This
crucial step stabilizes the training process by ensuring
all input features are at a consistent scale, resulting in
faster convergence and improved model
performance.
2.1.3 Split Data
The dataset is divided into training and testing data
with a standard 70:30 ratio. The division was
performed randomly using the train_test_split
function from the scikit-learn library, ensuring the
proportion representative of each class was
maintained in both sets through stratification. This
methodology ensures the model can learn effectively
from training data while also allowing for rigorous
assessment of its performance on stored examples.
This is crucial for verifying the model's ability to
generalize to new, previously unseen data.
The complete dataset consists of 2,800 images
across 28 classes. It includes 23 standard Lontara
scripts and 5 scripts featuring the "O diacritic." After
a 70:30 split, the training set contains 1,960 images,
and the test set contains 840 images. This strategy
aligns with established practice in the field, where
larger training sets and sophisticated network
architectures are recognized as key factors in
developing robust recognition systems (Aljarrah,
Zyout, and Duwairi 2021).
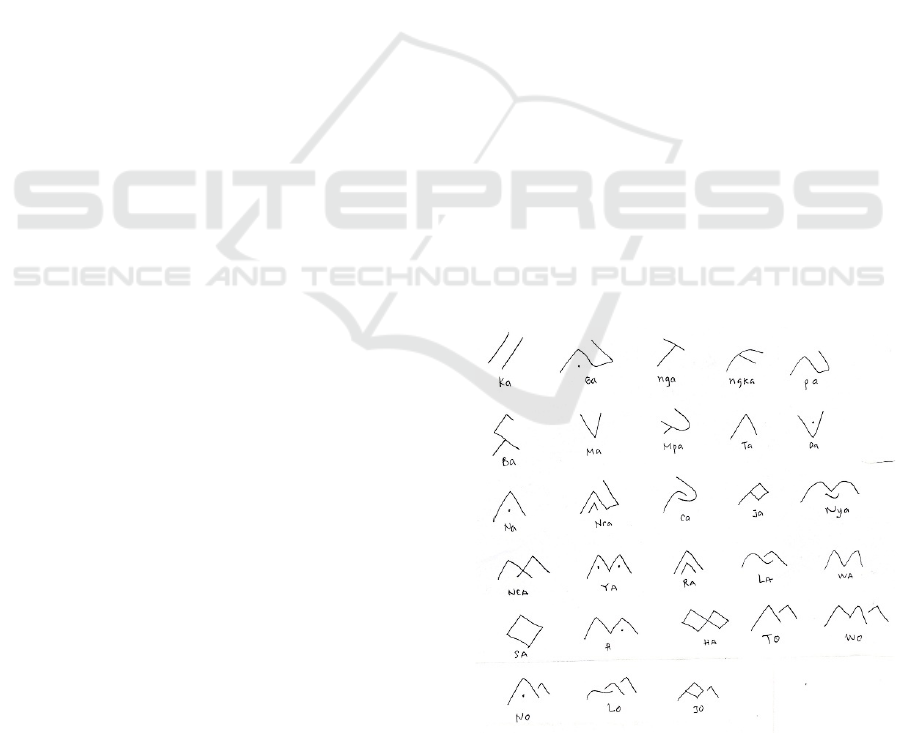
For a detailed visual representation of a
handwriting example, see Figure 1.
Figure 1: Twenty-three lontara characters plus five
characters using diacritics.
Enhancing Lontara Script Handwritten Recognition with Zoning and Convolutional Neural Networks
85
2.2 Method
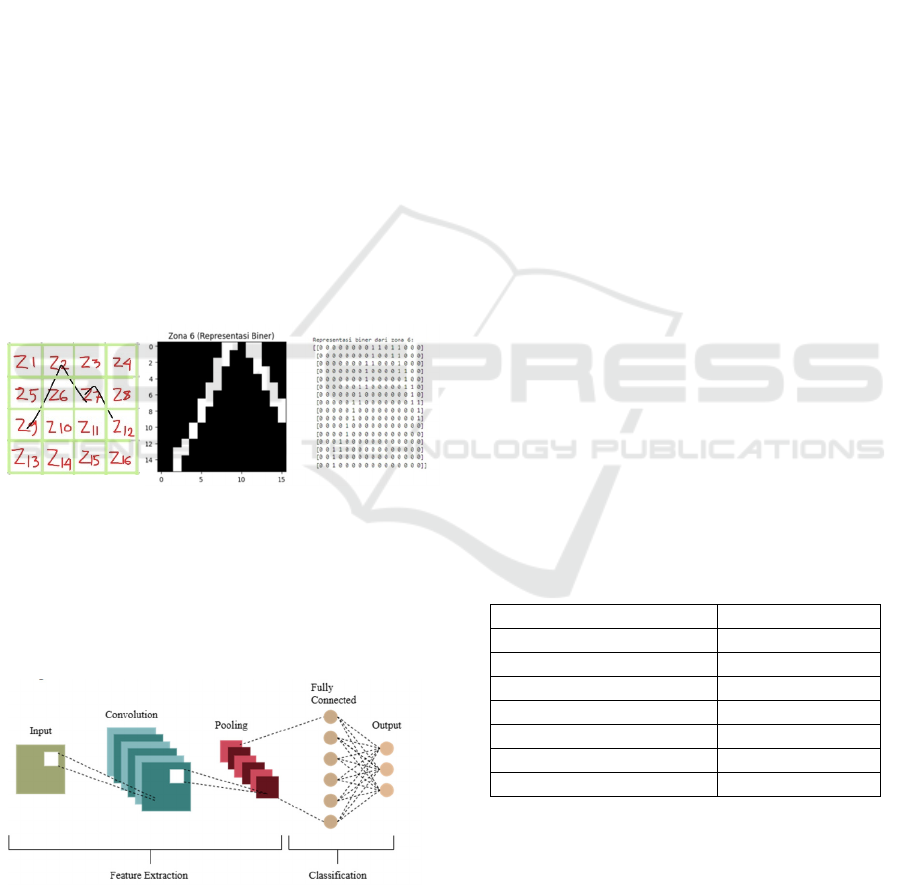
2.2.1 Zoning
In image-based machine learning, feature extraction
is a fundamental step for enabling models to
distinguish visual class. Features represent distinctive
patterns or signatures in an image that characterize its
content (Wahid, Shahriar, and Sobuj 2021).
Zoning is used as a feature extraction method that
divides the character image into a grid of smaller,
localized zones (Shahzad et al. 2023). The zoning
process of a Lontara script illustrated in Figure 2.
Figure 2(a) shows the character 'Ta' divided into a 4x4
grid, creating 16 distinct zones from z1 to z16. Figure
2(b) provides a close-up view of one of these zones
(labeled z6), demonstrating how the stroke is
converted into a binary representation of white pixels
(1) and black pixels (0) while the Figure 2(c) shows
the feature vector a structured list of numbers (a
matrix of 0s and 1s) that summarizes the ink density
and pattern in each zone of the original image. This
vector serves as the primary input for a machine
learning model, allowing it to accurately classify the
character based on these local characteristics.
Figure 2: Zoning process of a Lontara script.
2.2.2 Convolutional Neural Network (CNN)
CNNs have become crucial in a wide range of
applications, including image classification, text
detection, object tracking, and handwriting
recognition (Valenzuela et al. 2020).
Figure 3: CNN architecture.
The CNN architecture has two main components,
feature learning or maps and classification (Warman
and Kusuma 2023). One definition is that deep
learning uses layers to gradually extract high-level
features from raw input (Aljarrah et al. 2021). The
resulting data is then flattened into a feature vector
and processed by a fully-connected layer, which
performs classification to produce the final output.
CNN is a specialized algorithm of Deep Learning
for classification problems. CNN has separate
modules for feature extraction and classification. The
data input for CNN first goes through a convolutional
layer, which consists of several filters to extract
features from the data. Basically, the network
employs a mathematical operation called convolution
at this layer. Convolution is a specialized kind of
linear operation that is used to perform matrix
calculation (multiplication). Then the data is
forwarded to the pooling layer, which downgrades the
data while keeping necessary information. After that,
the 2D data is converted into a 1D array, called
flattening. The flattened data further goes to a fully-
connected layer and SoftMax for classification, as
shown in Figure 3 (Sharma, Sharma, and Purohit
2021).
2.2.3 Model Creation
In developing the model, researchers used a
combination of zoning and CNN for Lontara
configuration used in training the model. This table
includes several important parameters that affect
model performance, such as kernel size,
hyperparameters, optimizer, and learning rate. The
selection of values for each of these parameters plays
an important role in optimizing the results obtained
during the training process.
Table 1: Training configuration.
Paramete
r
Value
Filter size 32, 64, 128, 256
N
umber of la
y
ers 12
Activation Function ReLu
Kernel size (3,3)
Optimize
r
Ada
m
Learnin
g
Rate 0.001
N
umber of la
y
e
r
12
2.2.4 Performa Evaluation
To evaluate the performance of the proposed CNN-
based handwritten Lontara script classification
model, we employed two key metrics: accuracy and
the confusion matrix. Accuracy was used to measure
the overall correctness of the model’s predictions by
comparing the number of correctly classified samples
RITECH 2025 - The International Conference on Research and Innovations in Information and Engineering Technology
86
to the total number of samples. This metric provides
a straightforward indication of the model's
effectiveness in recognizing the Lontara characters
(Pratama, Nurtanio, and Paundu 2024).
To evaluate the model's performance in
recognizing Lontara handwriting, a confusion matrix
was used to provide a detailed overview of the
prediction accuracy rate, classification error
distribution, and model performance for each
character class (Ullah et al. 2023). The matrix
presents the distribution of true positives, false
positives, true negatives, and false negatives,
allowing us to identify specific classes that were
frequently misclassified and to assess the model's
strengths and weaknesses across all categories.
3 RESULT AND DISCUSSION
Image augmentation was applied to artificially
increase the variety of the training dataset by applying
several transformations to the original images,
including rotation, inversion, and scaling. A total of
50 epochs were used during training, enhancing the
model's robustness to different handwriting
variations. Normalization played a crucial role in this
study by scaling the image pixel values to a range
between 0 and 1. This step facilitated the learning
process by the model, accelerating the training speed
and improving the stability of the model.
Normalization enabled the CNN to focus on essential
features without being influenced by large pixel value
differences. Furthermore, normalization helped
prevent common training issues, such as exploding or
vanishing gradients, ensuring that the model could
effectively capture complex patterns and perform
well in recognizing new, unseen data.
CNN is employed for feature extraction and
classification, capturing deeper spatial features such
as edges, textures, and stroke variations. The results
show that CNN is the most optimal machine-learning
technique.
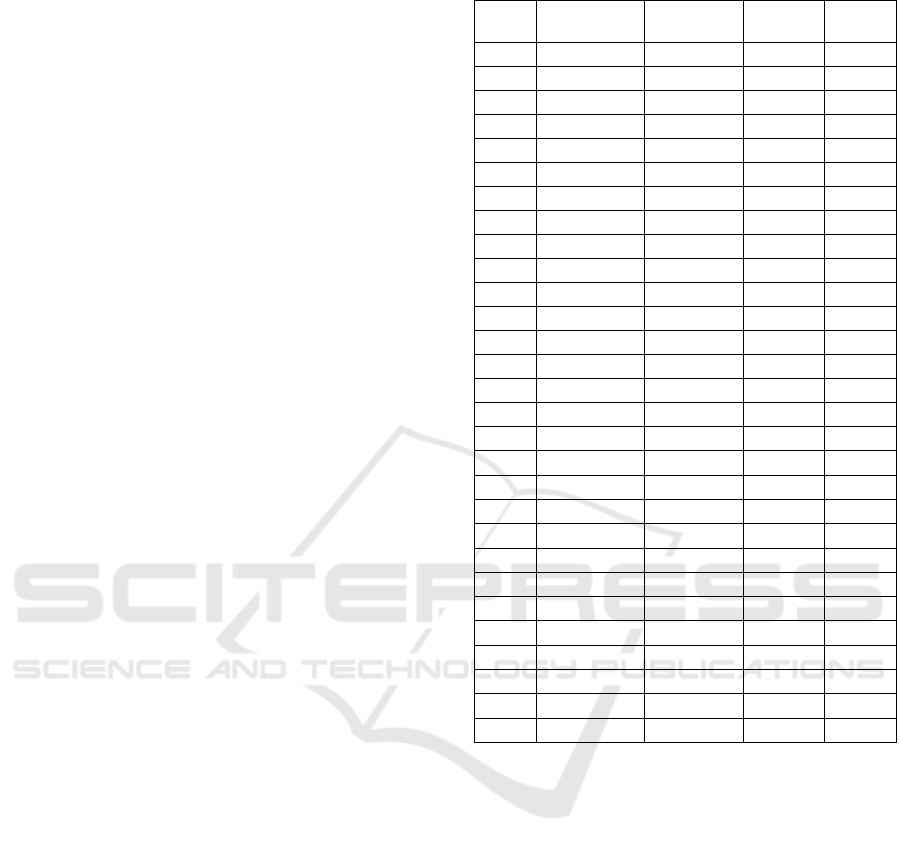
Table 2 shows the accuracy results of the Lontara
character recognition system evaluation. The CNN
method proposed in this study has demonstrated high
accuracy in recognizing variations in Lontara
handwriting. CNN effectively learns spatial features
and increasingly complex representations in the
network layers for classification.
Table 2: Test results for each class.
Class
Accuracy
(%)
Precision Recall F1-Score
A 100.00% 0.7812 1.0000 0.8772
Ba 96.15% 1.0000 0.9615 0.9804
Ca 91.66% 0.9429 0.9167 0.9296
Da 95.65% 0.9565 0.9565 0.9565
Ga 100.00% 1.0000 1.0000 1.0000
Ha 93.10% 0.9310 0.9310 0.9310
Ja 100.00% 0.9667 1.0000 0.9831
Jo 100.00% 1.0000 1.0000 1.0000
Ka 100.00% 0.9615 1.0000 0.9804
La 88.88% 0.8889 0.8889 0.8889
Lo 100.00% 1.0000 1.0000 1.0000
Ma 92.85% 0.9630 0.9286 0.9455
Mpa 93.75% 0.9375 0.8824 0.9091
Na 100.00% 0.9722 1.0000 0.9859
Nca 100.00% 0.9688 1.0000 0.9841
Nga 93.33% 1.0000 0.9333 0.9655
Ngka 100.00% 0.9615 1.0000 0.9804
No 100.00% 1.0000 1.0000 1.0000
Nra 96.42% 0.9643 0.9643 0.9643
Nya 94.11% 0.9697 0.9412 0.9552
Pa 100.00% 1.0000 1.0000 1.0000
Ra 100.00% 0.9394 1.0000 0.9688
Sa 96.87% 1.0000 0.9688 0.9841
Ta 100.00% 0.8571 1.0000 0.9231
To 92.85% 1.0000 0.9286 0.9630
Wa 96.87% 0.9688 0.9688 0.9688
Wo 100.00% 1.0000 1.0000 1.0000
Ya 78.78% 1.0000 0.7879 0.8814
Total 96.19% 0.9619 0.9619 0.9619
A comparison between Hidayat's research (2019)
and our research (2025) shows significant differences
in methods and results as shown in Table 3. Hidayat's
research uses contour feature-based segmentation and
sliding windows, followed by character recognition
using a Convolutional Neural Network (CNN), with
an accuracy of 96%. However, this study had
difficulty distinguishing between very similar
characters, such as “Ta” and the diacritic “O”. Our
study integrates Zoning feature extraction techniques
with CNN, which divides images into small zones to
capture local features. This approach improves
recognition accuracy by 21%, reaching 96.19%, and
overcomes the segmentation problems faced by
Hidayat, particularly in distinguishing similar
characters.
Enhancing Lontara Script Handwritten Recognition with Zoning and Convolutional Neural Networks
87
Table 3: Comparison of handwriting detection studies using
deep learning architecture.
Aspect Hidayat's research Our Research
Title
Segmentation and
Recognition of
Handwritten
Lontara Characters
Usin
g
CNN
Enhancing
Lontara Script
Handwritten
Recognition with
Zonin
g
and CNN
Feature
Extraction
Contour features
and sliding window
for segmentation.
Zoning method
divides the image
into smaller
zones for
localized feature
extraction.
Model
CNN with 3
convolution layers
and 4 fully
connected layers.
CNN with
multiple filters
and layers,
enhanced by
zonin
g
.
Challenges
Issues with
segmenting
visually similar
characters (e.g.,
"Ta" and diacritic
"O").
Improved
recognition
accuracy by
addressing
segmentation
challenges like
"Ta" and "O"
confusion.
Result
Segmentation
accuracy and
classification
performed well, but
segmentation errors
occurred for similar
characters.
Enhanced model
accuracy by 21%
over previous
methods,
overcoming
confusion
between similar
characters.
Overall, our research offers a more effective
approach to Lontara character recognition, improving
accuracy and precision in recognizing handwriting
variations.
4 CONCLUSIONS
In this study, we tested a combination of Zoning and
CNN techniques, which have shown recognition
accuracy of up to 96.19%. As support, we have
compared our results with previous studies, namely
those by (Hidayat et al. 2019) particularly those
dealing with similar challenges in lontara character
recognition and handwriting character recognition in
general. Previous research results showed lower
accuracy due to difficulties in distinguishing
characters with very similar visualizations, such as
the character “Ta” and the diacritical mark “O.” The
accuracy obtained was 96% using CNN with
segmentation errors using the contour and sliding
window techniques, with an accuracy of 75%. We
expanded our dataset to include more writing style
variations, which we believe can improve recognition
results for these very similar characters.
REFERENCES
Aljarrah, Mohammed N., Mo’Ath M. Zyout, and Rehab
Duwairi. 2021. “Arabic Handwritten Characters
Recognition Using Convolutional Neural Network.”
2021 12th International Conference on Information
and Communication Systems, ICICS 2021 182–88.
doi:10.1109/ICICS52457.2021.9464596.
Alrobah, Naseem, and Saleh Albahli. 2021. “A Hybrid
Deep Model for Recognizing Arabic Handwritten
Characters.” IEEE Access 9:87058–69.
doi:10.1109/ACCESS.2021.3087647.
Chithambaramani, R., M. Sankar, P. Sivaprakash, D.
Marichamy, and S. Yazhinian. 2023. “Neural Network-
Based Handwritten Character Detection.” 2023
International Conference on System, Computation,
Automation and Networking, ICSCAN 2023 (November
2023). doi:10.1109/ICSCAN58655.2023.10395072.
Diaz, Julianne Alyson I., Ryan Rhay P. Vicerra, and Argel
A. Bandala. 2021. “Preprocessing Image Contouring
Optimization of Handwriting Recognition Using
Genetic Algorithm.” IEEE Region 10 Annual
International Conference, Proceedings/TENCON
2021-Decem:756–59.
doi:10.1109/TENCON54134.2021.9707400.
Gadhiya, Jeet, Anjali Khatik, Shruti Kodinariya, and Dipak
Ramoliya. 2023. “Classification of Regional Food
Using Pre-Trained Transfer Learning Models.” 7th
International Conference on Electronics,
Communication and Aerospace Technology, ICECA
2023 - Proceedings (Iceca):1237–41.
doi:10.1109/ICECA58529.2023.10395249.
Hidayat, Asri, Ingrid Nurtanio, and Zulkifli Tahir. 2019.
“Segmentation and Recognition of Handwritten
Lontara Characters Using Convolutional Neural
Network.” Pp. 157–61 in 2019 International
Conference on Information and Communications
Technology (ICOIACT). IEEE.
V. Jayanthi, S. Thenmalar. 2023. “Handwritten Word
Recognition of Various Languages: A Review.”
doi:10.1109/ICSCC59169.2023.10334936.
Pratama, Andi Ardiansyah, Ingrid Nurtanio, and Ady
Wahyudi Paundu. 2024. “Similarity Classification of
Indonesian Traditional Snack Using YOLOv8
Algorithm.” 2024 8th International Conference on
Information Technology, Information Systems and
Electrical Engineering, ICITISEE 2024 197–201.
doi:10.1109/ICITISEE63424.2024.10729986.
Shahzad, Taimur, Khalid Iqbal, Murad Ali Khan, Imran,
and Naeem Iqbal. 2023. “Role of Zoning in Facial
Expression Using Deep Learning.” IEEE Access (
Volume: 11). doi:10.1109/ACCESS.2023.3243850.
RITECH 2025 - The International Conference on Research and Innovations in Information and Engineering Technology
88

Sharma, Rupesh, Prashant Sharma, and Naresh Purohit.
2021. “A Novel Approach to Classify English
Handwritten Character Using Convolutional Neural
Networks.” 2021 4th International Conference on
Electrical, Computer and Communication
Technologies, ICECCT 2021.
doi:10.1109/ICECCT52121.2021.9616644.
Susanto, Ajib, Ibnu Utomo Wahyu Mulyono, Christy Atika
Sari, Eko Hari Rachmawanto, and De Rosal Ignatius
Moses Setiadi. 2021. “Javanese Script Recognition
Based on Metric, Eccentricity and Local Binary
Pattern.” Proceedings - 2021 International Seminar on
Application for Technology of Information and
Communication: IT Opportunities and Creativities for
Digital Innovation and Communication within Global
Pandemic, ISemantic 2021 118–21.
doi:10.1109/iSemantic52711.2021.9573232.
Ullah, Md Oli, Md Imran Nazir, Afsana Akter, Shakil
Ahmed Raju, and Md Shariar Rahman Oion. 2023.
“Dry Food Classification Using Hybrid Deep Transfer
Learning.” 2023 26th International Conference on
Computer and Information Technology, ICCIT 2023 1–
6. doi:10.1109/ICCIT60459.2023.10441650.
Valenzuela, Sergio E., Juan B. Calabrese, Josue Ortiz-
Medina, and Claudia N. Sanchez. 2020. “Convolutional
Neural Networks for Detection of Hand-Written
Drawings.” 2020 Ieee Andescon, Andescon 2020.
doi:10.1109/ANDESCON50619.2020.9272066.
Wahid, Md Ferdous, Md Fahim Shahriar, and Md Shohanur
Islam Sobuj. 2021. “A Classical Approach to
Handcrafted Feature Extraction Techniques for Bangla
Handwritten Digit Recognition.” Proceedings of
International Conference on Electronics,
Communications and Information Technology, ICECIT
2021 (September):14–16.
doi:10.1109/ICECIT54077.2021.9641406.
Warman, Galuh Putra, and Gede Putra Kusuma. 2023.
“Face Recognition for Smart Attendance System Using
Deep Learning.” Communications in Mathematical
Biology and Neuroscience 2023.
doi:10.28919/cmbn/7872.
Enhancing Lontara Script Handwritten Recognition with Zoning and Convolutional Neural Networks
89
