
Classification of Leaf Disease in Potato Plants Based on Color and
Texture Features Using the K Nearest Neighbor (KNN) Method
Andi Sri Bulan
a
and Ingrid Nurtanio
b
Department of Informatics Hasanuddin University Makassar, Indonesia
Keywords: Image Processing, Image Classification, KNN, Color and Texture Feature Extraction, Potato Leaf Disease.
Abstract: Potato (Solanum tuberosum) is an essential food commodity after rice and wheat, widely cultivated in
Indonesia’s highlands due to its high economic value. However, production is frequently threatened by leaf
diseases such as early blight (Alternaria Solani), late blight (Phytophthora infestans), leaf spot, mosaic virus
(PVY), leaf roll, blackleg, soft rot, fusarium wilt, bacterial wilt, and rhizoctonia canker. These diseases reduce
yield and quality, leading to economic losses. This study proposes a potato leaf disease classification system
by combining color and texture features with Principal Component Analysis (PCA) for dimensionality
reduction and K-Nearest Neighbor (KNN) as the classifier. The dataset consisted of 1,055 leaf images
collected from Malino, South Sulawesi, expanded through augmentation to 1,155 images across 12 classes
(healthy + 11 diseases). Preprocessing included resizing, color space conversion, and segmentation. The
optimized KNN model with PCA (k=1, PCA=14) achieved 97.78% accuracy on test data, outperforming
Support Vector Machine (SVM) and Random Forest. These results confirm that simple handcrafted features
with lightweight classifiers can achieve competitive performance compared to deep learning approaches,
making them suitable for mobile-based agricultural applications in resource-limited environments to support
early disease detection.
1 INTRODUCTION
Potatoes (Solanum tuberosum) are the third most
important food commodity after rice and wheat,
widely cultivated in the highlands of Indonesia (Y.
Alkhalifi et al., 2021). Despite their high economic
value, potato productivity often decreases due to
various leaf diseases that significantly reduce crop
quality and quantity (L.C.Ngugi et al., 2021).
Common potato leaf diseases include early blight
(Alternaria Solani), late blight (Phytophthora
infestans), leaf spot, mosaic virus (PVY), leaf roll,
blackleg, soft rot, Fusarium wilt, bacterial wilt, and
rhizoctonia canker (C. Hou et al., 2021) (S. Song et
al., 2024). These diseases often exhibit similar
symptoms, such as necrotic spots, discoloration, leaf
rolling, and wilting (S. Sattar et al., 2024), making
manual identification difficult, particularly for
farmers without specialized expertise (H. A Santoso
et al., 2024).
a
https://orcid.org/0009-0006-3365-1848
b
https://orcid.org/0000-0003-2026-1809
Potato (Solanum tuberosum L.), the fourth most
important food crop in the world, is affected by
several viral pathogens with potato virus Y (PVY)
having the greatest economic impact. At least nine
biologically distinct variants of PVY are known to
infect potato. These include the relatively new
recombinant types named PVY-NTN and PVYN-Wi,
which induce tuber necrosis in susceptible cultivars.
To date, the molecular plant-virus interactions
underlying this pathogenicity have not been fully
characterized. We hypothesized that this necrotic
behavior is supported by transcriptional and
functional signatures that are unique to PVY-NTN
and PVYN-Wi (Richard Manasseh et al., 2024).
Potato Y virus (PVY, genus Potyvirus), which has
RNA as genetic material, is generally detected among
potatoes cultivated around the world. The virus is
differentiated into strains O, C, and Z according to
specific hypersensitive responses to three potato
genes: Ny, Nc, and Nz, respectively. PVY has been
associated as one of the most important plant viruses
Bulan, A. S. and Nurtanio, I.
Classification of Leaf Disease in Potato Plants Based on Color and Texture Features Using the K Nearest Neighbor (KNN) Method.
DOI: 10.5220/0014272800004928
Paper published under CC license (CC BY-NC-ND 4.0)
In Proceedings of the 1st International Conference on Research and Innovations in Information and Engineering Technology (RITECH 2025), pages 61-67
ISBN: 978-989-758-784-9
Proceedings Copyright © 2025 by SCITEPRESS – Science and Technology Publications, Lda.
61

due to its wide range of hosts, distribution, and large
economic impact. Recent estimates estimate losses of
EUR 187 million per year due to PVY infection in
potatoes in Europe (Adyatma Irawan Santosa et al.,
2025).
Manual identification by agricultural experts also
has limitations, such as subjectivity, time constraints,
and reliance on individual experience an automated
system based on leaf imagery is required to identify
diseases quickly, accurately, and consistently (S.
Qian et al., 2021). Several previous studies have
developed plant disease detection systems using
image-based approaches with deep learning methods
such as CNNs and transfer learning (I. Harfian et al.,
2020).
Although these approaches provide high accuracy
(A.J. Rozaki et al., 2020), they generally require large
datasets and significant computational resources (B.
Rahmat et al., 2022), which makes them less suitable
for implementation on devices with limited capacity,
such as mobile applications in agricultural settings.
This paper proposes an alternative approach using a
combination of simple but representative features,
namely color features (mean RGB) and texture
features (GLCM) (H. Habaragamuwa et al., 2021).
and, dimensionality reduction with PCA, and
classification using the K-Nearest Neighbor (KNN)
algorithm. This approach has several advantages:
computational efficiency (F. W. Siddhi et al., 2022).
Potato crops and their salability are influenced by
potato pests in that both crop yield and quality are
reduced. This in turn reduces the income for potato
farmers due to lower prices for the crop, lower crop
yield, trade restriction and reduced market access.
Agricultural viability over the long run therefore
depends on sustainable pest management. In order to
efficiently detect potato pests, a dataset was
constructed which contains eight prevalent potato
species that were taken from several sources. Image
pre-processing techniques were employed enhance
image quality for compatibility with deep learning
models (Amir Sohel et al., 2024).
Various potato species with different sizes, colors,
and shapes have different benefits and can be
developed in a variety of climates and are a crucial
food source for many nations. However, global potato
production faces significant challenges from several
diseases and disorders during their cultivation period.
Around 20-40% of overall food crops are lost due to
diseases and pest attacks globally as such, worldwide,
32% of potatoes are lost annually. Numerous factors
are responsible for the spread of infections in crops.
The disease triangle model is taken into consideration
as the principal behind the disease development. As
for this model, three predominant components
including a plant, favorable environmental
conditions, and a pathogen cause disease. An
infection evolves when these three factors co-exist,
which further causes damage to the plants and
reduces crop (Avneet Kaur et al., 2024).
Plant pests and diseases are a significant threat to
almost all major types of plants and global food
security. Traditional inspection across different plant
fields is time-consuming and impractical for a wider
plantation size, thus reducing crop production.
Therefore, many smart agricultural practices are
deployed to control plant diseases and pests. Most of
these approaches, for example, use vision-based
artificial intelligence (AI), machine learning (ML), or
deep learning (DL) methods and models to provide
disease detection solutions. Plant pathogens and pests
cause substantial reduction in plant production
depending on adverse seasonal and environmental
conditions leading to economic and social losses.
Contemporary pests and pathogen management
depend profoundly on pesticide application, for
example, herbicides, fungicides, and insecticides
(Wasswa Shafik et al., 2023)
Plant diseases are the primary cause of quality and
quantity loss in plants/crops. Bacteria, fungi, and
viruses are responsible for the majority of plant
disease. Each year, plant diseases cause 10%-16%
losses in agricultural yields worldwide, costing the
global economy $220 billion. To feed an expanding
population, agricultural output must be increased by
70%. Chemicals used to control plant diseases, such
as bactericide and fungicide, have a negative effect on
the agroecosystem. Effective early disease detection
strategies are necessary for food security and
agroecosystem sustainability. Bacterial wilt is caused
by Ralstonia solanacearum. These bacteria may
penetrate roots via natural wounds produced in
secondary root emergence, man-made wounds
generated during cultivation. Humidity and heat
promote illness growth. A bacterial slime fills the
plant's water conducting tissue by quickly
proliferating. The plant's vascular system is affected,
although the leaves may remain green. Infected plant
stems look brown in cross section with yellowish
stuff pouring out (Siva Prasad Patnayakuni et al.,
2022).
Disease detection from leaf images has been
among the popular studies in recent years. Classifying
leaf diseases using computational methods provides
great convenience for farming. In the studies carried
out in this field, systems that work with high accuracy
and are least affected by environmental factors that
can be used in agricultural lands come to the fore.
RITECH 2025 - The International Conference on Research and Innovations in Information and Engineering Technology
62
This study investigates the application of deep
learning architectures for accurate and efficient plant
disease detection within the context of the ongoing
digital transformation of the agricultural sector.
Recognizing the critical role of AI in modernizing
agriculture, this research focuses on enhancing the
accuracy of the classification of plant diseases.
Applying artificial intelligence to detect and classify
plant diseases enables farmers to intervene early.
Expert laboratory study of plant leaves is a protracted
and expensive endeavor. Farmers may swiftly and
consistently make decisions through an easily
accessible artificial intelligence system, facilitating
early disease intervention and cost reduction. The
application of artificial intelligence in agriculture is
more significant due to advancing technologies. The
adoption of artificial intelligence in agriculture has
accelerated due to advancements in image processing
and big data. Deep learning and machine learning
research assist farmers in making educated decisions
by swiftly processing agricultural data (T. Ozcan et
al., 2025).
2 MATERIAL AND METHODS
This study uses an experimental approach with the
following stages:
2.1 Data and Pre-Processing
The dataset was obtained through personal data
collection from several potato plants located in
Malino, Gowa Regency, South Sulawesi. The
imagery was taken using a drone device. The image
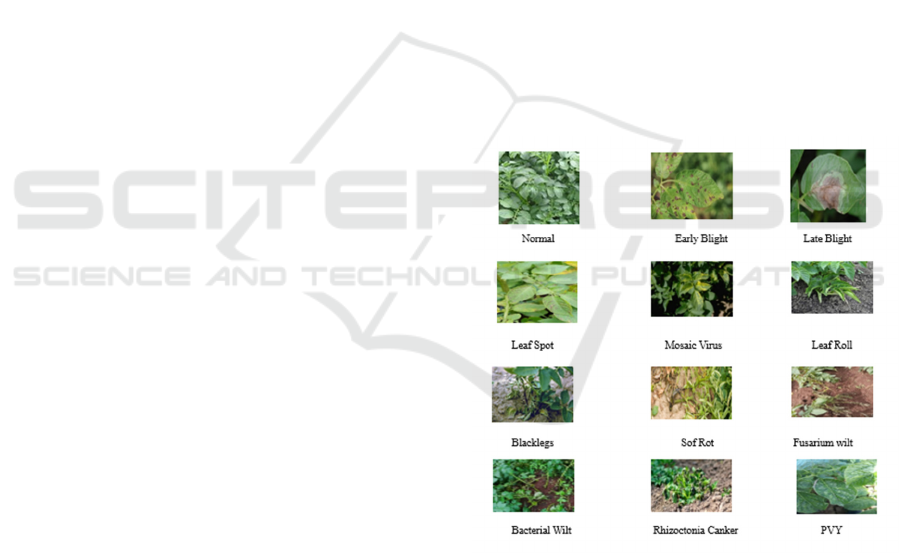
is divided into 12 classes, namely: normal, early
blight, late blight, leaf spot, mosaic virus (PVY), leaf
roll, blackleg, soft rot, fusarium wilt, bacterial /
mucus wilt, and rhizoctonia canker (scurf). The
dataset used in this study came from potato leaf
images with an original number of 1,055 images. The
data is then shared through the Roboflow platform
with a proportion of around 72% designated for
training, 15% for validation, and 14% for testing. In
the division process, the training dataset was applied
in the form of a grayscale transformation of 15%,
resulting in a doubling of images, which caused the
number of training data to increase to 1,155 images.
The dataset consisted of 1,055 original potato leaf
images collected from Malino, Gowa Regency, South
Sulawesi, using drone devices. These images were
divided into 12 classes, including healthy leaves and
eleven disease categories: early blight, late blight, leaf
spot, mosaic virus (PVY), leaf roll, blackleg, soft rot,
fusarium wilt, bacterial wilt, and rhizoctonia canker
as shown in Figure 1. To improve the diversity and
robustness of the model, data augmentation
techniques such as rotation, flipping, and zooming
were applied. This process increased the total
number of training images to 1,155. All images were
resized to a uniform resolution of 640 × 640 pixels
before being processed to ensure consistency and
compatibility with the classification system.
Segmentation was performed using the K-Means
clustering algorithm to separate diseased areas from
the background leaf area. This process grouped
pixels into clusters based on color similarity, where
pixels representing infected spots were assigned to
specific clusters. This step helped to focus the feature
extraction process on relevant regions of the image,
improving the accuracy of subsequent classification.
Meanwhile, the number of validation data remains at
235 images, and the test data (test set) remains at 220
images. All images were re-resolved to 640×640
pixels to be uniform before being processed to the
classification stage. Once the images are collected,
they are transformed from the RGB color space to
L*a*b for segmentation purposes. Segmentation was
carried out using the K-Means algorithm to separate
disease spots from the leaf.
Figure 1: Image of Potato Leaves.
2.2 Texture Feature Extraction
(GLCM)
The process of extracting texture features is done
using the extract glcm features function. This
function begins by ensuring that the input image is
formatted with three color channels (BGR), then the
dimage is converted to grayscale. To improve the
local contrast quality, the Contrast Limited Adaptive
Classification of Leaf Disease in Potato Plants Based on Color and Texture Features Using the K Nearest Neighbor (KNN) Method
63
Histogram Equalization (CLAHE) is used. Next, the
Gray Level Co-occurrence Matrix (GLCM) is
calculated at pixel distances of 1, 2, and 3 and at
angles 0°, 45°, 90°, and 135°. From the GLCM
matrix, the values of texture features in the form of
contrast, homogeneity, energy, correlation, and
texture are extracted. Angular Second Moment
(ASM). All of the texture feature values are then
combined into a single feature vector. Color feature
extraction is also done through the
extract_color_features function. This function
calculates the average intensity on each color channel
Red, Green, and Blue, from formatted input images
BGR. The result is three average values that represent
the dominant color features in the image.
2.3 Feature Processing, Normalization,
and Model Training
The feature extraction process is done on each image
in the dataset by resizing the image to the target size,
extracting texture features using GLCM, calculating
color features (Mean RGB), and adding flattened raw
pixel features so that all information is combined into
one comprehensive feature vector and stored in a
processed images list, while class labels are stored in
processed labels. Once the feature vector is obtained,
normalization is performed using the Min Max Scaler
of scikit-learn to adjust the scale to the range 0–1 so
that all features have an equal contribution and
minimize bias. The normalized data was then
dimensioned with the Principal Component Analysis
(PCA) method according to the best parameter (best
n) of optimization, then trained with KNN model
using the best number of Neighbors (best k) and
distance-based weighting for image classification
relying on texture, hue, and pixel information.
2.4 Classification of Potato Leaf
Disease Using K-Nearest Neighbor
(KNN)
The results of feature extraction are used as inputs for
the KNN algorithm. The process of classification is
performed. by calculating the Euclidean distance
between the sample data and the training data. The
optimal k-value is determined based on the results of
cross-validation to obtain the best accuracy. The
model was developed to recognize eleven classes of
diseases and tested with separate test data.
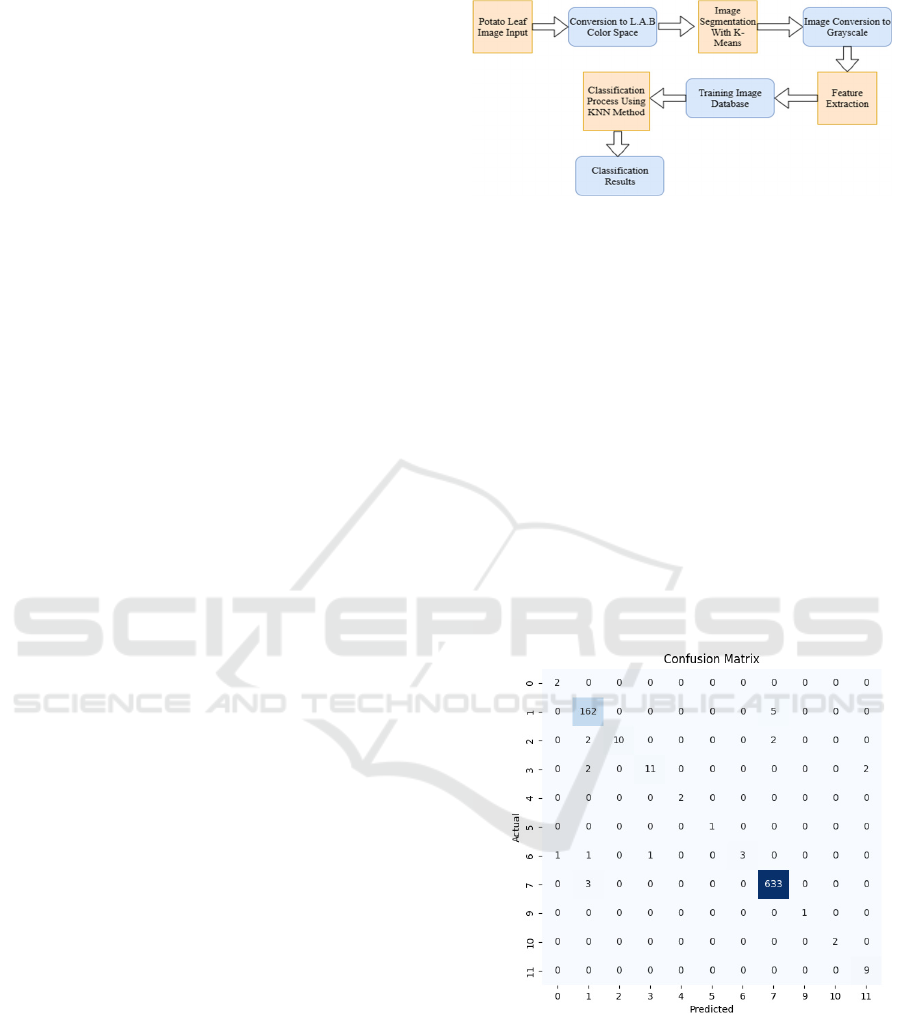
Figure 2: Image Processing and Classification Process
Diagram.
This Figure 2 illustrates the main stages in the
potato leaf disease classification system, starting from
image input, color conversion, spot segmentation,
extraction of color and texture features, to the final
classification process using the KNN algorithm.
2.5 Performance Evaluation
The evaluation of system performance is carried out
using a confusion matrix to calculate metrics such as
accuracy, precision, and recall for each class of
disease as shown in Figure 3. Cross-validation
techniques are used to ensure stable and unbiased
results.
Figure 3: Confusion Matrix.
Confusion Matrix Analysis: Most classes
achieved more than 95% accuracy, showing the
robustness of the model. However, minor
misclassifications occurred between visually similar
diseases, such as early blight and late blight, due to
overlapping features. This indicates challenges
related to class imbalance and similarity of disease
RITECH 2025 - The International Conference on Research and Innovations in Information and Engineering Technology
64
symptoms. Future research should focus on balancing
the dataset and incorporating advanced feature
selection or sampling techniques to mitigate this
issue. Based on the image above, it can be seen that
the confusion matrix shows the classification
performance of the KNN model with dimension
reduction using Principal Component Analysis
(PCA), which has been optimized through grid
search. Most of the data in each class was correctly
classified, which is characterized by the high diagonal
values in the matrix. For example, in class 1 there are
162 data points that are correctly classified out of a
total of 167 data points, while in class 7 there are 633
data points that are correctly classified out of a total
of 636 data. Some misclassification still occurs, such
as in class 1 which has 5 data points that are
misclassified to class 6, and class 3, which has been
misclassified to class 1 and class 11. This shows that
although the accuracy of the model is relatively high
with a value of 97.78%, there is still an overlap of
data in certain classes that cause false positives and
false negatives. Overall, these results indicate that the
PCA method is able to reduce the data dimension
without losing important information, this supporting
the performance of KNN in recognizing patterns
between classes well. This high level of accuracy is also
supported by the distribution of data on the confusion
matrix which is predominantly on target, so that the
model can be relied upon to classify test data with
consistent performance.
3 RESULTS AND DISCUSSION
3.1 Grid MAP
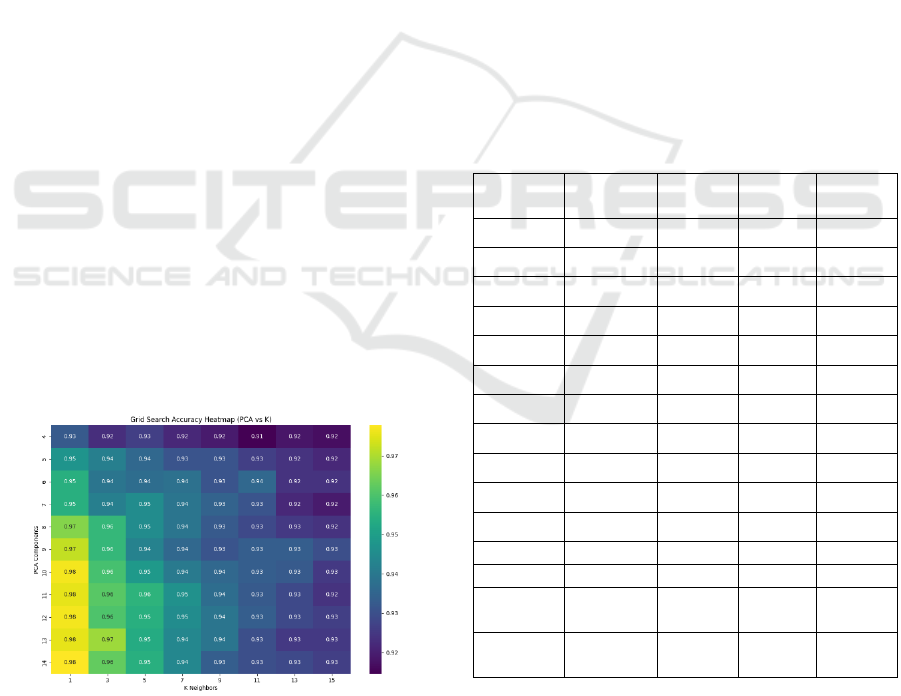
Figure 4: Grid MAP.
This heatmap (Figure 4) shows the grid search results
to find the best combination of the number of PCA
components and the K-value in the KNN that results
in the highest classification accuracy. The horizontal
axis represents the value of K Neighbors, while the
vertical axis indicates the number of PCA
components. Each cell contains a validation accuracy,
where lighter colors indicate higher accuracy. From
the heatmap pattern, it can be seen that the more PCA
components (about 10 to 14) and the smaller K values
(1 or 3) provide the highest accuracy, reaching 98%,
while combinations with larger Ks tend to decrease
the accuracy slightly.
The grid map illustrates the results of the grid
search process used to find the best combination of
the number of Principal Component Analysis (PCA)
components and the number of neighbors (k) in the
K-Nearest Neighbor (KNN) algorithm. The
horizontal axis represents the k values, while the
vertical axis represents the number of PCA
components tested. Lighter colors indicate higher
validation accuracy. From the grid map, it is clear that
using a higher number of PCA components (10 to 14)
with a smaller k value (1 or 3) provides the highest
accuracy, reaching up to 98%, which confirms.
3.2 KNN Classification Results
Table 1: Classification result.
Class
Table
Precision Recall
F1-
score
Support
0 0.67 1.00 0.80 2
1 0.95 0.97 0.96 167
2 1.00 0.71 0.83 14
3 0,92 0.73 0.81 15
4 1.00 1.00 1.00 2
5 1.00 1.00 1.00 1
6 1.00 0.50 0.67 6
7 0.99 1.00 0.99 636
8 1.00 1.00 1.00 1
9 1.00 1.00 1.00 1
10 1.00 1.00 1.00 2
11 0.82 1.00 0.90 9
accuracy 0.98 855
Marco
avg
0.94 0.90 0.91 855
Weighted
avg
0.98 0.98 0.98 855
The Table 1 shows the results of the classification
model performance evaluation based on Precision,
Recall, and F1-Score metrics for each class (0–10)
with a total of 855 test data samples. The model
achieved an accuracy of 98%, indicating highly
Classification of Leaf Disease in Potato Plants Based on Color and Texture Features Using the K Nearest Neighbor (KNN) Method
65
accurate predictions. The Weighted Average value
for precision, recall, and F1-score was 0.98 each,
indicating consistent and stable model performance,
especially for classes with large data sets. Although
there were several classes with lower F1-scores, such
as class 6 (0.67) and class 3 (0.81), due to the small
amount of data, overall, the model was able to classify
the data well and had high generalization capabilities.
Table 2: Algorithm comparison.
Algorith
m
Accuracy (%)
KNN + PCA (Proposed) 97.78
SVM (RBF Kennel) 95.43
Random Fores
t
94.87
Based on the results in Table 2, the KNN + PCA
(Proposed) algorithm showed the highest accuracy of
97.78%, compared to SVM (RBF Kernel) at 95.43%
and Random Forest at 94.87%. These results indicate
that the application of Principal Component Analysis
(PCA) in the KNN algorithm is able to improve
classification accuracy by reducing excess feature
dimensions, so that the data recognition process
becomes more efficient. Thus, the combination of
KNN and PCA is proven to provide the best
performance compared to the other two algorithms in
this study.
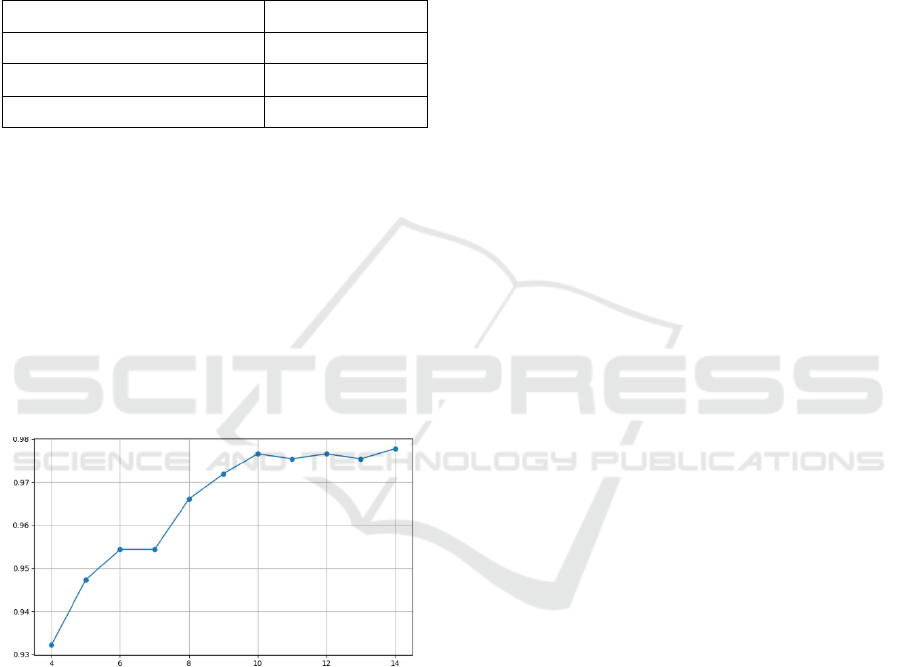
Figure 5: Classification Result Graph.
The graph shows the effect of varying the K value
on the accuracy of the K-Nearest Neighbor (KNN)
model. It can be seen that increasing the K value from
4 to 14 increases the model accuracy from
approximately 0.93 to 0.98. This indicates that the
more neighbors considered in the classification
process, the more stable and accurate the prediction
results become. However, after the K value reaches
approximately 10, the accuracy increase begins to
slow and tends to stabilize, indicating that the model
has reached its optimal point.
4 CONCLUSIONS
This study successfully developed a multiclass
classification system for 11 types of potato leaf
conditions using color and texture features combined
with the K-Nearest Neighbor (KNN) algorithm
optimized by PCA. The resulting system achieved a
high accuracy of 97.78%, demonstrating that it is a
lightweight yet effective solution, suitable for use on
devices with limited computational resources.
The model has the potential to be implemented in
mobile applications to support early detection of plant
diseases in agricultural environments. However,
further testing with independent datasets is needed to
fully validate its performance before large- scale
implementation.
ACKNOWLEDGEMENTS
The authors would like to express their sincere
appreciation to the AIMP Thematic Research Group,
Faculty of Engineering, Hasanuddin University, for
the guidance, support, and facilities that enabled this
research to be successfully conducted from its initial
stages to completion. Such contributions were
invaluable in ensuring the smooth progress of this
study. Furthermore, the authors acknowledge the use
of Generative AI tools during the preparation of this
manuscript. These tools were employed in a limited
manner to enhance readability, refine language
structure, and maintain consistency in writing.
However, all ideas, analyses, data interpretations, and
conclusions presented in this study remain entirely
the original work and responsibility of the authors.
REFERENCES
F. W. Siddhi, B. Rahmat, and S. N. Hertiana, "Cattle Health
Monitoring System with Waterfall Method via the
Internet Of Things," EProceeding of Engineering, vol.
8, no. 6, pp. 3952–3961, 2022.
Hou, C., Zhuang, J., Tang, Y., He, Y., Miao, A., Huang, H.,
& Luo, S. (2021). Recognition of early blight and late
blight diseases on potato leaves based on graph cut
segmentation. Journal of Agriculture and Food
Research, 5, 100154.
I. Harfian, N. Fadhilah, and A. F. Amalia, "Technique of
using drones with RGB camera sensors and VARI
algorithms to identify stress levels of maize crops,"
Agricultural Engineering Bulletin, vol. 25, no. 2, pp.
85–88,2020.
Kaur, A., Randhawa, G. S., Abbas, F., Ali, M., Esau, T. J.,
Farooque, A. A., & Singh, R. (2024). Artificial
RITECH 2025 - The International Conference on Research and Innovations in Information and Engineering Technology
66

intelligence driven smart farming for accurate detection
of potato diseases: a systematic review. IEEE Access.
Manasseh, R., Sathuvalli, V., & Pappu, H. R. (2024).
Transcriptional and functional predictors of potato
virus Y-induced tuber necrosis in potato (Solanum
Ngugi, L. C., Abelwahab, M., & Abo-Zahhad, M. (2021).
Recent advances in image processing techniques for
automated leaf pest and disease recognition–A review.
Information processing in agriculture, 8(1), 27-51.
Oishi, Y., Habaragamuwa, H., Zhang, Y., Sugiura, R.,
Asano, K., Akai, K., ... & Fujimoto, T. (2021).
Automated abnormal potato plant detection system
using deep learning models and portable video
cameras. International Journal of Applied Earth
Observation and Geoinformation, 104, 102509.
Ozcan, T., & Polat, E. (2025). BorB: A Novel Image
Segmentation Technique for Improving Plant Disease
Classification with Deep Learning Models. IEEE
Access.
Patnayakuni, S. P. (2022). Tomato: Different leaf disease
detection using transfer learning, based
network. Journalof Mobile Multimedia, 18(3), 743-
756.
Qian, S., Shuo, Y., Xiaofan, G., Siting, W., Xintong, J.,
Shuang, L., & Yuanhu, X. (2021). RAVL1 activates
IDD3 to negatively regulate rice resistance to sheath
blight disease. Rice Science, 28(2), 146-155.
Rozaqi, A. J., & Sunyoto, A. (2020, November).
Identification of disease in potato leaves using
Convolutional Neural Network (CNN) algorithm.
In 2020 3rd International Conference on Information
and Communications Technology (ICOIACT) (pp. 72-
76). IEEE.
Santosa, A. I., Wulandari, R., Vadilah, M. N., Sabila, E.,
Kusuma, A. F., Mulyadi, D., ... & Çelik, A. (2025).
Survey of Potyviruses, Carlaviruses, and
Begomoviruses in Potato Cultivation Centers of West,
Central, and East Java Provinces,
Indonesia. International Journal of Plant
Biology, 16(2), 65.
Santoso, H. A., Fandhi Safsalta, B., Febrianto, N.,
Wilujeng Saraswati, G., & Haw, S. C. (2024).
Comparative analysis of convolutional neural network
and DenseNet121 transfer learning in agriculture
focusing on crop leaf disease identification. Applied
Computing and Informatics.
Sattar, S., & Khalid, N. (2024). Selection of processed and
packaged potato-based snacks among university
students: a cross-sectional study regarding food
environment and dietary behavior. Arab Gulf Journal
of Scientific Research, 42(2), 306-317.
Shafik, W., Tufail, A., Namoun, A., De Silva, L. C., &
Apong, R. A. A. H. M. (2023). A systematic literature
review on plant disease detection: Motivations,
classification techniques, datasets, challenges, and
future trends. Ieee Access, 11, 59174-59203.
Sohel, A., Shakil, M. S., Siddiquee, S. M. T., Al Marouf,
A., Rokne, J. G., & Alhajj, R. (2024). Enhanced Potato
Pest Identification: A Deep learning approach for
identifying potato pests. IEEE Access.
Y. Alkhalifi, "Detection of Capsicum Plant Diseases Based
on Leaf Images Using FineTuned Transfer Learning,"
Thesis, 2021.
Zhuo, L. Ü., Jing, W. A. N. G., Jing, Z. H. U., Mei-ying,
G. U., Qi-yong, T. A. N. G., Wei, W. A. N. G., & Bo,
W. A. N. G. (2020). First report of a new potato disease
caused by Galactomyces candidum F12 in
China. Journal of Integrative Agriculture, 19(10),
2470-2476.
Classification of Leaf Disease in Potato Plants Based on Color and Texture Features Using the K Nearest Neighbor (KNN) Method
67
