
Improvement of Unmanned Aerial Vehicle Object Detection Through
Scale Optimization and YOLOv7-Tiny Anchor Adjustment
Febrianto Eko Saputra and Ingrid Nurtanio
Department of Informatics, Hasanuddin University, Indonesia
Keywords: Object Detection, YOLOv7-Tiny, UAV, Small Objects, Anchor Box.
Abstract: Object detection in Unmanned Aerial Vehicle (UAV) images is challenging due to variations in scale,
shooting angle, and object density, particularly for small objects. YOLOv7-Tiny, a lightweight real-time
model, offers high efficiency but limited accuracy in this scenario. This study proposes architectural
modifications and anchor optimization to enhance detection performance. The architecture is improved by
adding a high-resolution detection path to the neck and an additional detection layer to the head, thereby
strengthening small object feature representation. Furthermore, anchor box optimization using the K-means
algorithm with Manhattan Distance produces anchors that are more representative of the UAV dataset’s object
size distribution. Experimental results show that the optimized YOLOv7-Tiny achieves stable precision (95)
and recall (96), with the F1-Score increasing from 95 to 96 compared to the baseline. The model also improves
mAP at low to medium IoU thresholds, raising the average mAP@50–95 from 71.68 to 72.73. However,
performance decreases at high IoU thresholds, and inference time slightly increases due to added complexity.
Overall, the proposed approach improves UAV small object detection with a trade-off in processing efficiency.
1 INTRODUCTION
Object detection is one of the core tasks in the field of
computer vision, with various strategic applications
such as military operations, autonomous vehicles,
security monitoring systems, and remote observation.
In recent years, the use of unmanned aerial vehicles
(UAVs) (Mohsan et al., 2022) as platforms for aerial
imaging has grown rapidly across various sectors, due
to their ability to capture images over large areas,
making them a highly promising source of data for
supporting various object detection tasks (Ali &
Zhang, 2024). However, the unique characteristics of
aerial images captured by UAVs, such as variations
in distance and angle of capture, pose a number of
challenges in the object detection process. One of the
main problems is the wide range of target sizes. Large
objects, such as cars at close range, are relatively easy
to detect, while smaller and denser objects, such as
bicycles or pedestrians, are often difficult to identify
accurately. Additionally, the limitations of UAVs in
terms of payload capacity and portability make it
challenging to integrate high-performance computing
hardware, thereby restricting real-time processing
capabilities on the UAV platform itself (Xiao & Di,
2024).
To address these challenges, various deep
learning-based object detection algorithms have
been developed and implemented on UAV images.
In general, modern detection algorithms can be
divided into two main categories based on their
architecture, namely two-stage and one-stage
algorithms (Bi et al., 2023). Two-stage algorithms,
such as Faster R-CNN (Xu et al., 2022), perform the
detection process in two steps: first, generating
candidate regions using selective search and feature
extraction; second, classifying and refining the
object locations. Although this method achieves
high accuracy, its complex structure makes it less
efficient for real-time
applications on UAVs. In
contrast, single-stage
algorithms like the You Only
Look Once (YOLO) (Badgujar et al., 2024) series
combine feature
extraction and object location and
category prediction directly in a single step, making
them significantly more efficient (S. Liu et al.,
2025). However, YOLO still shows limitations in
detecting small objects in
UAV images. This is due
to weak representation of small object features and
loss of spatial information at low resolution levels.
Therefore, optimization of network architecture and
model parameters is needed to improve the
accuracy of small object detection in
complex UAV
Eko Saputra, F. and Nurtanio, I.
Improvement of Unmanned Aerial Vehicle Object Detection Through Scale Optimization and YOLOv7-Tiny Anchor Adjustment.
DOI: 10.5220/0014268500004928
Paper published under CC license (CC BY-NC-ND 4.0)
In Proceedings of the 1st International Conference on Research and Innovations in Information and Engineering Technology (RITECH 2025), pages 37-44
ISBN: 978-989-758-784-9
Proceedings Copyright © 2025 by SCITEPRESS – Science and Technology Publications, Lda.
37

imaging conditions (Telçeken et al., 2024).
Among the various single-stage detection
algorithms available today, YOLOv7 (C.-Y. Wang et
al., 2023) stands out as one of the most reliable and
efficient methods in terms of detection accuracy and
speed. YOLOv7-tiny (Q. Wang et al., 2024), as a
lightweight variant of YOLOv7, is specifically
designed for applications on edge devices with
limited computational resources. Compared to other
YOLOv7 variants, YOLOv7-tiny offers fewer
parameters and faster inference times, making it
suitable for deployment on UAV platforms that
demand computational efficiency and real-time
detection. Although its detection accuracy is slightly
lower than the full version of YOLOv7, this trade-off
is acceptable within the constraints of UAV hardware
limitations (Zhang et al., 2024). In the YOLOv7-Tiny
architecture, the head component plays an important
role in generating predictions based on features
extracted by the backbone. By utilizing feature maps
from various levels of the pyramid, the head performs
detection through bounding box predictions, class
probabilities, and object scores. In the final stage, the
output layer processes a set of anchor boxes with
various aspect ratios and scales. Each anchor is then
combined with position and size offset predictions
calculated relative to the grid cell, resulting in the
final bounding box. In addition, the model also
predicts an objectness score for each anchor, which
represents the likelihood of an object's presence. This
score serves to filter out irrelevant predictions,
thereby improving detection precision. (Xie et al.,
2024).
Predefined anchor boxes in detection models are
often sensitive to object scale variations. Small
anchors tend to have difficulty recognizing large
objects, while large anchors are less accurate in
detecting small objects. In addition, mismatches in
aspect ratio between anchors and object shapes can
reduce detection performance. Therefore, selecting
anchor boxes that match object characteristics is an
important factor in improving detection accuracy
(Zheng et al., 2023). One simpler and more efficient
approach to determining the initial anchor is the K-
Means algorithm, which clusters data based on the
distance to the cluster center (prototype), thereby
representing the size and shape of the dominant
objects in the dataset (Tang et al., 2024).
In the YOLOv7-Tiny architecture, the initial
anchor box scale is designed based on the COCO
dataset (Hu et al., 2023). However, when applied to
the UAV dataset, this scale is unable to represent the
entire range of object sizes, which slows down the
parameter training process and reduces detection
speed. To overcome this limitation, a modification of
YOLOv7-Tiny was developed with the application of
a Manhattan distance-based K-Means algorithm
(Shim et al., 2022). Manhattan distance is a
calculation method that measures the absolute
difference between the coordinates of two objects
(Asgar et al., 2023). This algorithm is used to
determine a more appropriate initial anchor box scale
that is capable of covering the entire object scale in
the UAV dataset (Xue et al., 2022).
Therefore, in this study, YOLOv7-tiny is used as
a baseline to be developed to improve the detection of
small objects in UAV images through architectural
modifications and contributions:
▪
Proposing modifications to the YOLOv7-
Tiny architecture by adding high-resolution
detection paths and scales to improve
detection performance.
▪
Adjusting anchor box configuration using
the Manhattan distance-based K-means
method
based on object size distribution in
UAV images.
▪
Conducting a comprehensive evaluation of
the influence of architectural modifications
and anchors on detection performance.
2 METHODOLOGY
2.1 Dataset
This study utilizes a combined dataset from three
main sources for vehicle detection in UAV images
(Muzammul et al., 2024). The first source is the
aerial-cars dataset, which consists of 153 annotated
images (Butler & Leung, 2024). The second source,
the M0606 subset of the UAV Detection and
Tracking Benchmark (UAVDT) (Du et al., 2023),
includes 1,255 images with a variety of viewing
angles, lighting, and backgrounds. The third source
consists of 157 images extracted and manually
annotated from videos with a resolution of
2720×1530 pixels at 30 fps, recorded using a DJI
Phantom 4 Pro drone (P. Wang et al., 2024).
All images are annotated in YOLO format, with
five parameters relative to image size: class ID, center
coordinates (x, y), width, and height of the bounding
box. The dataset includes four object classes, namely
car, truck, bus, and minibus, and is randomly divided
into 90% training data and 10% test data.
RITECH 2025 - The International Conference on Research and Innovations in Information and Engineering Technology
38
2.2 YOLOv7-Tiny Architecture
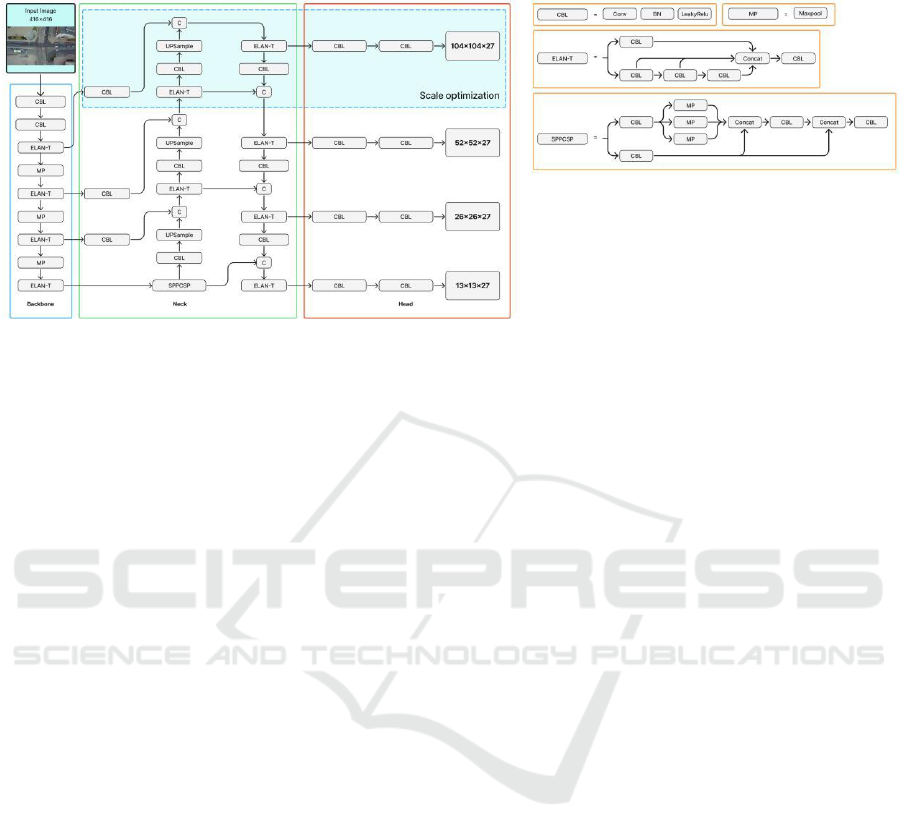
Figure 1: YOLOv7-Tiny Architecture with Scale Optimization.
In this study, a small object detection model
was developed using YOLOv7-Tiny as its basis.
YOLOv7-Tiny has a concise model structure and
high inference speed, making it suitable for use on
devices with limited resources (Cheng et al., 2024).
However, the model's detection of small objects in
images with complex backgrounds still needs to be
improved and requires further optimization and
refinement (Gong et al., 2022).
Because YOLOv7-Tiny has a lightweight
architecture and is suitable for running on edge GPUs
(R. Liu et al., 2024), this study uses 416×416 pixel
RGB image inputs. This size was chosen to reduce the
computational load and speed up the inference
process, making it more efficient than the standard
640×640 pixel size (LU et al., 2023) and consists of
three main components, namely the backbone, neck,
and head (D. Cao et al., 2025). The backbone acts as
a feature extraction layer and consists of several main
modules, namely Convolution-BatchNorm-
LeakyReLU (CBL) (Gong et al., 2024), Efficient
Layer Aggregation Network (ELAN-T) (Lee et al.,
2024), and Max-Pooling (MP) (Deepti Raj &
Prabadevi, 2024). The CBL module, which consists
of convolution layers, batch normalization, and the
Leaky ReLU activation function, serves to extract
feature information from images. Meanwhile, the
ELAN module is built by combining several CBL
blocks through branching paths, thereby increasing
the network's learning capacity. The MP module uses
max-pooling operations to perform downsampling
and reduce feature dimensions (Chen et al., 2024).
The neck serves as a feature concatenator by
utilizing the SPPCSP (X. Cao et al., 2024), CBL, and
ELAN-T modules. The SPPCSP module consists of
Spatial Pyramid Pooling (SPP) (Dewi et al., 2023),
which uses max-pooling at multiple scales to capture
cross-resolution information, and Cross Stage Partial
(CSP) (Dewi & Juli Christanto, 2022), which
performs concatenation to enrich feature
representations. This neck structure adopts the Path
Aggregation Feature Pyramid Network (PAFPN)
(Ang et al., 2024) approach, which flows feature
information top-down and bottom-up to strengthen
multi-scale detection. In this study, optimization was
performed on the neck by adding a new extraction
path from one of the ELAN-T layers in the backbone
to the head, forming an additional 104×104 pixel
detection layer. The addition of this path allows for
more optimal utilization of high-resolution feature
flow, giving the model better sensitivity to small
objects that are often missed in standard
configurations.
With optimization as shown in Figure 1, the head
layer now has four detection scales, namely 104×104,
52×52, 26×26, and 13×13. With the addition of new
detection scales, the configuration in the head section
must also be adjusted, particularly in relation to the
number of output channels generated at each scale.
This is important because each feature map in the
head is tasked with generating predictions in the form
of bounding boxes, confidence, and object classes.
Therefore, the number of output channels at each
scale is determined using the equation:
Output channel = number of anchors x (5 + C) (1)
Where 5 represents the bounding box coordinates
(x, y, w, h) and confidence, while C is the number of
classes. For example, in the COCO dataset which has
80 classes, the calculation becomes 3×(5+80)=255,
resulting in outputs of 52×52×255, 26×26×255, and
Improvement of Unmanned Aerial Vehicle Object Detection Through Scale Optimization and YOLOv7-Tiny Anchor Adjustment
39
13×13×255. Meanwhile, this study uses four classes,
so the number of output channels is 3×(5+4)=27.
Thus, the four optimized detection scales, namely
104×104×27, 52×52×27, 26×26×27, and 13×13×27,
have produced outputs that correspond to the number
of classes in this study's dataset, as shown in Figure
2.
(a) (b)
(c) (d)
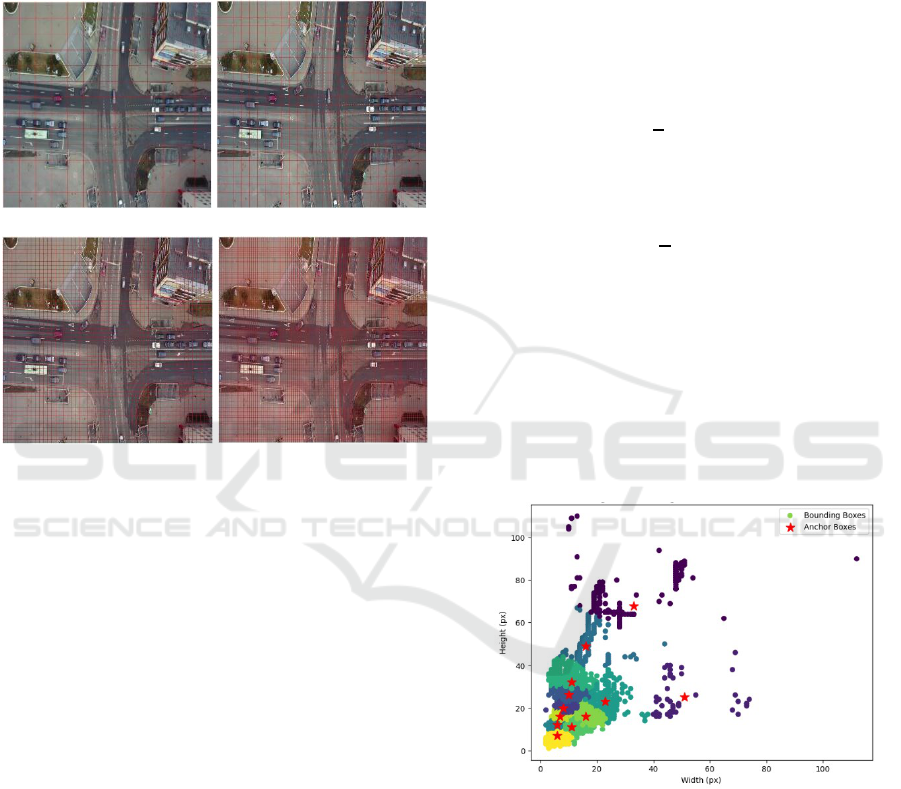
Figure 2: Illustration of multi-scale grid cells in the
optimized YOLOv7-Tiny for UAV object detection: (a)
13x13x27, (b) 26x26x27, (c) 52x52x27, (d) 104x104x27.
2.3 Anchor Boxes YOLOv7-Tiny
Anchor boxes are predefined bounding boxes used by
YOLO as references in predicting the presence of
objects. Each YOLO detection path uses three anchor
boxes (nine boxes in total), with outputs measuring
52×52×255, 26×26×255, and 13×13×255 (Limberg
et al., 2022). These three scales of feature maps are
used to detect objects of different sizes, where 52×52
is for small objects, 26×26 is for medium-sized
objects, and 13×13 is for large objects. In the
optimized YOLOv7-Tiny architecture, an additional
detection path at a scale of 104×104 is introduced to
improve performance in detecting very small objects.
As a result, the model now uses four scales of
feature maps (104×104, 52×52, 26×26, and 13×13).
Since each scale uses three pairs of anchor boxes
(width and height), the total number of anchor boxes
used is 12 centroids. To determine the initial values
of these 12 centroids, the k-means clustering
algorithm is used. In the initial stage, each bounding
box in the dataset is assigned to the nearest centroid
by calculating the distance between the width and
height of the bounding box and the centroid using
the Manhattan distance formula (2) as follows:
D
(
x,y
)
= | x
i
- y
i
| + | x
j
- y
j
|
(2)
Where (x
i
, x
j
) represents the width and height of the
bounding box, and (y
i
, y
j
) represents the centroid
coordinates. After this initial classification, each
centroid is updated by calculating the average
dimensions of all bounding boxes in its cluster,
expressed as:
𝐶
=
∑
𝑥
(3)
Where 𝐶
𝑘
is the new centroid for cluster 𝑘, 𝑛is
the number of bounding boxes in the cluster, and 𝑥
𝑖
is the dimension of the i-th bounding box. This
clustering and updating process is repeated iteratively
until the centroids converge or no longer undergo
significant changes. Once convergence has been
achieved, as shown in Figure 3, the centroids are
sorted by size from smallest to largest, as shown in
Table 1. Then mapped to four scales of the feature
map. Thus, each scale obtains three pairs of anchor
boxes corresponding to the size range of the target
objects. The resulting anchors are ready for use in the
optimized YOLOv7-Tiny model, thereby improving
detection performance, especially for small objects.
Figure 3: Anchor Distribution from Manhattan Distance
Clustering.
2.4 Evaluation
The evaluation was conducted on a test dataset
consisting of 10% of the total combined dataset,
including the aerial-cars dataset (153 annotated
images), the M0606 subset of the UAV Detection and
Tracking Benchmark (UAVDT) containing 1,255
images with variations in viewpoint, lighting, and
background, and 157 images extracted from private
RITECH 2025 - The International Conference on Research and Innovations in Information and Engineering Technology
40
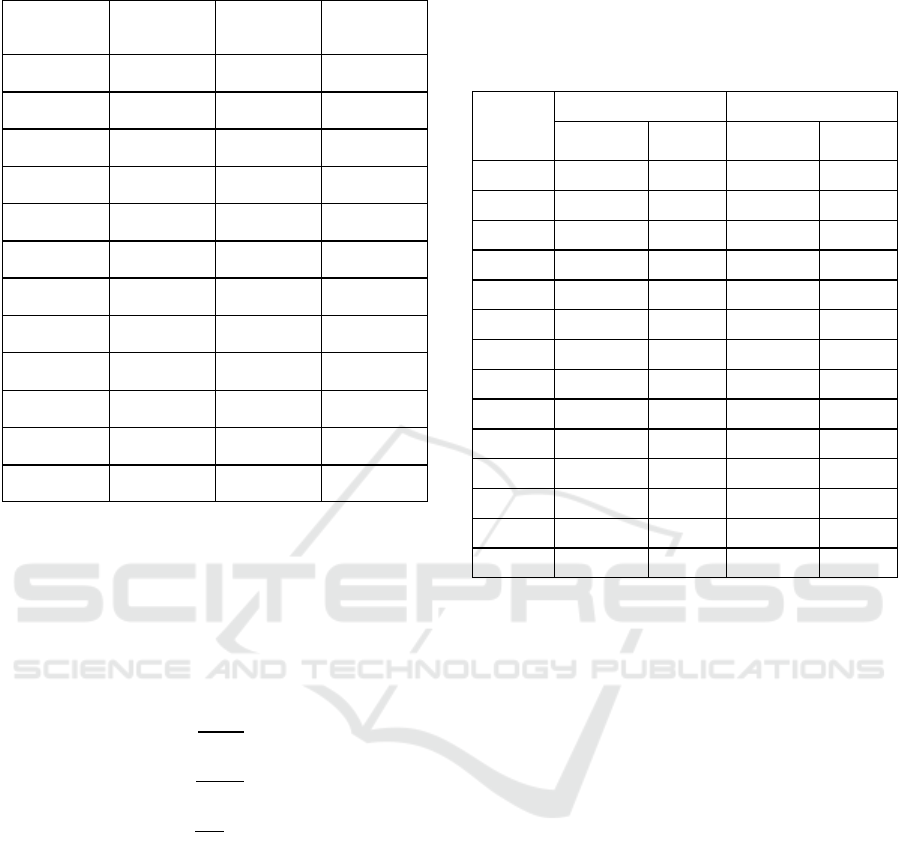
Table 1: Anchor box dimensions obtained from clustering.
Anchor
Index
Width (px) Height (px)
Area (px
2
)
1 6 7 42
2 6 12 72
3 7 16 112
4 11 11 121
5 9 20 180
6 16 16 256
7 10 26 260
8 11 32 352
9 23 23 529
10 16 49 784
11 51 25 1.275
12 33 68 2.244
UAV recordings with a resolution of 2720×1530
pixels at 30 fps. This dataset was selected randomly
so that it still represents the variation in object size
and image capture conditions commonly found in
UAV images. Model performance is evaluated using
the metrics Precision (P), Recall (R), and F1 Score
(F1) (Sathyanarayanan & Tantri, 2024) with the
following formula:
𝑃=
(4)
𝑅=
(5)
𝐹1 =
(6)
3 RESULTS
3.1 Experimental Setup
The entire training process was conducted on the
Google Colab platform with NVIDIA Tesla T4 GPU
support (16 GB VRAM), which enabled efficient
training of the YOLOv7-Tiny model. This training
environment was chosen because it provides
sufficient computing resources for deep learning-
based object detection experiments without requiring
additional local infrastructure.
3.2 Object Detection Performance
Table 2: Comparison of detection performance and
inference time between Baseline YOLOv7-Tiny and
Optimized YOLOv7-Tiny.
Metrics
Baseline YOLOv7-Tiny Optimized YOLOv7-Tiny
Performance
Detection
Ti
m
e
Performance
Detection
Ti
m
e
Precision 95 - 95 -
Recall 96 - 96 -
F1-Score 95 - 96 -
mAP@50 96.73 4 seconds 97.46 6 seconds
mAP@55 96.11 5 seconds 96.72 7 seconds
mAP@60 95.34 6 seconds 95.82 5 seconds
mAP@65 93.06 5 seconds 94.62 6 seconds
mAP@70 90.18 5 seconds 92.26 6 seconds
mAP@75 86.28 4 seconds 85.73 6 seconds
mAP@80 76.24 4 seconds 77.73 5 seconds
mAP@85 55.84 4 seconds 60.49 6 seconds
mAP@90 24.74 4 seconds 25.32 7 seconds
mAP@95 2.34 4 seconds 1.22 6 seconds
mAP@50- 95
71.68 4 seconds 72.73 6 seconds
The results of the evaluation matrix
comparison in Table 2 show that both models
achieved the same
precision and recall values of 95
and 96, respectively.
However, Optimized YOLOv7-
Tiny showed an increase in F1-Score from 95 to 96,
which represents better detection performance
consistency as a result
of optimizing the relationship
between precision and recall. In the mean Average
Precision metric, the
optimized model provides
improvements at low to
medium IoU thresholds,
with mAP@50 increasing
from 96.73 to 97.46,
mAP@70 rising from 90.18 to 92.26, and mAP@85
from 55.84 to 60.49. However, performance
decreased at high IoU thresholds, with mAP@95
dropping from 2.34 to 1.22. But overall, the
average
mAP@50–95 value increased from 71.68 to
72.73,
indicating an improvement in detection
performance.
In terms of inference time, the baseline model is
faster with an average of four to six seconds, while
the optimized model takes five to seven seconds. This
shows a trade-off between improved detection
accuracy and processing time efficiency.
Improvement of Unmanned Aerial Vehicle Object Detection Through Scale Optimization and YOLOv7-Tiny Anchor Adjustment
41
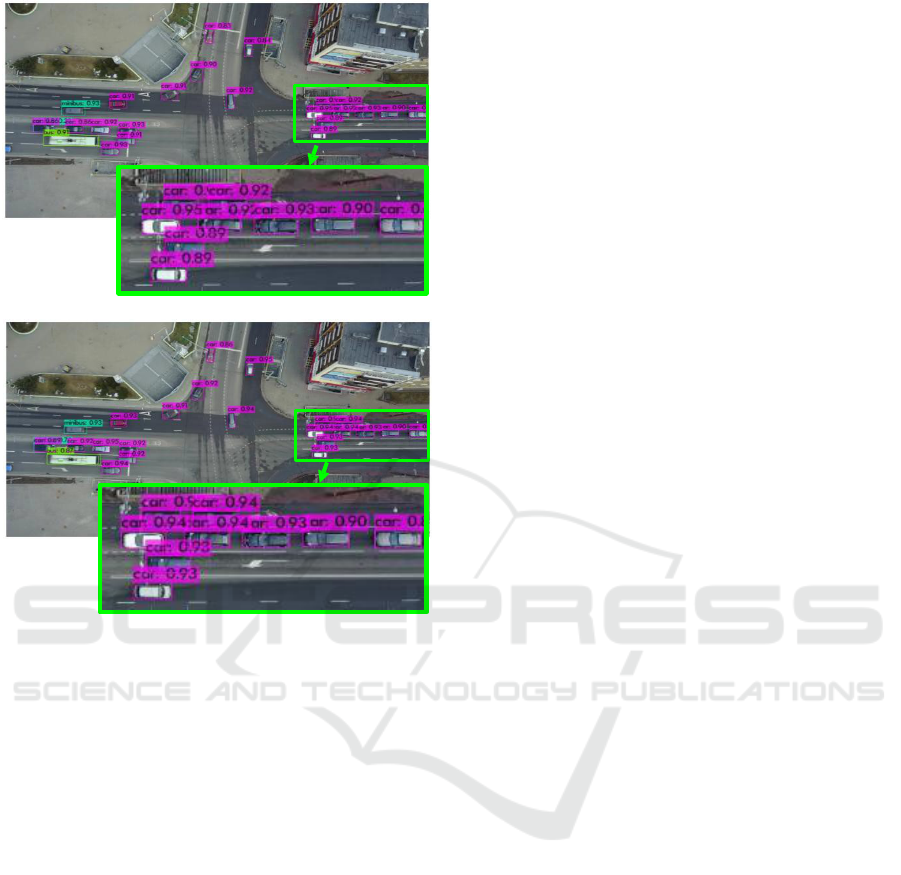
(a)
(b)
Figure 4: Detection Results on UAV Images: (a) Baseline
YOLOv7-Tiny and (b) Optimized YOLOv7-Tiny.
The detection results in Figure 4 show differences in
detection quality between the two models. The
baseline YOLOv7-Tiny still tends to miss some small
objects and produces relatively lower confidence
scores. In contrast, Optimized YOLOv7-Tiny is able
to detect the same objects with a more consistent and
higher confidence level. This phenomenon is clearly
visible in areas with high vehicle density, where the
optimized model provides more stable detection.
Thus, these visual results are consistent with the
quantitative findings in the evaluation metrics, which
overall show an improvement in detection
performance.
4 DISCUSSION
The evaluation results show that the optimization
carried out in this study produced varying
performance changes. In the evaluation metrics,
precision and recall did not change, but there was a
slight increase in the F1-Score value. This increase
indicates a better balance between precision and
recall, resulting in more consistent detection
performance. A more significant difference was seen
in the mean Average Precision metric. The optimized
model showed improved performance at low to
medium IoU thresholds, while performance
decreased at high IoU thresholds. This phenomenon
indicates that the model is quite good at detecting
objects at low thresholds, and is even more optimal in
the optimized model. However, both models still
experience a decline in performance at high
thresholds, with relatively low mAP values, namely
2.34 for the baseline model and 1.22 for the optimized
model. This indicates that the model still faces
difficulties in producing truly accurate bounding box
predictions, even though the objects have been
successfully detected.
The improvement in mAP is inseparable from the
anchor optimization performed using the k-means
algorithm with Manhattan distance. This strategy
produces anchors that are more representative of the
distribution of object sizes in the dataset, enabling the
model to produce more accurate bounding box
predictions. In addition, modifications to the
YOLOv7-Tiny architecture carried out in this study,
namely through the addition of a feature
fusion/aggregation layer in the neck and the addition
of an extra detection layer in the head to
accommodate small objects, also influenced the
detection results. However, these architectural
changes had an impact on increasing the inference
time, where the optimized model took longer than the
baseline model. Thus, it can be concluded that there
is a trade-off between improved detection accuracy
and processing time efficiency.
5 CONCLUSION
This study shows that optimizing the YOLOv7-Tiny
architecture and anchors using k-means and
Manhattan Distance can improve the detection of
small objects in UAV images. The evaluation results
show a better F1-Score and an increase in mAP at low
to medium IoU thresholds, with an average
mAP@50–95 increasing from 71.68 to 72.73.
However, performance at high IoU thresholds still
declined and inference time became longer due to the
addition of feature fusion paths and new detection
scales. Overall, this study succeeded in improving
small object detection, although there are still
limitations in high precision that could be the focus of
further research.
RITECH 2025 - The International Conference on Research and Innovations in Information and Engineering Technology
42

REFERENCES
Ali, M. L., & Zhang, Z. (2024). The YOLO Framework: A
Comprehensive Review of Evolution, Applications,
and Benchmarks in
Object Detection. In Computers
(Vol. 13, Issue
12). Multidisciplinary Digital
Publishing Institute (MDPI).
https://doi.org/10.3390/computers13120336
Ang, L., Rahim, S. K. N. A., Hamzah, R., Aminuddin,
R., &
Yousheng, G. (2024). YOLO algorithm with hybrid
attention feature pyramid network for solder joint
defect detection. http://arxiv.org/abs/2401.01214
Asgar, M. R. G., Hidayat, R., & Bejo, A. (2023).
Comparison Euclidean Distance and Manhattan
Distance as Classification in Speech Recognition
System. In Proceedings of the International
Conference on Educational Management and
Technology (ICEMT 2022) (pp. 454–463). Atlantis
Press SARL. https://doi.org/10.2991/978-2- 494069-
95-4_54
Badgujar, C. M., Poulose, A., & Gan, H. (2024).
Agricultural Object Detection with You Look Only
Once (YOLO) Algorithm: A Bibliometric and
Systematic Literature Review.
Bi, H., Wen, V., & Xu, Z. (2023). Comparing one- stage
and two-stage learning strategy in object detection.
Applied and Computational
Engineering, 5(1),
171–177. https://doi.org/10.54254/2755-
2721/5/20230556 Butler, J., & Leung, H. (2024). A
Heatmap-Supplemented R-CNN Trained Using an
Inflated IoU for Small Object Detection. Remote
Sensing, 16(21). https://doi.org/10.3390/rs16214065
Cao, D., Luo, W., Tang, R., Liu, Y., Zhao, J., Li, X., &
Yuan, L. (2025). Research on Apple Detection and
Tracking Count in Complex Scenes Based on the
Improved YOLOv7-Tiny-PDE. Agriculture
(Switzerland), 15(5).
https://doi.org/10.3390/agriculture15050483
Cao, X., Xu, Y., He, J., Liu, J., & Wang, Y. (2024). A
Lightweight Traffic Sign Detection Method
With
Improved YOLOv7-Tiny. IEEE Access, 12, 105131–
105147.
https://doi.org/10.1109/ACCESS.2024.3435384
Chen, Z., Qian, M., Zhang, X., & Zhu, J. (2024).
Chinese Bayberry Detection in an Orchard
Environment Based on an Improved YOLOv7-
Tiny Model. Agriculture (Switzerland), 14(10).
https://doi.org/10.3390/agriculture14101725
Cheng, D., Zhao, Z., & Feng, J. (2024). Rice Diseases
Identification Method Based on Improved YOLOv7-
Tiny. Agriculture (Switzerland), 14(5).
https://doi.org/10.3390/agriculture14050709
Deepti Raj, G., & Prabadevi, B. (2024). MoL-
YOLOv7: Streamlining Industrial Defect
Detection
With an Optimized YOLOv7 Approach. IEEE Access,
12, 117090–117101.
https://doi.org/10.1109/ACCESS.2024.3447035
Dewi, C., Chen, R.-C., Yu, H., & Jiang, X. (2023).
Robust Detection Method for Improving Small
Traffic
Sign Recognition Based on Spatial Pyramid Pooling.
Dewi, C., & Juli Christanto, H. (2022). Combination of
Deep Cross-Stage Partial Network and Spatial
Pyramid Pooling for Automatic Hand Detection. Big
Data and Cognitive Computing, 6(3).
https://doi.org/10.3390/bdcc6030085
Du, B., Huang, Y., Chen, J., & Huang, D. (2023).
Adaptive Sparse Convolutional Networks with
Global Context Enhancement for Faster Object
Detection on Drone Images.
https://github.com/Cuogeihong/CEASC.
Gong, H., Ma, X., & Guo, Y. (2024). Research on a
Target Detection Algorithm for Common Pests
Based
on an Improved YOLOv7-Tiny Model.
Agronomy,
14(12). https://doi.org/10.3390/agronomy14123068
Gong, H., Mu, T., Li, Q., Dai, H., Li, C., He, Z.,
Wang, W., Han, F., Tuniyazi, A., Li, H., Lang, X., Li,
Z., & Wang, B. (2022). Swin-Transformer-Enabled
YOLOv5 with Attention Mechanism for Small Object
Detection on Satellite Images. Remote Sensing,
14(12). https://doi.org/10.3390/rs14122861
Hu, S., Zhao, F., Lu, H., Deng, Y., Du, J., & Shen, X.
(2023). Improving YOLOv7-Tiny for Infrared and
Visible Light Image Object Detection on Drones.
Remote Sensing, 15(13).
https://doi.org/10.3390/rs15133214
Lee, J. H., Choi, Y. H., Lee, H. S., Park, H. J., Hong, J. S.,
Lee, J. H., Sa, S. J., Kim, Y. M., Kim, J. E., Jeong,
Y. D., & Cho, H. C. (2024). Enhanced Swine
Behavior Detection with YOLOs and a
Mixed
Efficient Layer Aggregation Network in
Real Time.
Animals, 14(23). https://doi.org/10.3390/ani14233375
Limberg, C., Melnik, A., Harter, A., & Ritter, H.
(2022). YOLO -- You only look 10647 times.
http://arxiv.org/abs/2201.06159
Liu, R., Huang, M., Wang, L., Bi, C., & Tao, Y.
(2024). PDT-YOLO: A Roadside Object- Detection
Algorithm for Multiscale and Occluded
Targets.
Sensors, 24(7). https://doi.org/10.3390/s24072302
Liu, S., Shao, F., Chu, W., Zhang, H., Zhao, D., Xue, J., &
Liu, Q. (2025). LCM-YOLO: A Small Object
Detection
Method for UAV Imagery Based on YOLOv5. IET
Image Processing, 19(1).
https://doi.org/10.1049/ipr2.70051
Lu, Guozhen, Xiong, X., & Lu, D. (2023). Research on
Visualization Method of Edge Banding Appear- ance
Quality Based on YOLOv7.
https://doi.org/10.21203/rs.3.rs-3279477/v1
Mohsan, S. A. H., Khan, M. A., Noor, F., Ullah, I., &
Alsharif, M. H. (2022). Towards the Unmanned
Aerial Vehicles (UAVs): A Comprehensive
Review.
In Drones (Vol. 6, Issue 6). Multidisciplinary
Digital Publishing Institute
(MDPI).
https://doi.org/10.3390/drones6060147
Muzammul, M., Algarni, A., Ghadi, Y. Y., & Assam, M.
(2024). Enhancing UAV Aerial Image
Analysis:
Integrating Advanced SAHI Techniques
with Real-
Time Detection Models on the VisDrone
Dataset. IEEE
Access, 12, 21621–21633.
https://doi.org/10.1109/ACCESS.2024.3363413
Improvement of Unmanned Aerial Vehicle Object Detection Through Scale Optimization and YOLOv7-Tiny Anchor Adjustment
43

Sathyanarayanan, S., & Tantri, B. R. (2024). Confusion
Matrix-Based Performance Evaluation
Metrics.
African Journal of Biomedical Research, 4023–4031.
https://doi.org/10.53555/ajbr.v27i4s.4345
Shim, Y., Choi, S. W., Yang, M. G., Chung, K. Y., &
Baek,
K. H. (2022). Energy Efficient Distance
Computing:
Application to K-Means Clustering.
Electronics
(Switzerland), 11(3).
https://doi.org/10.3390/electronics11030298
Tang, H., Gao, S., Li, S., Wang, P., Liu, J., Wang, S., &
Qian, J. (2024). A Lightweight SAR Image Ship
Detection Method Based on Improved Convolution
and YOLOv7. Remote Sensing, 16(3).
https://doi.org/10.3390/rs16030486
Telçeken, M., Akgun, D., & Kacar, S. (2024). An
Evaluation of Image Slicing and YOLO Architectures
for Object Detection in UAV Images. Applied
Sciences (Switzerland), 14(23).
https://doi.org/10.3390/app142311293
Wang, C.-Y., Bochkovskiy, A., & Liao, H.-Y. M.
(2023). YOLOv7: Trainable bag-of-freebies sets new
state-of-the-art for real-time object detectors.
https://github.com/
Wang, P., Wang, Y., & Li, D. (2024). DroneMOT:
Drone-based Multi-Object Tracking Considering
Detection Difficulties and Simultaneous Moving of
Drones and Objects. http://arxiv.org/abs/2407.09051
Wang, Q., Zhang, Z., Chen, Q., Zhang, J., & Kang, S.
(2024). Lightweight Transmission Line Fault
Detection Method Based on Leaner YOLOv7- Tiny.
Sensors, 24(2). https://doi.org/10.3390/s24020565
Xiao, Y., & Di, N. (2024). SOD-YOLO: A lightweight
small object detection framework. Scientific Reports,
14(1), 25624. https://doi.org/10.1038/s41598-024-
77513-4
Xie, M., Yang, X., Li, B., & Fan, Y. (2024). A YOLO-
Based Method for Head Detection in
Complex
Scenes. Sensors, 24(22).
https://doi.org/10.3390/s24227367
Xu, X., Zhao, M., Shi, P., Ren, R., He, X., Wei, X., &
Yang, H. (2022). Crack Detection and Comparison
Study Based on Faster R-CNN and Mask R-CNN.
Sensors, 22(3). https://doi.org/10.3390/s22031215
Xue, J., Cheng, F., Li, Y., Song, Y., & Mao, T.
(2022). Detection of Farmland Obstacles Based on an
Improved YOLOv5s Algorithm by Using CIoU and
Anchor Box Scale Clustering. Sensors, 22(5).
https://doi.org/10.3390/s22051790
Zhang, Z., Xie, X., Guo, Q., & Xu, J. (2024). Improved
YOLOv7-Tiny for Object Detection Based on UAV
Aerial Images. Electronics
(Switzerland), 13(15).
https://doi.org/10.3390/electronics13152969
Zheng, J., Zhao, S., Xu, Z., Zhang, L., & Liu, J.
(2023). Anchor boxes adaptive optimization
algorithm for maritime object detection in video
surveillance. Frontiers in Marine Science, 10.
https://doi.org/10.3389/fmars.2023.1290931
RITECH 2025 - The International Conference on Research and Innovations in Information and Engineering Technology
44
