
Enhancing ARIMA Model Accuracy for New Master's Student
Enrolment Forecasting at Hasanuddin University Through External
Variable Engineering
Muh. Arief Wicaksono
a
, Ady Wahyudi Paundu
b
and Muhammad Niswar
c
Department of Informatics, Hasanuddin University, Makassar, Indonesia
Keywords: Forecasting, Time Series, ARIMA, ARIMAX, Hierarchical Mode Imputation, Spearman Correlation, New
Student Enrolment.
Abstract: Accurate forecasting of new student enrolment is crucial for effective management and strategic planning in
higher education institutions. This research examines the integration of engineered external variables into the
ARIMAX model to improve the accuracy of forecasting new master’s (S2) student admissions at Hasanuddin
University. The study utilizes applicant data from 2019/2020 to 2024/2025, applying hierarchical mode
imputation to address missing values and Spearman correlation for external variable selection. The results
show that while “Father’s Occupation” has the highest correlation with enrolment numbers, “Mother’s
Education” as an external variable yields the lowest prediction error with a MAPE of 13.21%. These findings
highlight the importance of empirical model validation using MAPE rather than relying solely on correlation
analysis. The approach proposed in this study provides practical insights for university policy makers in
planning student admissions based on robust, data-driven forecasts.
1 INTRODUCTION
Hasanuddin University (UNHAS), a leading public
university in Eastern Indonesia, has consistently
aimed to improve the quality and competitiveness of
its postgraduate programs. The Master’s (S2)
program receives new student enrolments twice
annually through three primary admission tracks:
Regular, Research, and Partnership. Each track has
distinct characteristics, which increases the
complexity of enrolment forecasting and capacity
planning.
Forecasting student enrolment is a fundamental
requirement for effective resource management in
higher education institutions. For Hasanuddin
University, accurate forecasts support strategic
decisions regarding faculty allocation, class quotas,
scholarship distribution, and infrastructure usage.
Failure to anticipate fluctuations in student numbers
may result in inefficiencies and reduced educational
quality. (AIR Professional File, 2021).
a
https://orcid.org/0009-0003-8072-9263
b
https://orcid.org/0000-0002-8761-7892
c
https://orcid.org/0000-0003-2118-9482
Traditional time series models, particularly the
Autoregressive Integrated Moving Average
(ARIMA), have been widely used to predict
enrolment based on historical data (As’Ad et al.,
2017; Hyndman & Athanasopoulos, 2021). While
effective for stationary series, ARIMA models do not
capture the influence of external socio-economic
factors.
Recent research has extended ARIMA into
ARIMAX, which incorporates exogenous variables
(Fang et al., 2017; Zhu et al., 2020). However,
external variable selection remains challenging.
Correlation-based screening may not align with
empirical forecasting accuracy, necessitating a
combined statistical and empirical validation
strategy.
This study applies ARIMA and ARIMAX to
forecast master’s student enrolments at Hasanuddin
University, evaluates multiple external regressors,
and highlights the importance of empirical testing in
variable selection based on the number of students
enrol every semester as seen on Figure 1.
Wicaksono, M. A., Wahyudi Paundu, A. and Niswar, M.
Enhancing ARIMA Model Accuracy for New Master’s Student Enrolment Forecasting at Hasanuddin University Through External Variable Engineering.
DOI: 10.5220/0014265900004928
Paper published under CC license (CC BY-NC-ND 4.0)
In Proceedings of the 1st International Conference on Research and Innovations in Information and Engineering Technology (RITECH 2025), pages 189-195
ISBN: 978-989-758-784-9
Proceedings Copyright © 2025 by SCITEPRESS – Science and Technology Publications, Lda.
189
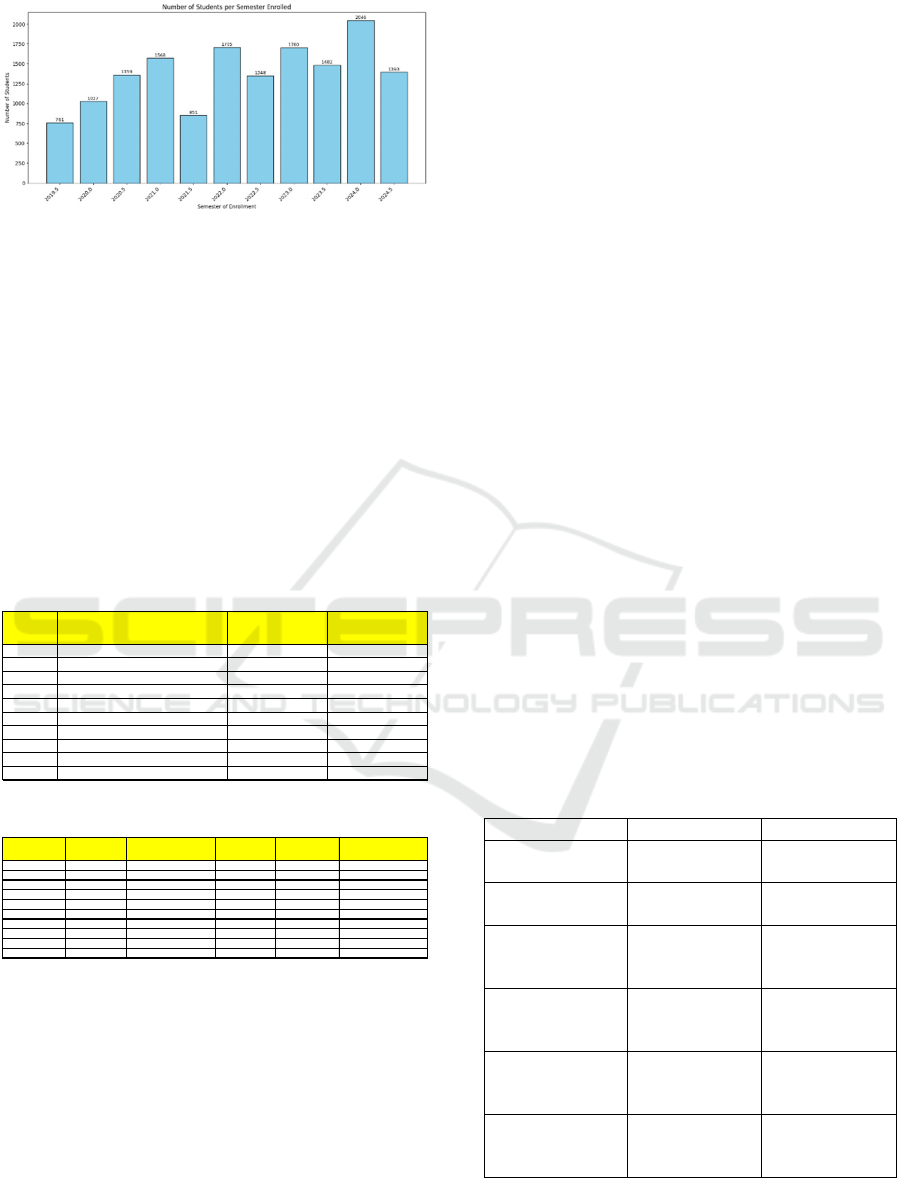
Figure 1: Overview Number of Master’s Student
Enrolment.
2 MATERIALS AND METHOD
2.1 Dataset
The dataset included 15,240 records of master’s
program applicants to Hasanuddin University,
collected across eleven consecutive academic
semesters from 2019/2020 to 2024/2025. Each record
includes information on the semester of enrolment,
study program, geographic origin (city or district) and
parental attributes (education, occupation, and
income) can be seen on Figure 2 & 3.
Figure 2: Overview of student data.
Figure 3: Overview of parental data.
To ensure clarity and reproducibility, the primary
categorical variables and their respective
classifications are delineated as follows:
• Parental Education was recorded as the highest
completed formal schooling, and categorized into:
Kindergarten or equivalent, Elementary School
(SD), Junior High School (SMP), Senior High
School (SMA), Dropout from Elementary,
Diploma levels (D1, D2, D3), Applied Bachelor
(Sarjana Terapan/D4), Bachelor’s Degree (S1),
Master’s (S2), Doctorate (S3), Professional
Degree, as well as medical specializations (Sp-1,
Sp-2).
• Parental Occupation reflects the dominant
employment or economic activity, grouped into:
Private employee, Retired, Government (civil
servant, military, or police), Unemployed,
Entrepreneur/Business owner, other jobs,
Fisherman, Small trader, large trader, Farmer,
Breeder, and laborer.
• Parental Income was documented as monthly
earnings, and sorted into the following brackets
(in Indonesian Rupiah): Below Rp. 500,000; Rp.
500,000–999,999; Rp. 1,000,000–1,999,999; Rp.
2,000,000–4,999,999; Rp. 5,000,000–
20,000,000; and above Rp. 20,000,000.
2.2 Data Preprocessing
Data preprocessing involved multiple stages. First,
data cleaning was performed to remove duplication,
correct formatting inconsistencies, and detect
outliers. Second, missing values were addressed
using a Hierarchical Mode Imputation technique,
which imputes missing categorical values based on
the most frequent categories within specific groups
(e.g., city and parental occupation), before applying
more general groupings and, finally, a global mode.
This approach ensured that the imputation preserved
the representativeness of local data characteristics
and minimized bias in the dataset based on table 1.
(Little & Rubin, 2019; Schafer & Graham, 2002).
Table 1: Hierarchical Mode Imputation Strategy for
Categorical Variables.
Variable Main Grou
p
Backu
p
Grou
p
Father’s
Occu
p
ation
District/City
(
Kab/Kota
)
District/City
Mother’s
Occupation
District/City District/City
Father’s Income District/City +
Father’s
Occu
p
ation
District/City
Mother’s
Income
District/City +
Mother’s
Occu
p
ation
District/City
Father’s
Education
District/City +
Father’s
Occu
p
ation
Father’s
Education
Mother’s
Education
District/City +
Mother’s
Occupation
Mother’s
Education
Semester of
Enrollment
Study Program Province District/City
20201 Ilmu Kebidanan Prop. Sulawesi Selatan Kota Ternate
20221 Keuangan Daerah Prop. Sulawesi Tenggara Kab. Kolaka Utara
20221 Keselamatan dan Kesehatan Kerja Prop. Sulawesi Selatan Kota Makassar
20241 Teknik Sipil Prop. Sulawesi Selatan Kab. Enrekang
20241 Ilmu Komunikasi Prop. Sulawesi Selatan Kab. Enrekang
20202 Arkeologi Prop. Sulawesi Tenggara Kab. Takalar
20202 Ilmu Kebidanan Prop. Sulawesi Selatan Kota Makassar
20221 Ilmu Pemerintahan Prop. Sulawesi Selatan Kab. Sinjai
20221 Ilmu Keperawatan Prop. Sulawesi Selatan Kab. Bone
20231 Agribisnis Prop. Sulawesi Selatan Kota Makassar
Father's Education Father's Occupation Father's Income Mother's Education Mother's Occupation Mother's Income
SMA / sederajat Petani Kurang dari Rp. 500,000 SMP / sederajat T idak Bekerja Kurang dari Rp. 500,000
S2 PNS/TNI/Polri Rp. 5,000,000 - Rp. 20,000,000 S2 PNS/TNI/Polri Rp. 2,000,000 - Rp. 4,999,999
SMA / sederajat Pedagang Kecil Rp. 5,000,000 - Rp. 20,000,000 S1 Tidak Bekerja Kurang dari Rp. 500,000
Sarjana Terapan (D4) Pensiunan Rp. 2,000,000 - Rp. 4,999,999 SMA / sederajat Petani Kurang dari Rp. 500,000
SMA / sederajat Petani Rp. 1,000,000 - Rp. 1,999,999 SD / sederajat Tidak Bekerja Kurang dari Rp. 500,000
SD / sederajat Petani Kurang dari Rp. 500,000 SD / sederajat Petani Kurang dari Rp. 500,000
S2 Petani Rp. 2,000,000 - Rp. 4,999,999 SMA / sederajat Tidak Bekerja Kurang dari Rp. 500,000
S2 PNS/TNI/Polri Rp. 2,000,000 - Rp. 4,999,999 S1 Lainnya Rp. 500,000 - Rp. 999,999
SD / sederajat Wiraswasta Rp. 5,000,000 - Rp. 20,000,000 SD / sederajat Lainnya Kurang dari Rp. 500,000
SMA / sederajat Tidak Bekerja Kurang dari Rp. 500,000 SMP / sederajat Tidak Bekerja Kurang dari Rp. 500,000
RITECH 2025 - The International Conference on Research and Innovations in Information and Engineering Technology
190
2.3 Stationarity Assessment and
Differencing
The time series of semester-wise enrolment counts
was evaluated for stationarity using the Augmented
Dickey-Fuller (ADF) test. Initial assessment
indicated non-stationarity (ADF Statistic = 0.55; p-
value = 0.986). Upon applying first-order
differencing, the series satisfied stationarity criteria
(ADF Statistic = -8.02; p-value = 2.07e-12),
justifying the selection of d=1 for subsequent
ARIMA modelling. (Hyndman & Athanasopoulos,
2021; Box et al., 2015).
2.4 Model Specification and External
Variable Selection
The ARIMA (Autoregressive Integrated Moving
Average) model was applied to forecast new student
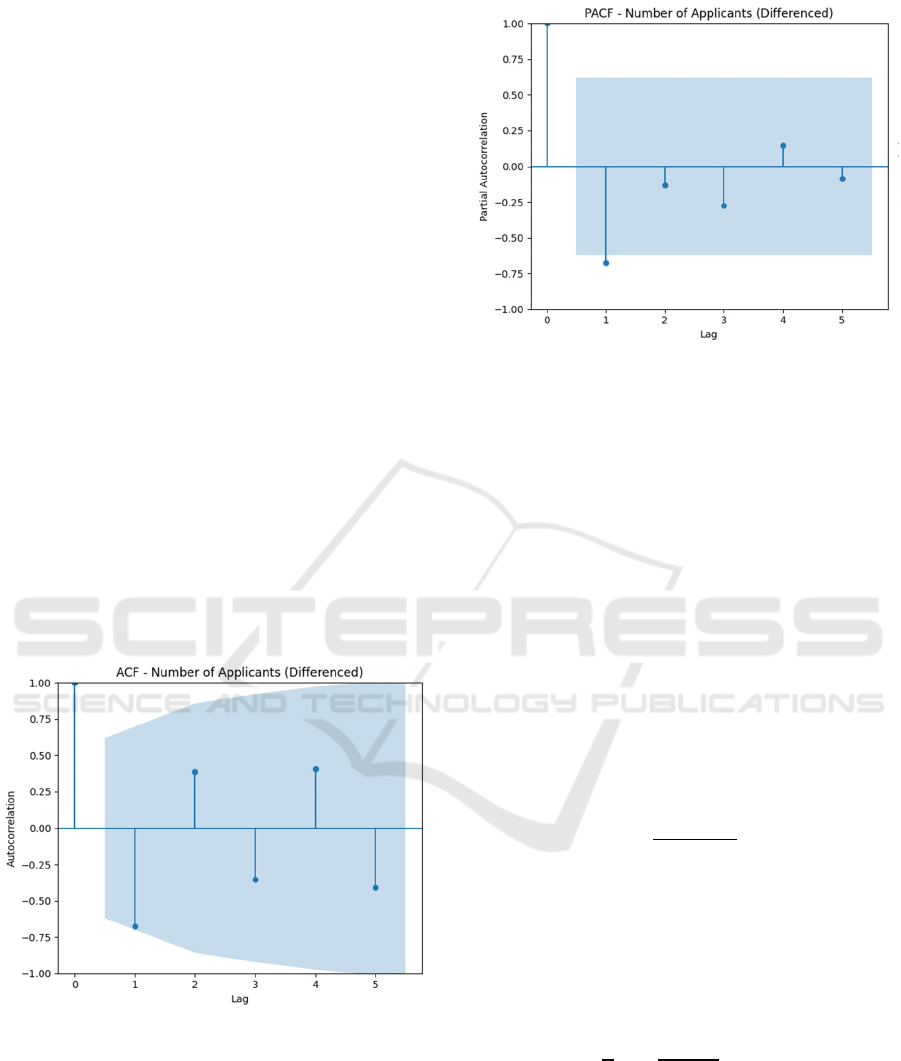
enrolments. The optimal order (p, d, q) was
determined using ACF (Figure 4) and PACF (Figure
5) plots, resulting in ARIMA(1,1,0) as the baseline.
Forecasting models were constructed using both
ARIMA and ARIMAX frameworks. The ARIMA
model is defined as:
𝑌
𝑐 𝜙
𝑌
⋯ ∅
𝑌
𝜃
𝜀
⋯ 𝜃
𝜀
𝜀
(1)
Figure 4: ACF Plot for find q on ARIMA.
Figure 5: PACF Plot for find p on ARIMA.
Where:
• 𝑌
denotes the number of new enrolments at time
𝑡,
• 𝑐 is intercept (constant term),
• 𝜙
and 𝜃
represent autoregressive and moving
average coefficients, respectively,
• 𝜀
is error term (white noise).
The ARIMAX model incorporates an external
regressor as follows:
𝑌
𝑐𝜙
𝑌
⋯ ∅
𝑌
𝜃
𝜀
⋯𝜃
𝜀
𝛽𝑋
𝜀
(2
)
where 𝑋
denotes the value of the external variable at
time 𝑡, and 𝛽 its coefficient.
Candidate external variables were identified
using the Spearman rank correlation coefficient:
𝜌1
6
∑
𝑑
𝑛
𝑛
1
(3
)
where 𝑑
is the difference between the ranks of paired
values, and 𝑛 the number of observations.
2.5 Model Evaluation
The predictive accuracy of each model was assessed
using the Mean Absolute Percentage Error (MAPE):
𝑀𝐴𝑃𝐸
1
𝑛
𝐴
𝐹
𝐴
𝑋100%
(4
)
where 𝐴
is the actual observed value, 𝐹
the
forecasted value, and 𝑛 the number of prediction
periods.
Enhancing ARIMA Model Accuracy for New Master’s Student Enrolment Forecasting at Hasanuddin University Through External Variable
Engineering
191
3 RESULTS
3.1 Baseline ARIMA Model
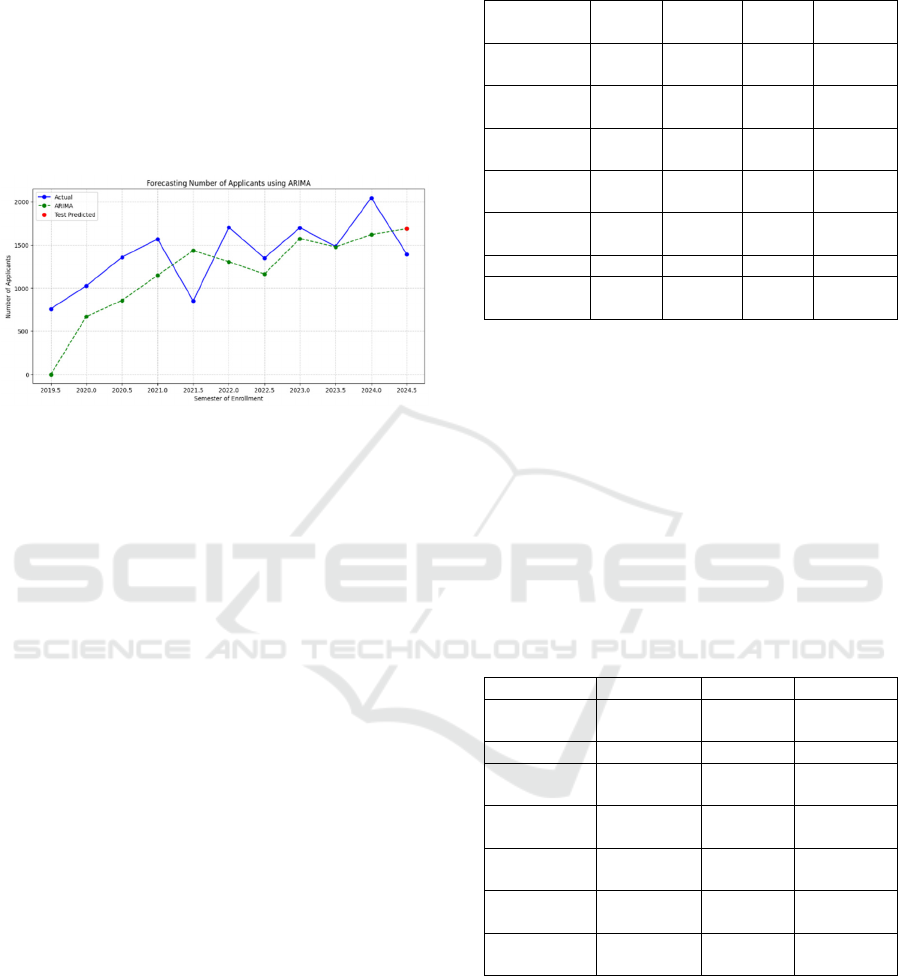
The ARIMA (1,1,0) model achieved a MAPE of
21.18% can be seen on Figure 6. Forecast plots
indicated that the model captured overall trends but
failed to account for certain fluctuations, likely
influenced by external socio-economic factors.
Figure 6: ARIMA(1,1,0) forecasting results (MAPE:
21.18%).
3.2 Evaluation of External Variable
Suitability
Each exogenous candidate was first tested for
stationarity using the Augmented Dickey–Fuller
(ADF) test. Among the seven socio-demographic
attributes, Father’s Education, Father’s Income, and
Mother’s Income were found stationary (p < 0.05),
while the remaining series were constant after
semester-level aggregation. Cross-correlation
analysis within ±3 semesters revealed no pronounced
lag structure, indicating that these socioeconomic
indicators change slowly and act as stable contextual
predictors rather than dynamic lagged drivers of
postgraduate enrolment.
To quantify the contribution of each variable, we
compared baseline ARIMA (1,1,0) with
corresponding ARIMAX (1,1,0) models using
Akaike (AIC) and Bayesian (BIC) information
criteria. ARIMAX achieved lower AIC/BIC for
Father’s Education, Father’s Occupation, Mother’s
Education, and District/City, suggesting improved
model fit despite low short-term correlation. Hence,
these variables were retained as meaningful external
factors guided by both information-criterion evidence
and logical socioeconomic relevance as seen on Table
2.
Table 2: AIC/BIC Comparison using ARIMA and
ARIMAX.
Variable
A
IC_ARI
MA
AIC_ARI
MAX
B
IC_ARI
MA
B
IC_ARIM
AX
Father's
Education
136.48 129.80 136.88 130.39
Father's
Occu
p
ation
136.48 129.80 136.88 130.39
Father's
Income
136.48 135.78 136.88 136.37
Mother's
Education
136.48 130.78 136.88 131.37
Mother's
Occupation
136.48 138.46 136.88 139.05
District/Cit
y
136.48 134.79 136.88 135.38
Mother's
Income
136.48 138.48 136.88 139.07
3.3 ARIMAX and External Variable
Evaluation
Feature Selection was conducted using Spearman
Rank Correlation to assess the monotonic relationship
between each external variable and the number of
enrolled students. This step allowed the identification
of variables that were statistically significant and
potentially influential in improving the predictive
performance of the model and the result can be seen
on Table 3.
Table 3: Spearman correlation results for candidate external
variables.
Variable Correlation
p
-value Conclusion
Father's
Occupation
0.242415 0.008173 Significant
District/Cit
y
0.066133 0.011096 Significant
Father's
Income
0.292156 0.020156 Significant
Mother's
Occu
p
ation
0.203527 0.020205 Significant
Mother's
Income
-0.204457 0.099615
Not
Si
g
nificant
Father's
Education
0.035446 0.680915
Not
Significant
Mother's
Education
0.027638 0.744932
Not
Si
g
nificant
When external variables were introduced,
forecasting accuracy improved significantly. The
results are summarized on Table 4 below.
RITECH 2025 - The International Conference on Research and Innovations in Information and Engineering Technology
192
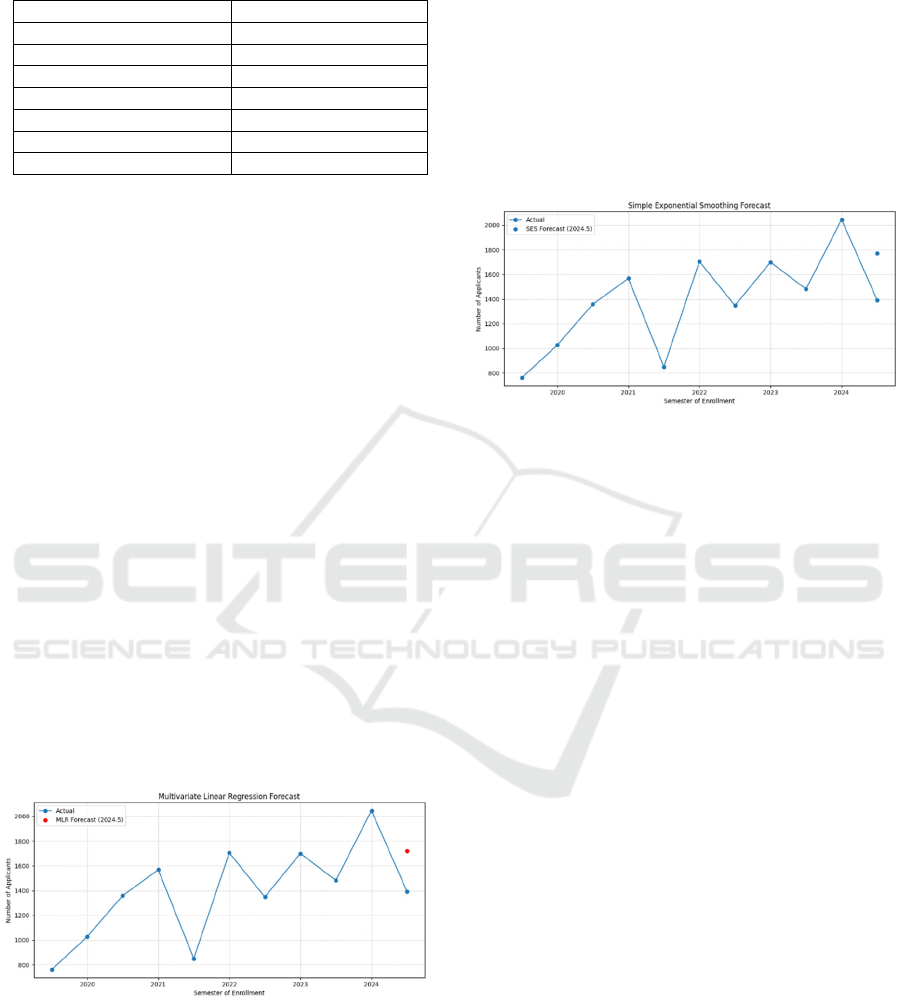
Table 4: Comparison of MAPE for ARIMAX Models with
Different External Variables.
External Variable MAPE
Mother’s Education 13.21%
Father’s Occupation 15.22%
Father’s Education 15.22%
Father’s Income 16.44%
Mother’s Income 21.18%
Mother’s Occupation 31.01%
District/Cit
y
43.72%
3.4 Multivariate Linear Regression
(MLR)
To incorporate cross-sectional structure without time-
series dynamics, we estimated a Multivariate Linear
Regression using a one-semester lag of enrolment and
one-hot encoded exogenous variables (parents’
education, occupation, income, and District/City).
The lag term prevents information leakage and allows
the model to exploit persistence in the series while
capturing level shifts associated with socio-
demographic context.
On the 2024.5 hold-out, MLR forecast = 1719
applicants with MAPE = 23.40% (Figure 7). In most
folds of the rolling window (see Appendix), the
coefficient on the lag term remained positive and
significant, confirming strong short-run persistence,
whereas the contribution of categorical exogenous
terms was modest but directionally consistent with
socioeconomic expectations (e.g., categories
associated with higher parental education tended to
align with higher enrolment levels). These results
indicate that MLR is a competitive cross-sectional
baseline that benefits from the autoregressive signal
embedded in the lag feature.
Figure 7: Multivariate Linear Regression (MLR)
forecasting result (MAPE : 23.40%).
3.5 Simple Exponential Smoothing
(SES)
As a parsimonious time-series benchmark, we fit a
Simple Exponential Smoothing model to the training
window (≤2024.0) with the smoothing level 𝛼
estimated from the data. SES captures a time-varying
level without imposing trend or seasonality
appropriate given the short history and semester
granularity.
The SES forecast = 1772 applicants for 2024.5
with MAPE = 27.21% (Figure 8). As expected for a
level model, SES tends to under-react to abrupt
inflections but provides a transparent baseline that
smooths transitory fluctuations.
Figure 8: Simple Exponential Smoothing (SES) forecasting
result (MAPE : 27.21%).
3.6 Comparative Performance of
Added Baselines (MLR, SES) vs
ARIMA/ARIMAX
We compared the two additional baselines
Multivariate Linear Regression (MLR; with a one-
semester lag and one-hot socio-demographics) and
Simple Exponential Smoothing (SES; level only)
against the ARIMA(1,1,0) baseline and ARIMAX
variants trained on semesters ≤ 2024.0 and evaluated
on 2024.5. (Chen, 2022; James & Weese, 2022).
Single-step accuracy on the 2024.5 hold-out
shows that the best ARIMAX specification (Mother’s
Education) delivered the lowest error with MAPE =
13.21% (forecast = 1,577), i.e., a 37.63% error
reduction relative to ARIMA (Table 5). ARIMAX
with Father’s Education or Father’s Occupation also
improved accuracy (MAPE = 15.22%). ARIMAX
with Father’s Income was beneficial (MAPE =
16.44%), while Mother’s Income was neutral (MAPE
= 21.18%) In contrast, Mother’s Occupation and
District/City degraded performance (MAPE =
31.01% and 43.72%).
MLR forecasted 1,719 with MAPE = 23.40%, and
SES forecasted 1,772 with MAPE = 27.21%. This
pattern is consistent with the short series and the
strong autoregressive signal: MLR benefits from the
lag but its linear level-shifts from one-hot socio-
demographics are modest; SES provides a
Enhancing ARIMA Model Accuracy for New Master’s Student Enrolment Forecasting at Hasanuddin University Through External Variable
Engineering
193

conservative smoothed level that under-reacts to
recent inflections.
Table 5: Comparison of MAPE for ARIMA, ARIMAX,
MLR, SES.
Model
External
variable(s)
Forecast
MAPE
(%)
ARIMA(1,1,0)
–
1,688 21.18
ARIMAX(1,1,0) Mother’s
Education
1,577 13.21
ARIMAX(1,1,0) Father’s
Education
1,605 15.22
ARIMAX(1,1,0) Father’s
Occupation
1,605 15.22
ARIMAX(1,1,0) Father’s
Income
1,622 16.44
ARIMAX(1,1,0) Mother’s
Income
1,688 21.18
ARIMAX(1,1,0) Mother’s
Occupation
1,825 31.01
ARIMAX(1,1,0) District/City 2,002 43.72
MLR (lag-1 + one-
hot exog)
All socio-
demographics
1,719 23.4
SES (level only) – 1,772 27.21
3.7 Comparison with Related Work
ARIMAX vs ARIMA. Similar to Chang et al., who
evaluated student participation in STEM programs
using ARIMAX with cross-correlation checks to
select lags for exogenous series, we find that adding
well-motivated external variables improves
parsimony-adjusted fit and accuracy; in our case,
Mother’s Education produced the largest error
reduction (MAPE 13.21% vs. ARIMA’s 21.18%).
Their study likewise advocates CCF-guided
ARIMAX specification and reports that ARIMAX
outperforms ARIMA when the auxiliary series carries
signal pertinent to enrolment dynamics.
Role of exponential smoothing. Prior work in
secondary and higher-education contexts shows that
exponential smoothing can be competitive sometimes
best when series are short and level-dominated; for
example, a comparative study found exponential
smoothing delivered the highest stability/accuracy on
regional enrolment shares. In our data, SES was a
useful low-complexity benchmark but
underperformed ARIMAX (MAPE 27.21% vs.
13.21%), likely because our target exhibits recent
shifts that benefit from differencing and exogenous
structure. (Makridakis et al., 2022 special issue;
Xiang et al., 2023)
ARIMA baselines in HEI settings. Studies
focused purely on ARIMA in university admissions
(e.g., HEI cases using AIC/BIC selection) underline
the value of Box-Jenkins baselines and information-
criterion model choice an approach we also adopt
before extending to ARIMAX. Our ARIMA(1,1,0)
baseline (MAPE 21.18%) aligns with the reported
effectiveness of simple ARIMA in short
administrative series, while leaving room for
improvement via exogenous inputs.
Linear regression with contextual covariates.
Multiple linear regression is widely used to explain or
predict admission outcomes using applicant or
contextual variables; these works support our
inclusion of an MLR baseline (Chen, 2022; James &
Weese, 2022) that leverages a lag of the target and
one-hot socio-demographic covariates. Consistent
with that literature, our MLR captures level
differences but remains less accurate than the best
ARIMAX on our one-step horizon (23.40% vs.
13.21%).
Synthesis. Across studies, two themes recur: (i)
judicious exogenous selection guided by domain
logic and cross-correlation tends to improve forecasts
over ARIMA alone, and (ii) exponential smoothing is
a robust benchmark for short, level-dominated series.
Our results mirror both patterns: ARIMAX with a
socio-educational driver (Mother’s Education)
materially outperforms ARIMA/SES/MLR, whereas
exogenous variables with weak temporal variation
(e.g., District/City) degrade accuracy paralleling
reports that noisy or poorly aligned covariates can
worsen out-of-sample performance.
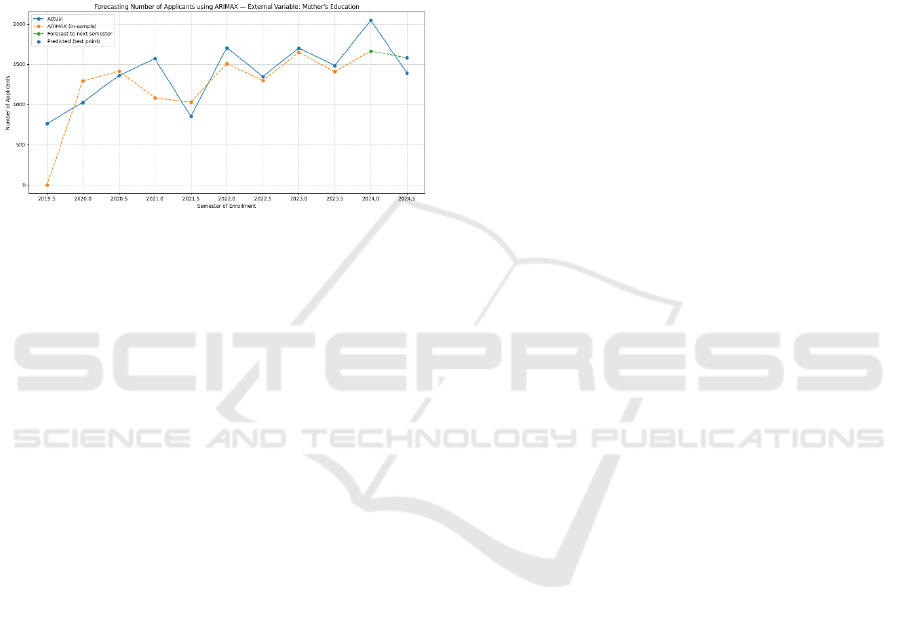
4 DISCUSSIONS
The results indicate that external variables can
improve accuracy when carefully selected and
validated. Although Father’s Occupation shows the
highest simple correlation, ARIMAX with Mother’s
Education produces the largest gain (MAPE 13.21%
vs. ARIMA 21.18%), consistent with evidence that
exogenous terms should be screened on stationarity,
cross-correlation, and information criteria rather than
correlation alone (Hyndman & Athanasopoulos,
2021; Box et al., 2015). Table 2 documents AIC/BIC
reductions for Mother’s/Father’s Education and
Father’s Occupation, while Figure 9 illustrates the
one-step forecast trajectory for the selected ARIMAX
specification. These improvements align with the
notion that parental education captures academic
capital and affordability, plausibly linked to
postgraduate decision-making.
Baseline comparisons clarify where the
incremental gains come from. The ARIMA(1,1,0)
baseline captures short-run persistence after
differencing, whereas SES provides a transparent
level model that under-reacts to recent shifts, leading
RITECH 2025 - The International Conference on Research and Innovations in Information and Engineering Technology
194
to higher error (27.21%). MLR employs a lag-1
feature plus one-hot socio-demographics; it captures
level differences but remains above the best
ARIMAX (23.40% vs. 13.21%). Figures 7–8 display
the MLR and SES one-step predictions relative to
actual counts, and Table 3 summarizes single-step
accuracy across all contenders. These patterns match
prior reports where exponential smoothing is a strong
low-complexity benchmark but is surpassed when
well-aligned exogenous structure is available (Chen,
2022; James & Weese, 2022).
Figure 9: ARIMAX forecasting using Mother’s Education
as External Variable (MAPE : 13.21%).
Comparisons with related studies reinforce these
conclusions. In applied forecasting benchmarks (e.g.,
M5), models that exploit exogenous information and
cross-series structure tend to outperform purely
univariate baselines—supporting our ARIMAX
findings and the use of AIC/BIC for parsimony
(Makridakis et al., 2022; special issue overview).
Figure 1 and Figure 2 situate our series characteristics
and ARIMA baseline, respectively, within the Box-
Jenkins framework (ARIMA identification,
diagnostics) (Box et al., 2015; Hyndman &
Athanasopoulos, 2021). For education planning,
demography-linked approaches (e.g., STEP)
emphasize coherent transitions and cohort structure,
which we identify as future exogenous candidates to
test alongside policy and macro variables (Xiang et al.,
2023; AIR Professional File, 2021).
Despite these contributions, limitations remain.
The exogenous set is restricted to socio-demographics
observed at application; macroeconomic indicators,
tuition/fee schedules, and scholarship budgets were
unavailable. The short history (11 semesters)
constrains the power of multi-lag analyses and the
exploration of seasonal dynamics. Future work should
expand the horizon and exogenous sources, and
benchmark hybrid/ensemble approaches (e.g.,
ARIMA-LSTM) while keeping administrative
interpretability (Jain et al., 2024; Wang et al., 2024).
Figure 10 (Appendix) may report residual diagnostics
(Ljung-Box) to accompany Table 2 comparisons and
ensure no remaining autocorrelation (Hyndman &
Athanasopoulos, 2021).
REFERENCES
As’Ad, M., Wibowo, S. S., & Sophia, E. (2017).
Forecasting student enrolment with ARIMA. Jurnal
Informatika Merdeka Pasuruan, 2(3).
Fang, X., Zhang, Q. and Wu, Y. (2017). Student enrolment
prediction model based on data mining. IEEE
International Conference on Computational Science
and Engineering.
Hyndman, R. J. and Athanasopoulos, G. (2021).
Forecasting: Principles and Practice (3rd ed.). OTexts.
Box, G. E. P., Jenkins, G. M., Reinsel, G. C. and Ljung, G.
M. (2015). Time Series Analysis: Forecasting and
Control (5th ed.). Wiley.
Makridakis, S., Spiliotis, E. and Assimakopoulos, V.
(2022). M5 accuracy competition: Results, findings,
and conclusions. International Journal of Forecasting,
38(4), 1346–1364.
Makridakis, S., Spiliotis, E. and Assimakopoulos, V.
(2022). M5 competition special issue: Background and
organization. International Journal of Forecasting,
38(4).
Chen, Q. (2022). A comparative study on the forecast
models of the enrollment proportion of general and
vocational education. International Education Studies,
15(6), 109–126.
James, F. and Weese, J. (2022). Neural network-based
forecasting of student enrollment with exponential
smoothing baseline. ASEE Annual Conference &
Exposition.
Xiang, L. et al. (2023). The School Transition Estimation
and Projection (STEP) model. Population, Space and
Place, 29(8), e2681.
Bowman, R. A. (2021). Student trajectories for enrollment
forecasting, management, and planning (AIR
Professional File No. 153). Association for Institutional
Research.
Statsmodels documentation. (2024). Simple exponential
smoothing (SES) and ETS. Statsmodels.
Jain, S. et al. (2024). A novel ensemble ARIMA–LSTM
approach for time-series forecasting. PLOS ONE,
19(6), e0303103.
Wang, B. et al. (2024). ARIMA–LSTM for time-series
prediction (methodology article). BMC / PMC article.
Deogratias, E. (2024). Forecasting students’ enrolment in
Tanzania government primary schools (2021–2035).
International Journal of Computing and Informatics.
Loder, A. K. F. (2025). Predicting the number of “active”
students for funding management. Journal of Student
Financial Aid.
Little, R. J. A. and Rubin, D. B. (2019). Statistical Analysis
with Missing Data (3rd ed.). Wiley.
Schafer, J. L. and Graham, J. W. (2002). Missing data: Our
view of the state of the art. Psychological Methods,
7(2), 147–177.
Enhancing ARIMA Model Accuracy for New Master’s Student Enrolment Forecasting at Hasanuddin University Through External Variable
Engineering
195
