
Key Drivers of Consumer Purchase Decisions in Short Video
Platform Promotions
Haifeng Guo
UTS Business School, University of Technology Sydney, Sydney, 2007, Australia
Keywords: Digital Marketing, Data-Driven Marketing Decisions, Social Media Analytics, Behavioral Data Mining,
Business Analytics.
Abstract: With the rapid development of short video platforms, self-media marketing has emerged as a central strategy
in digital brand promotion. Although existing studies suggest that the number of comments on short video
advertisements may positively impact product sales, the role of comment content remains inconclusive. To
investigate this further, this study integrates survey responses with web-scraped datasets and applies
regression analysis to assess the relationship between user engagement and brand sales performance. The
results demonstrate a significant positive correlation between comment volume and sales figures on both
Douyin and Taobao, even when comments do not explicitly mention the brand. This may be due to the
influence of non-brand-related factors, including influencer appearance or emotional expression. Furthermore,
the findings reveal that high-income consumers tend to show stronger purchasing power and reduced price
sensitivity, yet their overall participation in short video e-commerce remains relatively low, highlighting
untapped market potential.
1 INTRODUCTION
With the widespread adoption of mobile internet and
the rapid rise of short video platforms, digital
marketing has become a vital strategic tool for
interaction between businesses and consumers
(Ratchford et al., 2022). Platforms such as Douyin and
TikTok have reshaped the way brand value is
communicated by offering highly interactive and
immersive environments, which in turn subtly
influence user attitudes and behaviours (Li & Xia,
2022; Tiago & Veríssimo, 2014). As consumers
increasingly rely on digital content to guide their
purchasing decisions, the effectiveness of short video
advertising has emerged as a significant topic within
the field of marketing communications.
Previous research has highlighted the importance
of advertising content characteristics, the role of key
opinion leaders (KOLs), and social interaction in
driving user engagement and purchase intention
(Zhang & Zhang, 2024; Chen & Liao, 2021).
However, the way in which these factors interact
across different platform environments remains
underexplored. In addition, the dynamic nature of
promotional content and algorithmic recommendation
systems poses challenges in evaluating the long-term
impact of brand communication (Lamberton &
Stephen, 2016).
This study focuses on the relationship between
media richness, KOL characteristics, interactivity, and
consumer purchase behaviour in the context of short
video advertising. By combining regression analysis
with visualisation tools, the study aims to identify the
variables most closely associated with sales
performance and user response, offering strategic
insights for marketers seeking to optimise digital
advertising campaigns across varied social media
ecosystems.
2 METHOD
This study investigates the key factors through which
short video platform promotions influence consumer
purchase decisions. Given the complex interplay of
subjective and objective variables involved in such
decisions, a mixed-methods approach was adopted,
combining questionnaire-based surveys with web data
extraction for enhanced reliability.
The questionnaire was designed with reference to
Wang and Li (2023), whose framework explored how
642
Guo, H.
Key Drivers of Consumer Purchase Decisions in Short Video Platform Promotions.
DOI: 10.5220/0013998000004916
Paper published under CC license (CC BY-NC-ND 4.0)
In Proceedings of the 2nd International Conference on Public Relations and Media Communication (PRMC 2025), pages 642-647
ISBN: 978-989-758-778-8
Proceedings Copyright © 2025 by SCITEPRESS – Science and Technology Publications, Lda.

social and technological affordances shape consumer
responses to embedded advertising. Additionally, Liu
and Chen (2024) demonstrated that short-form user-
generated video content (UGC) is significantly more
persuasive in driving purchase intent than traditional
image- or text-based formats. Drawing on these
insights, the survey focused on key constructs such as
frequency of interaction, preference for UGC, brand
identification, and actual purchase intent. The final
questionnaire comprised three sections: demographic
profiling, behavioural variables, and attitudinal
measures. It included closed-ended questions,
multiple-choice items, and a set of 5-point Likert scale
statements aimed at quantifying key psychological
and behavioural dimensions. In order to verify internal
consistency, both reliability and validity assessments
were undertaken to ensure the instrument’s robustness
before large-scale deployment.
The survey was disseminated via major social
platforms including WeChat, Xiaohongshu, and
Douyin, targeting users who regularly engage with
fashion-related content. Respondents were required
to follow a minimum of five fashion influencers to be
eligible. A total of 200 valid responses were collected
over the course of one month. The majority of
participants were aged 19 to 25, lived in tier-one
cities, and reported monthly income ranging from
RMB 10,000 to 20,000—an income bracket consistent
with high digital consumption behaviour in China’s
urban youth segment. In parallel, web-scraped data
were gathered using a Python-based crawler, which
retrieved promotional video statistics—namely likes
and comments—from 30 fashion-related KOLs on the
Douyin platform. To supplement this, sales data
corresponding to these KOLs ’ promoted brands
were collected from both Douyin and Taobao,
enabling a comparative assessment of platform-
specific performance and the influence of consumer
interaction metrics. Data collection occurred between
February 2024 and February 2025.
Following preprocessing in Python, the dataset
was cleaned and analysed using Microsoft Excel,
with regression analysis applied to explore variable
relationships. This study complied fully with research
ethics guidelines: all participants gave informed
consent, remained anonymous, and the collected data
were used exclusively for academic research.
3 RESULTS
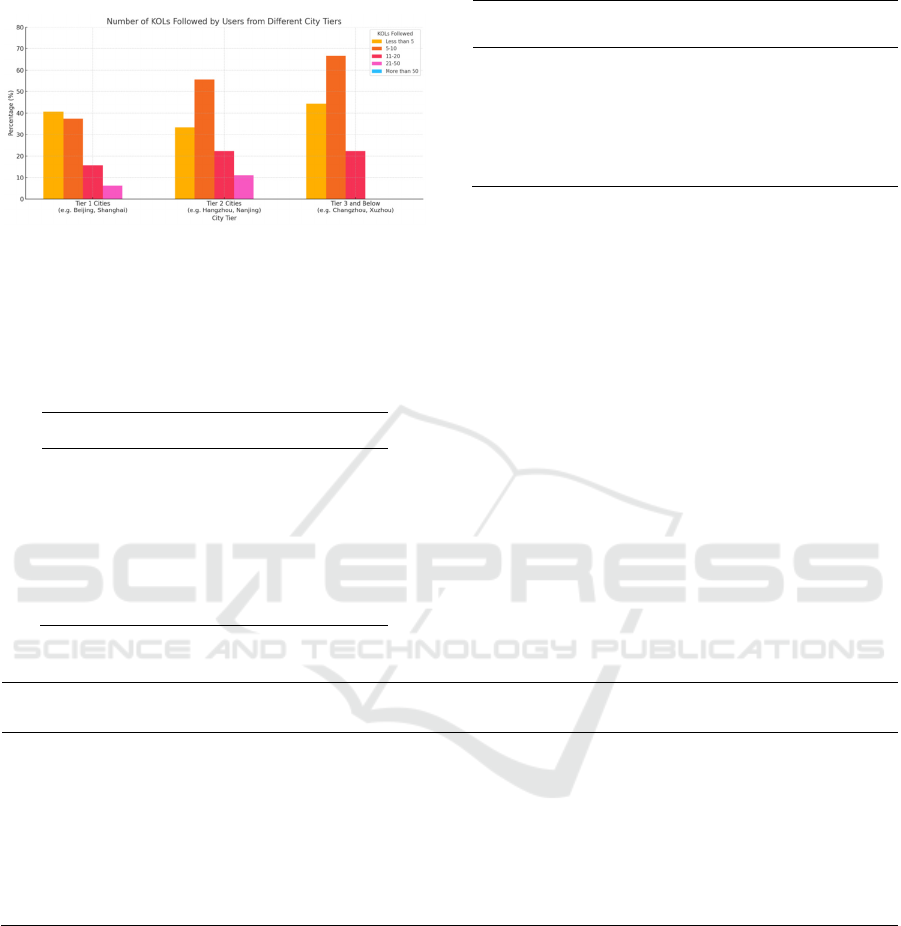
In total, 200 valid questionnaires were collected and
analysed for this research. Among all city tiers, users
who followed 11–20 fashion influencers accounted for
the largest proportion, representing 46% of the sample
(see Figure 1). In terms of income distribution, 38% of
respondents reported monthly earnings in the RMB
10,000 – 20,000 range, which corresponds with the
sample's urban composition and higher engagement
with fashion-related digital content. The survey
findings indicate that 96% of respondents believe that
positive user comments and favourable brand-related
reviews increase their sense of brand identification.
This underscores the critical role of social proof in
shaping consumer perceptions, suggesting that peer
feedback and community sentiment have a significant
influence on individual attitudes toward fashion
brands.
To assess the correlation between user
engagement metrics and brand-related comment
content, linear regression analysis was conducted on
data from 30 key opinion leaders (KOLs) active on the
Douyin platform. The results revealed a low
explanatory power, with an R ² value of 0.073,
indicating that likes and comments together explained
only 7.3% of the variation in the dependent variable
(see Table 1). The overall model failed to reach
statistical significance (Significance F = 0.357), and
the individual p-values for likes and comments were
0.247 and 0.945 respectively, both well above the 0.05
significance threshold (see Tables 2 and 3). These
findings suggest that there is no statistically significant
linear relationship between the volume of engagement
and whether the comments contain brand-related
content. As shown in Figure 2, the age group of 36–45
has the highest proportion of consumers purchasing
high-end fashion, reaching 67%. In contrast, the 19–
25 age group demonstrates the strongest preference
for fast fashion, with 46% of respondents opting for it.
This suggests that consumers aged 36–45 are more
inclined towards premium fashion brands, whereas
those under 25 tend to favour fast fashion options. As
shown in Figure 3, 75% of individuals with a monthly
income between 3,000 and 6,000 opt for fast fashion,
while 40% of those earning over 20,000 tend to choose
high-end fashion. This pattern closely aligns with
variations in income levels across age groups, further
highlighting the significant role of economic capacity
in shaping consumer purchasing behaviour. Finally,
regression models examining the relationship between
comment volume and platform-based sales
performance demonstrated a clear positive correlation.
The model for Douyin yielded an R² of 0.700 and a
regression coefficient of 10.042, while the Taobao
model recorded an R² of 0.565 and a coefficient of
8.645 (see Tables 4). Both results were statistically
significant; however, the Douyin model demonstrated
a stronger fit, indicating that in-platform comment
Key Drivers of Consumer Purchase Decisions in Short Video Platform Promotions
643
engagement is a more effective driver of sales
performance within the short video ecosystem.
Alt Text for the figure: A bar chart showing that Tier 1 users
follow more KOLs than Tier 3 users, mainly in the 11–20
range.
Figure 1 Number Of KOLs Followed By Users From
Different City Tiers
Table 1. Regression Statistics between Comments
and
Brand-Related Comments 1
Regression Statistics
Multiple R 0.271
R Square 0.073
Adjusted R Square 0.005
Standard Erro
r
14.382
Observations 30
Table 2. Regression Statistics between Comments and
Brand-Related Comments 2
d
f
SS
M
S
F
Significa
nce F
Regress
ion
2442.3
60
221.1
80
1.0
69
0.357
Residua
l
2
7
5584.
44
206.8
31
Total 2
9
6026.
8
Table 3. Regression Statistics between Comments and Brand-Related Comments 3
Coefficients Standard
Error
t Stat P-
value
Lower
95%
Upper
95%
Lower
95.0%
Upper
95.0%
Intercept 13.454 7.803 1.724 0.096 -2.557 29.465 -2.557 29.465
Total Likes
on Promo
Videos
3.46E-05 2.92E-05 1.183 0.247 -2.5E-
05
9.46E-
05
-2.5E-
05
9.46E-
05
Total
Comments
on Promo
Videos
-0.000 0.002 -0.070 0.945 -0.005 0.004 -0.005 0.004
PRMC 2025 - International Conference on Public Relations and Media Communication
644
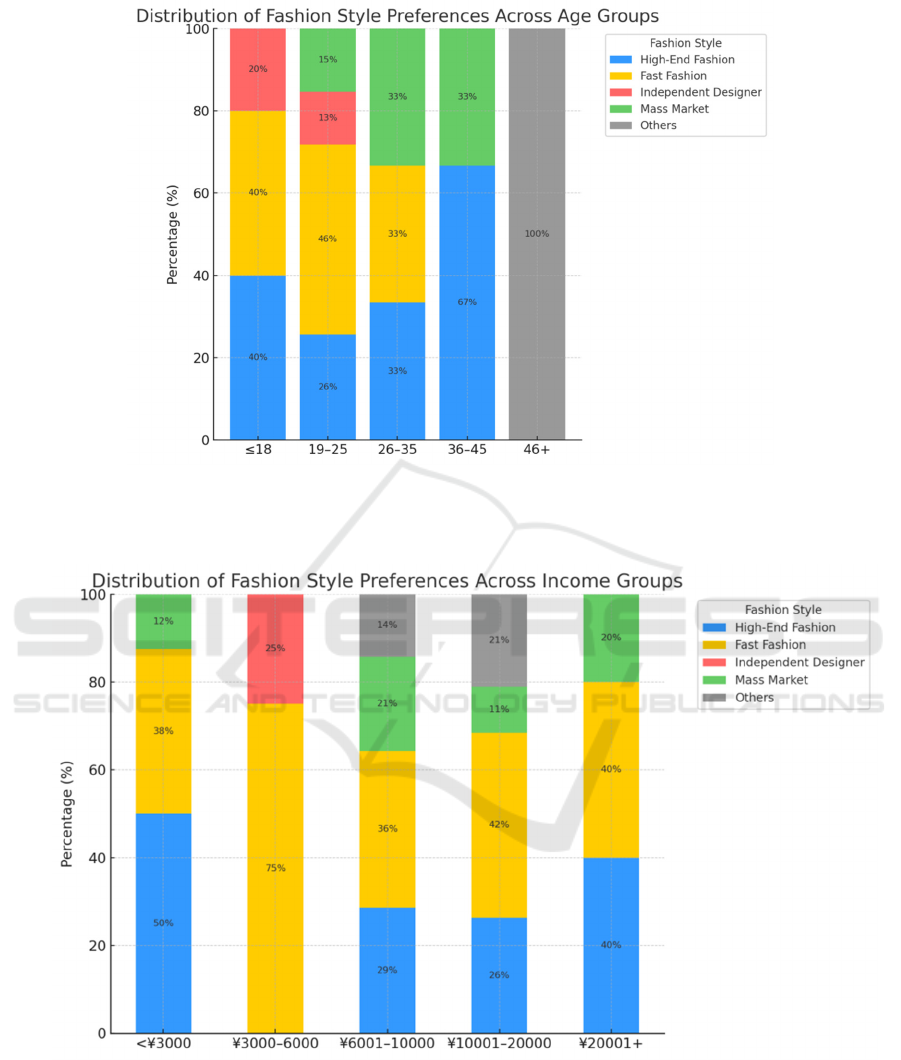
Alt Text for the figure: A stacked bar chart illustrating fashion style preferences by age group, where users aged 36–45
prefer high-end fashion and those under 25 favour fast fashion.
Figure 2. Distribution Of Fashion Style Preferences Across Age Groups
Alt Text for the figure: A stacked bar chart showing fashion style choices across different income brackets, indicating that
higher-income groups tend to prefer luxury or designer brands.
Figure 3. Distribution Of Fashion Style Preferences Across Income Groups
Key Drivers of Consumer Purchase Decisions in Short Video Platform Promotions
645

Table 4. Regression Analysis of Comment Volume and Sales Performance on Two Platforms
Metric Douyin Taobao
Multiple R 0.837 0.752
R Square 0.700 0.565
Adjusted R Square 0.690 0.550
Standard Error 3355.254 3873.493
Observations 30 30
F-statistic 65.437 36.387
Significance F 8.29E-09 1.68E-06
Intercept -890.733 469.061
Total Comments Coefficient 10.042 8.645
Intercept P-value 0.564 0.792
Total Comments P-value 8.29E-09 1.68E-06
Intercept Lower 95% -4013.96 -3136.57
Intercept Upper 95% 2232.496 4074.69
Total Comments Lower 95% 7.499 5.709
Total Comments Upper 95% 12.585 11.581
4 DISCUSSION
This study found that there was no significant
relationship between the number of brand-related
comments and likes and the extent to which brand
names were mentioned in user comments. However,
the number of comments was positively and
significantly associated with sales performance
across both in-platform (Douyin) and external
(Taobao) channels. One possible explanation for this
phenomenon is that the KOLs selected for promotion
were not fashion-specific influencers but rather
beauty-oriented figures whose content tended to
focus more on personal image, emotional expression,
or general interaction, rather than on brand-specific
messaging. This likely introduced noise into the
dataset, thereby weakening the explanatory power of
the regression analysis. Although the presence of
brand mentions in comments could not be effectively
predicted by the volume of interaction, further
regression analysis revealed that promotional
activities—despite not being within a highly vertical
content domain—still had a significant and positive
effect on brand sales, both within and outside the
platform. These findings align with the research
results of Li and Xia (2022), who underscored the
critical role of interactivity in advertising
effectiveness, and also support Ge et al.’s (2021)
argument that, in the context of short video
advertising, “ engagement outweighs content. ”
Based on these insights, it is recommended that
brands guide users to focus their comments and
feedback more directly on the product itself, thereby
enhancing the brand relevance of the comment
content. Strengthening this relevance can improve the
predictive value of comments as indicators of sales
performance. Prior studies have shown that the
characteristics of opinion leaders — such as
professionalism, interactivity, and credibility — can
significantly boost consumer trust and engagement,
which in turn drive purchase intention (Lin & Huang,
2020; Feng, Sun, & Tang, 2025). Enhancing brand-
focused engagement is therefore instrumental in
strengthening brand associations and improving
conversion efficiency. In addition, the research
highlights that high-income consumers tend to be less
sensitive to price fluctuations during the decision-
making process (Wang, 2023). This demographic is
more inclined to pay a premium for high-quality,
trusted brands rather than being influenced solely by
price. However, the penetration of this consumer
segment in short video e-commerce remains
relatively limited. As such, brands should further
refine their audience segmentation strategies,
optimise content design, and adopt personalised
targeting approaches to more effectively reach these
high-potential but currently underserved consumer
groups.
5 CONCLUSION
This study finds that although the number of
comments is not significantly linearly associated with
whether the content of those comments refers to the
brand, it is nonetheless positively and significantly
PRMC 2025 - International Conference on Public Relations and Media Communication
646

correlated with sales performance across both in-
platform and external channels. This correlation was
particularly strong on Douyin, where the model
demonstrated a better fit. These results suggest that
the volume of comments may influence sales
regardless of whether the comments themselves
explicitly mention the brand. Moreover, the effect of
promotion is not limited to the platform on which the
content appears, indicating spill-over impact. The
research also highlights that high-income consumers
are relatively insensitive to price when purchasing
high-end fashion products, revealing a segment with
strong purchasing power that brands should
strategically target. These findings contribute to the
existing literature by addressing the underexplored
relationship between engagement metrics in short
video advertising and sales performance, offering
both theoretical insights and empirical evidence to
inform more refined content strategies and high-value
customer targeting in the context of digital marketing.
Nevertheless, this study is not without limitations.
The sample size was relatively small, and the analysis
did not account for the emotional tone or semantic
structure of user comments. Additionally,
multidimensional characteristics of KOLs— such as
gender, professional background, or content
specialisation—were not considered. Future research
could adopt natural language processing techniques
to explore sentiment and textual features of user
comments in greater depth. Expanding the sample
scope and incorporating diverse KOL characteristics
would further enhance the robustness and explanatory
power of the model. Moreover, future investigations
could explore the potential influence of virtual KOLs
and platform algorithms on consumer purchase
intentions.
REFERENCES
Chen, M.-H., & Liao, W.-Y. 2021. The influence of KOL
attributes on advertising effectiveness and purchase
intention—Using YouTubers as an example. Journal of
Marketing Research and Case Studies, 2021: Article ID
237451.
https://chihleeir.lib.chihlee.edu.tw/bitstream/31099330
0Q/3127/2
Feng, Y., Tang, L., & Sun, X. 2025. The influence of short
video marketing on consumers' purchase intention: The
mediating role of perceived trust. E-Commerce Letters,
14(2): 644–653. https://www.hanspub.org/journal/ecl
Gao, Y., & Zhang, X. 2023. Uncovering heterogeneous
prestige effect in luxury consumption: The role of
income. Journal of Business Research, 157: 113594.
https://doi.org/10.1016/j.jbusres.2023.113594
Ge, J., Wang, Y., & Jin, L. 2021. Effect of short video ads
on sales through social media: The role of
advertisement content generators. International Journal
of Advertising, 40(5): 710–735.
https://doi.org/10.1080/02650487.2020.1848986
Huang, L., & Xu, Y. 2024. Research on the Influence of
KOL Characteristics on Brand Identity and Purchase
Intention. Open Journal of Business and Management,
12(2): 415–426. Available at:
https://www.hanspub.org/journal/paperinformation.asp
x?paperid=94883
Lamberton, C., & Stephen, A. T. 2016. A thematic
exploration of digital, social media, and mobile
marketing: Research evolution from 2000 to 2015 and
an agenda for future inquiry. Journal of Marketing,
80(6): 146–172. https://doi.org/10.1509/jm.15.0415
Li, W., & Xia, Z. 2022. A study on the impact of social
interaction and media richness on the effectiveness of
short video advertising. Modern Business, (33): 84–86.
https://www.hanspub.org/journal/paperinformation?pa
perid=55996
Lin, Y., & Huang, Y. 2020. The impact of influencer
characteristics on consumer trust and engagement: The
mediating role of trust. Open Journal of Business and
Management, 8(5): 2134–2147.
https://www.hanspub.org/journal/paperinformation?pa
perid=37317
Ratchford, B., Soysal, G., Zentner, A., & Gauri, D. K. 2022.
Online and offline retailing: What we know and
directions for future research. Journal of Retailing,
98(1): 152–177.
https://doi.org/10.1016/j.jretai.2022.01.003
Tiago, M. T. P. M. B., & Veríssimo, J. M. C. 2014. Digital
marketing and social media: Why bother? Business
Horizons, 57(6): 703–708.
https://doi.org/10.1016/j.bushor.2014.07.002
Wang, C. 2023. Income level and consumer price
sensitivity: Evidence from digital retail platforms.
Economics Journal, 11(4): 89–102. https://economics-
journal.com/index.php/ej/article/view/2009/1910
Zhang, J., & Zhang, Y. 2024. The impact of content
characteristics of short-form video ads on consumer
purchase intention. Journal of Business Research. (In
press). https://doi.org/10.1016/j.jbusres.2024.11456
Key Drivers of Consumer Purchase Decisions in Short Video Platform Promotions
647
