
Popular Movie Audience Analysis-Based on Multi-Dimensional
Yiran Sun
College of Humanities and Social Sciences, Beijing Institute of Technology, Beijing, China
Keywords: Film Market, Market Demographic Analysis, Preference Behavior Analysis.
Abstract: Based on the background of fierce competition and technological innovation in the film industry, this study
conducted a multidimensional analysis of movie-watching behaviors, preferences and consumption patterns
of audiences of different ages and genders through a questionnaire survey. The results show that women aged
18 to 30 tend to watch movies more frequently, preferring 90–120-minute movies and cinema experiences,
while men prefer online platforms and shorter films. The frequency of movies going has declined overall in
the 31 to 45 age group, but the gender difference is still significant. The data show that young audiences prefer
entertainment films such as romance and comedy, while the elderly tend to in-depth works such as
documentaries. Moreover, consumer behavior and social media engagement show double differences between
gender and age. The research suggests that film production should adjust film types, release platforms and
promotion strategies according to the characteristics of target audiences.
1 INTRODUCTION
In recent years, the competition in the film industry
has become more and more fierce, and it has gradually
developed towards commercialization. At the same
time, due to the continuous progress of scientific and
technological means, filmmakers are forced to invest
in less cost and use more means to present some
fictional scenes that cannot be realized in the real
world. For example: Avatar, Alien, Fantasy of PI, and
the rapid development of streaming media help
movies to have a more sustainable income source, the
development of social media makes the promotion of
movies easier, the publicity effect is more significant,
and the marketing methods of movies become more
diversified. Nowadays, watching movies has become
an entertainment and leisure activity for audiences
under high pressure. At the same time, audiences have
more freedom to choose movies. They can choose to
watch a movie at any time and in any form. This paper
analyzes the choice tendency of different age groups
and different genders in terms of film duration, type
and viewing mode.
The purpose of this study is to show that the film
project should consider the age of the audience, the
choice preference of the film type and the
consumption habit in the aspects of plot design and
marketing activities, to increase the income of the film
project.
2 METHODOLOGY-
QUESTIONNAIRE
The research method of this study took the form of a
questionnaire survey. A well-designed questionnaire
helps to standardize the data, and when the questions
are clearly structured, rigor can improve the validity
of the results. At the same time, the structured
characteristics of the questionnaire are helpful for data
management to reduce differences (Taherdoost, 2022).
In this paper, a total of 78 questionnaires were
collected.
This questionnaire is mainly divided into six parts.
The first part is the basic information statistics mainly
collected age and gender, which is used to analyze the
influence of age and gender on movie-watching
habits, preference types and consumption behaviors.
The second part is movie-watching habits, which aims
to understand the interviewees' movie-watching
frequency, movie-watching method and time
preference. The questions are as follows: monthly
movie-watching frequency, major movie-watching
platforms (movies, streaming media, TV, etc.), movie
length, and main viewing time (day, night, weekend,
etc.) The reason for designing this part of the question
is that viewing habits can translate audience's movie
consumption behavior and trend, and movie duration
preference may be related to the change of the modern
audience's attention span. The third part is the viewing
Sun, Y.
Popular Movie Audience Analysis-Based on Multi-Dimensional.
DOI: 10.5220/0013991900004916
Paper published under CC license (CC BY-NC-ND 4.0)
In Proceedings of the 2nd International Conference on Public Relations and Media Communication (PRMC 2025), pages 369-379
ISBN: 978-989-758-778-8
Proceedings Copyright © 2025 by SCITEPRESS – Science and Technology Publications, Lda.
369

preference. The purpose of this part is to analyze the
audience's choice preference for film types. Through
the analysis of preference behavior, it is helpful to
understand the influencing factors of the audience's
choice of film type, which is helpful to the formulation
of film marketing strategy. At the same time, the
selection preference of movie types can be cross
analyzed with the basic statistical information to find
the preference difference of different types. The fourth
part is to study the audience's paying habits and their
choice of viewing methods. By understanding
consumers' movie consumption habits through this
part of the problem, film companies can develop
reasonable pricing strategies to achieve more
sustainable income. The purpose of the fifth part is to
investigate the respondents' willingness to participate
in social behaviors for film projects and the influence
of social behaviors on audience's movie-watching
choices. The reason for designing this part of the
problem is that word-of-mouth and social marketing
have an increasing influence on the movie box office,
and understanding the social activities of the audience
can help optimize the publicity strategy and better
return on investment. The sixth part is designed for the
trend evaluation of the film industry, which can
understand the audience's evaluation of the future
trend of the film industry. This question can analyze
the development trend of the film industry from the
feedback of the audience and reflect the audience's
confidence in the development of the film industry, so
that the film company can better adjust the
development strategy.
3 RESULTS
3.1 Viewing Behavior
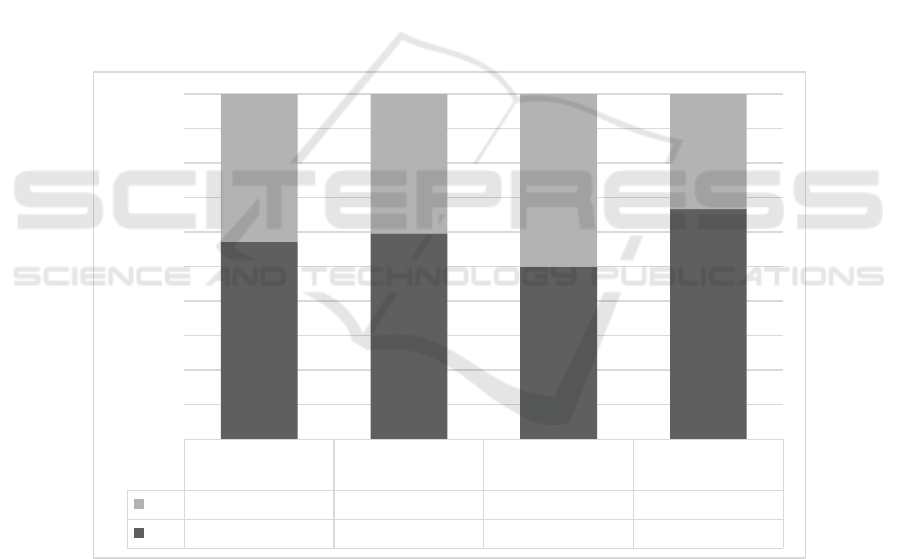
In the 18 to 30 age group, as shown in Figure 1, female
moviegoers are more frequent, with 61.4% of women
watching 13 movies per month, compared to 57.14%
of men who watch one to three times per month. As
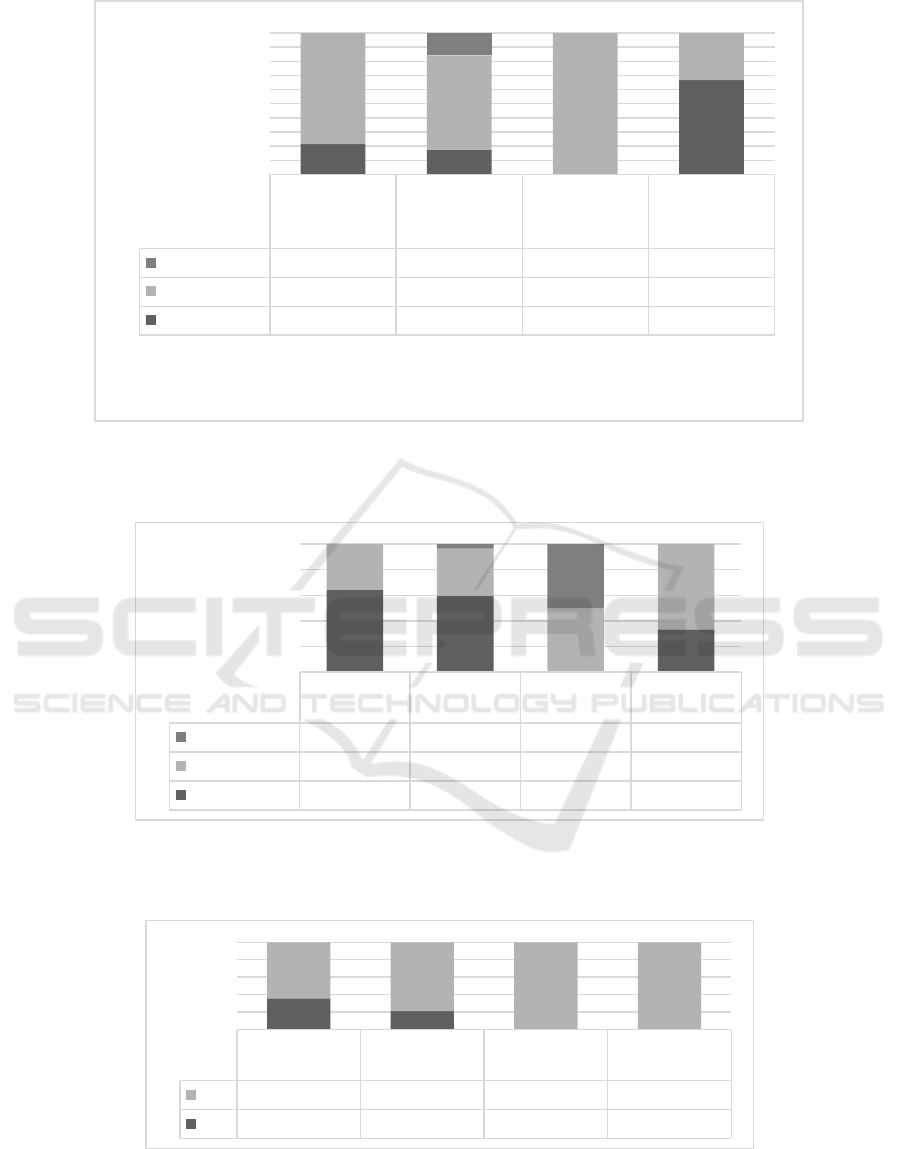
shown in Figure 2, women preferred longer films, with
70.18% choosing films between 90 and 120 minutes.
Men were more likely to watch films of 90 to 120
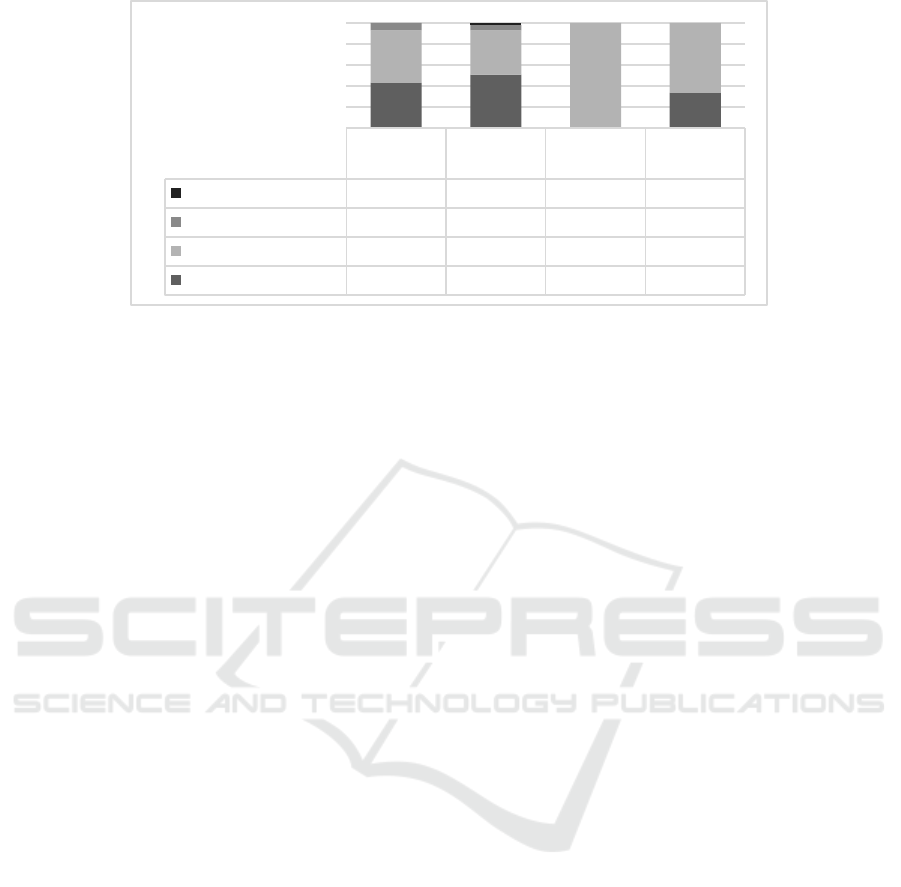
minutes, accounting for 71.43%. As shown in Figure
3, in terms of viewing platforms, men prefer online
video platforms (57.14%), while women prefer
theaters (52.63%). As shown in Figure 4, in terms of
viewing time, both men and women focus on evening
and weekend, but men's choices are more dispersed,
and women prefer weekend (35.09%) and evening
(33.33%). Overall, female audiences show a higher
frequency, longer film duration and cinema
preference, while men prefer online platforms and
shorter films.
As shown in Figure 1, in the 31 to 45 age group,
male and female moviegoers generally went to the
movies less frequently. All men choose once a quarter
or less, while 66.67% of women watch 13 times a
month, 33.33% choose less frequency, indicating that
women still maintain a certain frequency of watching
movies. As shown in Figure 2, in terms of platform
selection, men's preferences are more balanced, 50%
choose movie theaters and online video platforms, and
women all choose movie theaters, indicating that
women prefer theater experience. As shown in Figure
3, in terms of film length, 50% of men and 66.67% of
women choose 90-120 minutes, which is more
balanced. In terms of viewing time, both male and
female viewers tend to watch movies in the evening
and on weekends, showing relatively consistent
viewing time preferences.
Overall, young female viewers are more likely to
use online video platforms, while young men
maintain a more balanced choice between movie
theaters and online video platforms. The frequency of
viewing is higher among younger women, especially
in the 18 to 30 age group, with women viewing
significantly more movies per month than men. In the
group over the age of 31, both men and women, the
frequency of watching movies is generally decreased,
especially men, significantly lower than women.
Women are more inclined to watch movies of 90 to
120 minutes, and they have higher emotional
involvement in watching movies, which leads them to
have a higher frequency of watching movies and a
preference for longer movies. At the same time,
women are more inclined to watch movies in theaters,
which can provide more rich sensory services, which
also conforms to the trend of women's behavioral
preference (Rathnayaka et al., 2021a). Men, on the
other hand, are less emotionally demanding and tend
to choose shorter or more flexible viewing behaviors
(Sahu et al., 2022).
3.2 Preferences
As shown in Figure 5, in the 18 to 30 age group,
female viewers prefer romantic films and comedies,
73.68% and 85.96% respectively, while men prefer
action films and comedies, but the proportion is
slightly lower. As shown in Figure 6, women pay
more attention to story and word of mouth/rating
when choosing a film, 45.61% and 31.58%
respectively, while men pay less attention to story,
only 28.57%. As shown in Figure 7, in terms of film
sources, 50% of respondents said they had no
preference
for local or foreign films, indicating a
PRMC 2025 - International Conference on Public Relations and Media Communication
370
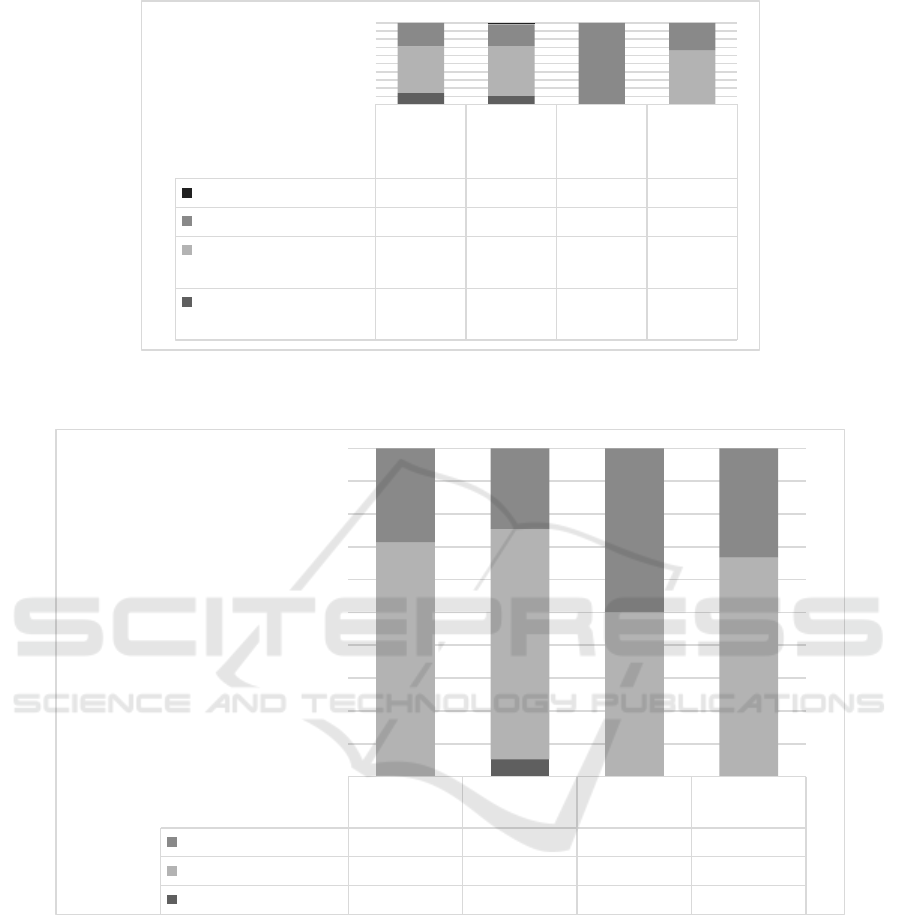
Alt Text for the figure: This figure reflects the distribution of viewing frequency of men and women in four age groups.
Figure 1. Monthly viewing frequency.
Alt Text for the figure: This figure reflects the distribution of viewing time of men and women in four age groups.
Figure 2. Choice of film duration.
Male aged
18-30
Female
aged 18-
30
Male aged
31-40
Female
aged 31-
40
Almost never look
0% 1.75% 0% 0%
Once a quarter or less
28.57% 26.32% 100% 33.33%
One to three times a
month
57.14% 61.40% 0% 66.67%
1 Once a week or
more
14.29% 10.53% 0% 0%
Male aged
18-30
Female aged
18-30
Male aged
31-40
Female aged
31-40
More than 120 mins
28.57% 24.56% 50% 33.33%
90~120 mins
71.43% 70.18% 50% 66.67%
Less than 90mins
0.00% 5.26% 0% 0%
Popular Movie Audience Analysis-Based on Multi-Dimensional
371
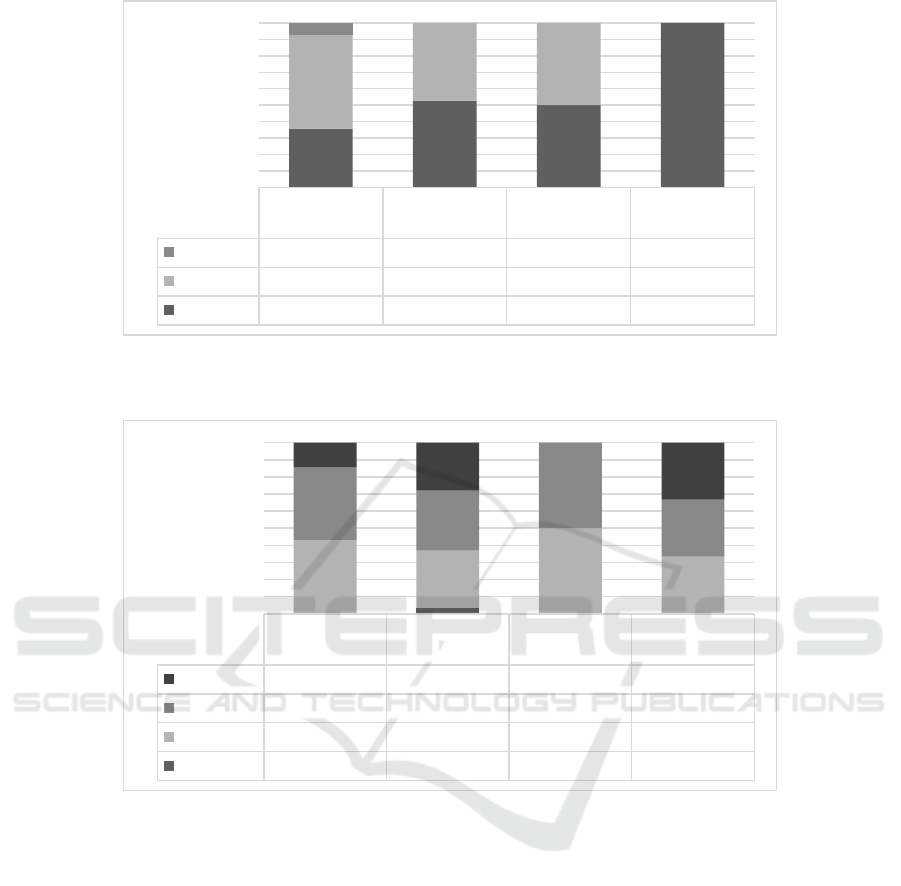
Alt Text for the figure: This figure reflects the distribution of viewing channels for men and women in four age groups.
Figure 3. Choice of viewing platform.
Alt Text for the figure: This picture reflects the distribution of viewing time of men and women in four age groups.
Figure 4. Choice of viewing period.
more relaxed choice. As shown in Figure 8, women
are more likely to get information about movies
through social media, with more than 85 percent
choosing social media compared to 78.57 percent of
men. In terms of viewing locations, women prefer to
watch at home, while men maintain a more balanced
choice between the cinema and home.
In the 31 to 45 age group, as shown in Figure 5,
male respondents have a significant preference for
action movies and comedies, especially action
movies, with a choice rate of 100 percent. Women
prefer documentaries, indicating that as they age, they
tend to choose films with more depth and realism. As
shown in Figure 6, both men (50%) and women
(66.67%) attach less importance to the story. As
shown in Figure 7, in terms of film sources, men
prefer foreign films (50%), while women are more
likely to watch local films (66.67%). Social media use
is higher in this age group, but overall engagement is
lower, indicating that this group pays less attention to
film reviews than younger people. When it comes to
viewing locations, men prefer theatrical movies,
while women are more likely to watch them at home.
Male aged 18-
30
Female aged
18-30
Male aged 31-
40
Female aged
31-40
TV
7.14% 0% 0% 0%
Steaming
57.14% 47.37% 50% 0%
Cinema
35.71% 52.63% 50% 100%
Male aged 18-
30
Female aged
18-30
Male aged 31-
40
Female aged
31-40
Anytime
14.29% 28.07% 0% 33.33%
Weekend
42.86% 35.09% 50% 33.33%
Night
42.86% 33.33% 50% 33.33%
Day
0% 3.51% 0% 0%
PRMC 2025 - International Conference on Public Relations and Media Communication
372
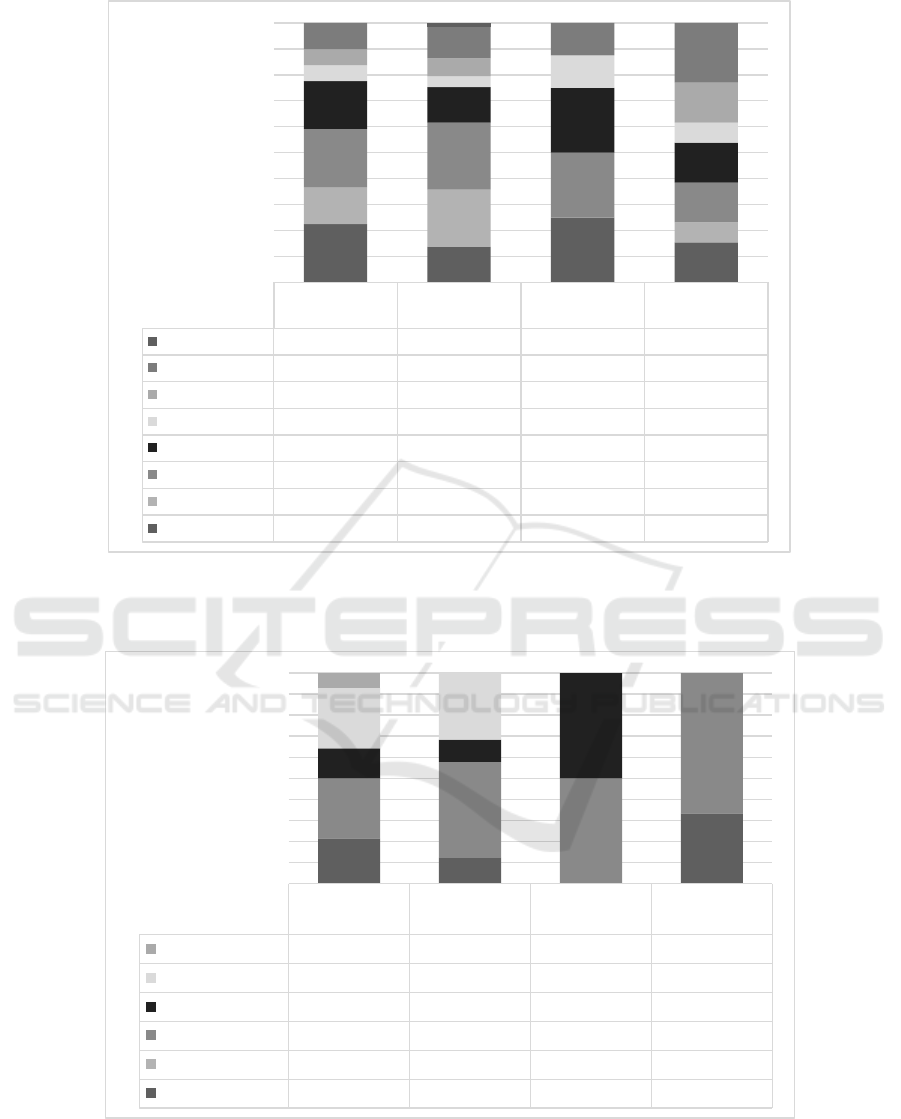
Alt Text for the figure: This picture reflects the distribution of the types of TV dramas watched by men and women in four
age groups.
Figure 5. Choice of viewing type.
Alt Text for the figure:This picture reflects the factors that affect the viewing choice of men and women in four age groups.
Figure 6. Factors influencing film selection.
Male aged 18-
30
Female aged 18-
30
Male aged 31-
40
Female aged 31-
40
Other
0% 5.26% 0% 0%
Animated
35.71% 40.35% 50% 100%
Documentary
21.43% 22.81% 0% 66.67%
Horror
21.43% 14.04% 50% 33.33%
Science fiction
64.29% 45.61% 100% 66.67%
Comedy
78.57% 85.96% 100% 66.67%
Romance
50.00% 73.68% 0% 33.33%
Action
78.57% 45.61% 100% 67%
Male aged 18-
30
Female aged
18-30
Male aged 31-
40
Female aged
31-40
Special effects
7.15% 0% 0% 0%
Word of mouth
28.57% 31.58% 0% 0%
Genre
14.29% 10.53% 50% 0%
Story
28.57% 45.61% 50% 66.67%
Director
0.00% 0.00% 0% 0.00%
Actor
21.43% 12.28% 0% 33%
Popular Movie Audience Analysis-Based on Multi-Dimensional
373
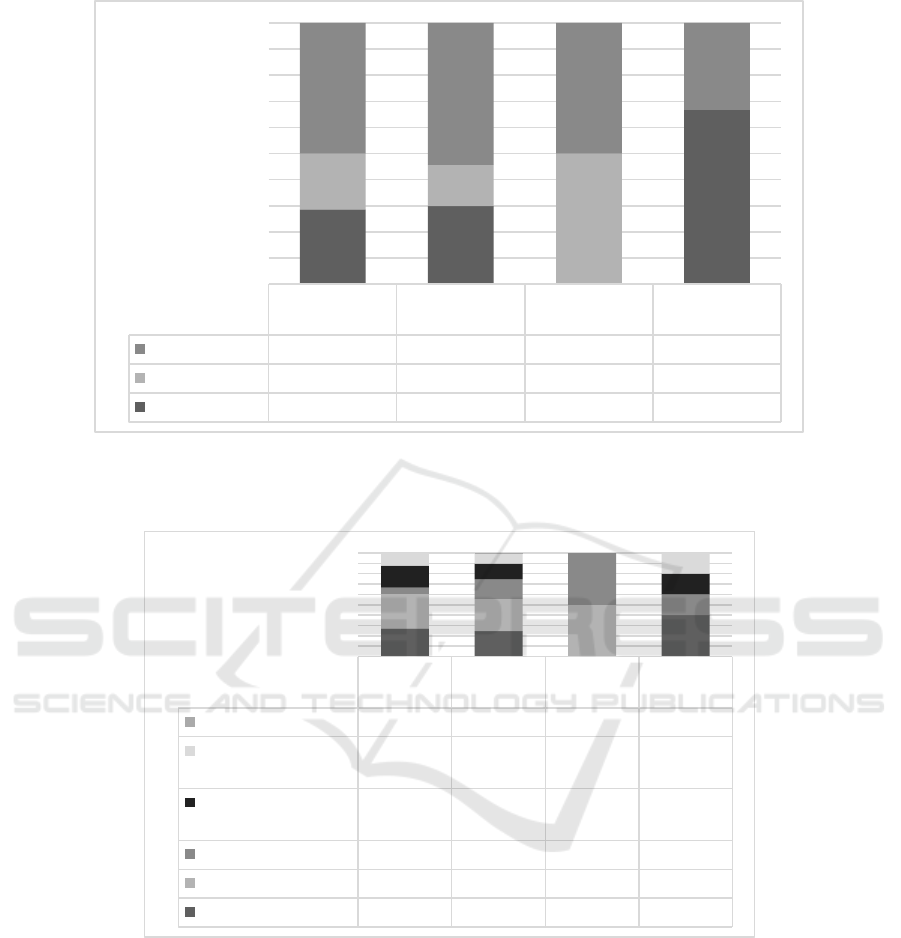
Alt Text for the figure: This picture reflects the distribution of film and television sources watched by men and women in
four age groups.
Figure 7. Film source region.
Alt Text for the figure: This picture reflects the distribution of channels for men and women in four age groups to watch
movies and TV.
Figure 8. Understanding channel of film evaluation.
Overall, young respondents preferred more
entertaining films, while as they grew older, their
preferences shifted to more in-depth films, and
gender differences were more obvious in different age
groups. Story is the most important factor in all age
groups, but especially in younger age groups. Young
people have less preference for specific films, while
the gender difference of the elderly is more prominent
in the choice of local and foreign films, with men
preferring foreign films and women preferring local
films. Younger women used more varied approaches
to getting film reviews, while older respondents were
more aloof. Younger audiences prefer to watch
movies at home, while middle-aged men are more
interested in cinema. Social media is an important
factor influencing the film selection of young
audiences, especially female audiences are more
dependent on social media for information (Rubin et
Male aged 18-
30
Female aged
18-30
Male aged 31-
40
Female aged
31-40
No preference
50.00% 54.39% 50% 33.33%
Foreign films
21.43% 15.79% 50% 0.00%
Local films
28.57% 29.82% 0% 67%
Male aged
18-30
Female
aged 18-30
Male aged
31-40
Female
aged 31-40
Other
0% 1.75% 0% 0%
Professional movie
reviews
28.57% 26.32% 0% 33.33%
Friend
recommendations
50% 42.11% 0% 33.33%
Movie trailers
14.29% 52.63% 50% 33.33%
Social media
78.57% 85.96% 50% 0.00%
Rating sites
64.29% 68.43% 0% 67%
PRMC 2025 - International Conference on Public Relations and Media Communication
374
al., 2022). Young women prefer romantic movies and
comedies, while men prefer action movies. At the
same time, the audience's preference for film types of
changes with the growth of age. The young audience
is more inclined to entertaining movies, while the old
audience is more inclined to documentaries and more
in-depth movies. Young audiences are more likely to
watch movies at home (Tontini et al., 2022).
3.3 Consumption Patterns
In the age group of 18 to 30 years old, as shown in
Figure 9, women's willingness to pay is slightly
higher than that of men, 59.65% and 57.14%
respectively, and women prefer to pay 0-40 yuan. As
shown in Figure 10, women are more engaged on
social media, with 66.67% occasionally participating
in discussions, while men share occasionally at
78.57%. As shown in Figure 11, both sexes rely on
social media comments, 64.29% for men and 59.65%
for women. As shown in Figure 12, women are more
enthusiastic about participating in the film
community than men (78.95% vs. 64.29%). In
addition, as shown in Figure 13, women have a higher
level of confidence in the market, with 50.88% of
women being optimistic compared to 42.86% of men.
In the age group of 31 to 45, as shown in Figure 9
the willingness of men and women to pay is 50% and
66.67%, respectively, and most of them choose to pay
0-40 yuan. As shown in Figure 10, men completely
choose to participate in social media discussions
occasionally, while women participate 66.67% often
and 33.33% occasionally. As shown in Figure 11,
men and women are less dependent on social media
comments, with 50% of men and 66.67% of women
referring to them occasionally. Overall, participation
in the film community in the 31 to 45 age group is
extremely low, and regarding the perspective on the
film market, as shown in Figure 13, all men choose
"average," while 33.33% of women are optimistic.
Alt Text for the figure: This picture reflects the willingness of men and women of four age groups to pay for watching movies.
Figure 9. willingness to pay extra fees.
Male aged 18-30
Female aged 18-
30
Male aged 31-40
Female aged 31-
40
No
42.86% 40.35% 50% 33.33%
Yes
57.14% 59.65% 50% 67%
Popular Movie Audience Analysis-Based on Multi-Dimensional
375
Alt Text for the figure: This picture reflects the distribution of men's and women's willingness to share with others after
watching movies in four age groups.
Figure 10. Willingness to participate in community discussions after watching a film.
Alt Text for the figure: This picture reflects the situation that men and women of four age groups are influenced by movie-
watching comments.
Figure 11. The degree of influence of social media comments on movie-watching intention.
Alt Text for the figure: This picture reflects the distribution of male and female participation in film and television interaction
in four age groups.
Figure 12. The willingness to participate in the interaction of the film community.
Male aged
18-30
Female
aged 18-
30
Male aged
31-40
Female
aged 31-
40
Never
0.00% 15.79% 0% 0.00%
Occasionally
78.57% 66.67% 100% 33.33%
Often
21.43% 17.54% 0% 67%
Male aged
18-30
Female aged
18-30
Male aged
31-40
Female aged
31-40
Never
0.00% 3.51% 50% 0.00%
Occasionally
35.71% 36.84% 50% 66.67%
Often
64.29% 59.65% 0% 33%
Male aged 18-
30
Female aged
18-30
Male aged 31-
40
Female aged
31-40
No
64.29% 78.95% 100% 100.00%
Yes
35.71% 21.05% 0% 0%
PRMC 2025 - International Conference on Public Relations and Media Communication
376
Alt Text for the figure: This picture reflects the views of men and women of four age groups on the development of movies.
Figure 13. The recognition of the development prospects of the film market.
Overall, younger age groups (18 to 30 years old)
are more open to paying extra, while older age groups
are more resistant. Younger viewers are more likely
to engage in social media discussions, and young
women are the most active in sharing film
recommendations. Younger people, especially
women, rely more on social media reviews to make
decisions about watching movies, while older groups
rely less on those reviews (Rubin et al., 2022).
Participation in film-related communities is
dominated by young women, with less participation
from other age groups and genders. Young women
are optimistic about the film market, while men and
middle-aged people are more conservative.
4 DISCUSSION
4.1 Implications for Producers
The choice of film genre can be optimized for
different ages and genders. Female audiences aged 18
to 30 prefer romantic films (73.68%) or comedy films
(85.96%), while male audiences prefer action films.
Women aged 31 to 45 prefer documentaries, while
men still prefer action films. Therefore, youth love
films and urban romance films should mainly target
the market of women aged 18 to 30, increasing
women's communication potential to narrative,
emotional resonance and social communication.
Action films focus on the core male market but can
add more plot depth and character development to
suit the needs of men over 30. At the same time, pre-
heated content is released on social media in advance
to encourage UGC communication, enhance audience
participation on social platforms, strengthen word-of-
mouth management on social media, and actively
respond to audience feedback to increase audience
interaction experience and improve audience
communication. Social interaction can not only
increase the audience's willingness to buy tickets but
also promote spontaneous communication and
enhance the film market influence. When a film has
both high personal interaction and active social
interaction, it performs better at the box office
(Castillo et al., 2021).In the highly competitive
schedule, star effect can be more effective in
attracting audiences, but eWOM transmission will be
limited, while in the film click, word-of-mouth
marketing has a greater impact on the long-term
performance of the film (Fan et al., 2021). Big-budget
films should choose a more competitive schedule,
maximize the exposure of star effect, and attract
young people to watch movies, while feature films or
documentaries can choose to be released in
standalone, use eWOM communication to achieve
long-term box office revenue, and at the same time,
accurately deliver to different audience groups.
4.2 Implications for Platforms
For online movie viewing platforms, data-driven
content recommendation capabilities should be
improved, and personalized movie recommendations
should be made by analyzing user behavior to
enhance user experience satisfaction. For example,
Netflix user data analysis strategy: Netflix relies on
user behavior consideration, such as viewing time,
completion rate, etc., to optimize personalized
recommendations and carry out unique
recommendation cover design (Wayne, 2021).At the
same time, a selective transparency strategy should be
adopted to regularly promote the most popular movie
and series data, so as to increase user trust in the
platform and promote social communication. For
Male aged
18-30
Female
aged 18-30
Male aged
31-40
Female
aged 31-40
Not sure
0% 1.75% 0% 0%
Not very optimistic
7.14% 5.26% 0% 0.00%
Moderate
50.00% 42.11% 100% 66.67%
Very optimistic
42.86% 50.88% 0% 33%
Popular Movie Audience Analysis-Based on Multi-Dimensional
377

example, Netflix has gradually begun to selectively
promote the data of some popular works in recent
years to attract more users to subscribe (Wayne,
2021). But the theater experience still has advantages,
but it needs to increase the strategy to compete with
streaming media. Research shows that despite the
growing popularity of streaming, the social nature of
the immersive experience in theaters remains a strong
competitive advantage (Tontini et al., 2022).
Therefore, theaters should further enhance the
difficult immersive devices, such as adding IMAX,
Dolby Atmos, 4K and other technologies, to attract
users willing to pay for a high-quality movie-
watching experience. At the same time, the
integration strategy of online and offline is the main
trend in the future. Audiences have improved their
acceptance of diversified movie-watching modes, and
more and more audiences switch between theaters
and media platforms, so as to choose a more suitable
way for themselves (Tontini et al., 2022). At the same
time, the movie-watching platform can cooperate
with the theater lines to pay for a mixed model of on-
demand and theatrical premieres to meet different
user needs.
4.3 Marketing Strategies
The official government should reasonably combine
part of the promotion power of social media. The
official social media activities of a movie can
improve the intention of buying tickets by changing
the audience's attitude, while the third party can
improve the intention of buying tickets by attracting
the audience's attention and promoting a positive
attitude. Meanwhile, under the same marketing
intensity, local movies will have better marketing
effect when they are released in popular holidays,
which further affects the audience's payment. At the
same time, the central path of social media promotes
rational purchasing decision, while the peripheral
path influences purchasing behavior through social
identity (Liao & Huang, 2021). The consumption
intention of the movie audience has an intermediary
effect on the box office, that is, social media activities
affect the increase of the audience's consumption
intention and lead to the increase of the box office.
However, the official promotion of social media
should decide the scope, intensity and method of
promotion according to the release time and the life
cycle of the product. Social media marketing has a
non-linear effect before and after the movie is
released, and excessive marketing may lead to the
audience's doubts about the quality of the movie and
reduce the final purchase willingness (Sun et al.,
2020).
5 CONCLUSION
This paper makes a multidimensional analysis of
moviegoers by means of questionnaires, including
movie-watching preference, movie consumption
behavior, viewing behavior, audience's willingness to
spread movies and episodes, and audience's
development of the film industry. Through the
investigation, it is concluded that audiences of
different ages and genders have significantly different
preferences for movies, so it is suggested that film
producers design different types of movies according
to audiences of different age groups, design more film
and television and screening modes, and achieve
targeted offline screening and online promotion, and
make good use of social media to attract audiences to
further marketing and sharing of films and TV series.
There are still some objective problems in this study,
such as insufficient distribution of questionnaires,
small sample size, resulting in errors in data analysis,
and too single age level of research objects, resulting
in insufficient objective research results. This study
can be further improved, the sample size should be
increased, and the way and scope of questionnaire
delivery should be broadened.
REFERENCES
Castillo, A., Benitez, J., Llorens, J. & Luo, X. 2021. Social
media-driven customer engagement and movie
performance: Theory and empirical evidence. Decision
Support Systems 145: 113516.
Fan, L., Zhang, X. & Rai, L. 2021. When should star power
and eWOM be responsible for the box office
performance? An empirical study based on signaling
theory. Journal of Retailing and Consumer Services 62:
102591.
Liao, L. & Huang, T. 2021. The effect of different social
media marketing channels and events on movie box
office: An elaboration likelihood model perspective.
Information & Management 58(7): 103481.
Rathnayaka, S., Ranathunga, C., Navarathna, R.,
Kaneswaran, A. & Balathasan, Y. 2021a. Predicting
Movie Ratings from Audience Behaviors on Movie
Trailers. IEEE Xplore 489–493.
Rubin, D., Mohr, I. & Kumar, V. 2022. Beyond the box
office: A conceptual framework for the drivers of
audience engagement. Journal of Business Research
151: 473–488.
PRMC 2025 - International Conference on Public Relations and Media Communication
378

Sahu, S., Kumar, R., Pathan, M.S., Shafi, J., Kumar, Y. &
Ijaz, M.F. 2022. Movie popularity and target audience
prediction using the Content-Based Recommender
System. IEEE Access 10: 42044–42060.
Sun, L., Zhai, X. & Yang, H. 2020. Event marketing, movie
consumers’ willingness and box office revenue. Asia
Pacific Journal of Marketing and Logistics 33(2): 622–
646.
Taherdoost, H. 2022. Designing a questionnaire for a
research paper: A comprehensive guide to design and
develop an effective questionnaire. Asian Journal of
Managerial Science 11(1): 8–16.
Tontini, G., Krause, V.M., Da Silva, L.F., Vieira, F.R.,
Santos, T. & Andrade, J. 2022. What influences the
behavior intention of movie theater customers?
Comparing linear and nonlinear points of view.
International Journal of Quality and Service Sciences
14(4): 652–670.
Wayne, M.L. 2021. Netflix audience data, streaming
industry discourse, and the emerging realities of
‘popular’ television. Media Culture & Society 44(2):
193–209.
Popular Movie Audience Analysis-Based on Multi-Dimensional
379
