
Sentiment Analysis-Based Subway Passenger Flow Prediction and
Decision Support
Yue Yu
School of Mathematics Statistics and Mechanics, Beijing University of Technology, Beijing, 100000, China
Keywords: Subway Passenger Flow, Social Media, Sentiment Analysis, Machine Learning.
Abstract: With the acceleration of urbanization, subways have become vital to public transportation. Accurate passenger
flow prediction is key to optimizing operations and improving service. Traditional methods of prediction
mainly use historical data, often ignoring emotional factors. Using machine learning algorithms and social
media sentiment analysis, this study investigates how public emotion affects subway passenger flow. First,
web scraping techniques are used to collect data from Weibo, and the large language model is used for
sentiment analysis. Then, a random forest model is constructed using both sentiment data and historical
subway passenger flow data for prediction. Experimental results indicate that model incorporating sentiment
data is more accurate in predictions than traditional methods, particularly during emergencies or special time
periods. This study provides a new perspective for subway management, which can be applied to optimize
scheduling strategies.
1 INTRODUCTION
With the acceleration of urbanization, the subway has
become a crucial vehicle of urban public
transportation. Traffic planning, operational
scheduling, and passenger flow management all
depend on the ability to estimate passenger flow of
subway.
Through a literature review conducted in recent
years, there are 46 articles from Peking University
Core Journals in CNKI. This indicates that subway
passenger flow prediction is a relatively popular
research direction. Additionally, an article on
predicting passenger flow of subway using social
media data was published in IEEE journal as early as
2016. This shows that passenger flow forecasts paired
with information from social media has already
established a certain research foundation.
However, while these models provide a certain
level of prediction accuracy, they overlook the
potential influence of public emotion on the flow of
subway passengers. Social media is a significant
information source in modern society. It reflects a
amount of real-time public sentiment and behavioral
patterns. Therefore, social media data, particularly
sentiment analysis, can offer richer contextual
information for subway passenger flow prediction.
This can help to understand the causes of emotional
fluctuations and enabling decision-makers to
implement more human-centered and targeted
strategies.
This study integrates sentiment analysis of social
media with subway passenger flow prediction models
to achieve more comprehensive and precise
management. Sentiment-driven passenger flow
prediction and management can help identify sections
with significant emotional fluctuations in advance.
This allows managers to prioritize crowd dispersion or
implement other emergency measures. It can also
improve responsiveness and effectiveness during
unexpected events.
2 LITERATURE REVIEW
2.1 Current Studies on Subway
Passenger Flow Prediction
As an essential part of urban public transportation,
predicting the flow of subway passengers is crucial
for traffic planning, operational management, and
emergency response. Accurate passenger flow
forecasting enables optimal resource allocation,
enhances passenger travel experiences, and
strengthens the resilience of transportation systems.
Traditional forecasting methods primarily rely on
Yu, Y.
Sentiment Analysis-Based Subway Passenger Flow Prediction and Decision Support.
DOI: 10.5220/0013991700004916
Paper published under CC license (CC BY-NC-ND 4.0)
In Proceedings of the 2nd International Conference on Public Relations and Media Communication (PRMC 2025), pages 351-360
ISBN: 978-989-758-778-8
Proceedings Copyright © 2025 by SCITEPRESS – Science and Technology Publications, Lda.
351

historical passenger flow data, using statistical
approaches such as time series analysis and
regression models. For example, previous studies
have proposed a deep learning model based on Long
Short-Term Memory (LSTM) networks (Xiong et al.,
2019). It effectively captures the nonlinear
characteristics of passenger flow and has been
validated in multiple subway systems across different
cities.
In recent years, there is a rapid development of big
data, artificial intelligence, and social media. Subway
passenger flow prediction methods have continued to
evolve. Research has increasingly focused on multi-
source data and deep learning approaches.
2.2 Main Factors Influencing Subway
Passenger Flow
Various factors influence subway passenger flow,
including macroeconomic conditions, weather,
holiday effects, social events, and unexpected
incidents. A number of studies have looked at how
various factors affect passenger flow. For example,
researches have analyzed the effect of weather
conditions on short-term passenger flow fluctuations
and the influence of socio-economic activities on
long-term trends (Wang et al., 2020; Lin et al., 2020).
Additionally, other studies have discussed the effects
of population density, subway network layout, and
competition from other public transportation
(Volovski et al., 2021).
Beyond macroeconomic factors, passenger flow in
subways is also significantly influenced by individual
behavioral patterns. Travel habits are significantly
affected by workdays and holidays, peak and off-peak
hours, and special events (sports competitions and
large-scale concerts). Therefore, incorporating these
factors into prediction models and constructing
flexible passenger flow forecasting systems has
become an important research direction. For example,
some studies have developed prediction models based
on multi-variable disturbances to forecast passenger
flow fluctuations brought on by major events (Xue et
al., 2022).
2.3 Application of Social Media Data in
Passenger Flow Prediction
2.3.1 Characteristics of Social Media Data
and Its Application in Transportation
Research
Social media data is real-time, user-generated, and
widely covered. It makes highly valuable for urban
transportation research. Compared to traditional
passenger flow data, social media data provides richer
background information, such as users' subjective
evaluations of traffic conditions and their future travel
plans. Additionally, during emergencies or special
events, social media data can offer more timely
insights into passenger flow changes than
conventional transportation data.
The use of social media data in transportation
forecasting has been the subject of an increasing
number of studies in recent years. For example,
research has found a strong correlation between
trending topics on social media and changes in
passenger flow. By analyzing text content, real time
traffic conditions can be identified, thereby enhancing
the precision of short-term forecasts of passenger
flow (Essien et al., 2021).
2.3.2 Correlation Between Social Media
Data and Subway Passenger Flow
Studies have shown that the volume of discussions
related to travel on social media, exhibit a strong
correlation with subway passenger flow (Tu et al.,
2022). Moreover, sentiment analysis of social media
data has demonstrated a certain predictive capability.
Research indicates that an increase in negative
emotion related to transportation on social media may
correspond to a decrease in subway ridership.
However, positive sentiment may be associated with
an increase in passenger flow (Chen et al., 2023).
2.3.3 Current Methods of Utilizing Social
Media Data in Passenger Flow
Prediction
At present, social media data is primarily used in
passenger flow forecasting through the following
approaches:
Keyword Statistical Analysis: Some studies assess
changes in passenger flow by counting related
phrases on social media(Tu et al., 2022). For instance,
passenger flow trends can be indirectly predicted by
analyzing fluctuations in the frequency of keywords
(e.g.,"subway congestion" and "queueing at subway
stations").
Sentiment Analysis: Travel decisions can be
predicted by analyzing user sentiments on social
media. Studies have found that passenger satisfaction
with subway services is closely related to future travel
choices (Chen et al., 2023). Therefore, sentiment
analysis is a useful tool for predicting commuter
behavior patterns.
Spatiotemporal Data Fusion: Combining social
media check-in data with traditional transportation
data can improve forecasting accuracy (Fu et al.,
PRMC 2025 - International Conference on Public Relations and Media Communication
352

2022). Check-in data provides users' geographic
location information. Prediction models' capacity to
generalize can be improved by combining historical
passenger flow data.
2.4 Integration of Sentiment Analysis
and Subway Passenger Flow
Prediction
2.4.1 Existing Research on the Integration of
Sentiment Analysis and Passenger
Flow Prediction
In recent years, sentiment analysis has been
introduced into subway passenger flow prediction. It
primarily uses to detect public reactions to traffic
conditions and improve prediction model.
Additionally, sentiment analysis can be combined
with time series models to explore the long-term
impact of sentiment fluctuations on passenger flow
trends.
2.4.2 Common Methods and Challenges in
Research
Traditional sentiment analysis methods include
lexicon-based approaches (e.g., sentiment lexicon
matching) and machine learning-based approaches
(e.g., support vector machines and deep learning).
However, the application of emotion analysis in
prediction of subway passenger flow still faces
several challenges. Firstly, social media data often
contains a large amount of irrelevant information.
What’s more, the sentiment expressed by users may
vary depending on the scenario. To enhance
sentiment analysis accuracy, high-quality data is
required and the process comes with significant
computational costs. It is a issue to balance
computational efficiency with prediction accuracy.
In the future, studies could integrate multi-source
data(e.g., combining images, text, and location
information)to further enhance prediction accuracy.
2.5 Summaries
In summary, particularly in the application of
machine learning and social media data, significant
progress has been made in subway passenger flow
prediction research. However, existing studies still
face challenges related to data quality, model
generalization, and complex factor modeling. Future
research could further explore deep learning and
multi-source data fusion methods to improve the
precision and applicability of passenger flow
forecasting. Additionally, with the integration of
sentiment analysis technology, the study of passenger
behavior patterns is being enhanced . This could
further optimize subway passenger flow prediction
models, providing theoretical support for the
development of intelligent transportation systems.
3 RESEARCH QUESTIONS
This study explores the following research questions:
What is the relationship between social media
sentiment fluctuations and changes in subway
passenger flow? Can the accuracy of passenger flow
forecast be increased by combining sentiment
analysis from social media with data on passenger
flow? And how can sentiment analysis results be used
to optimize subway management decisions?
4 RESEARCH METHOD
4.1 Data Collection
A web scraping technique was used to collect posts
related to the Beijing Subway from Weibo, including
text data, geotagging data, and timestamps. Web
scraping allows for efficient and automated data
collection on a large scale, significantly reducing time
costs compared to manual data collection.
Additionally, passenger flow data for the Beijing
Subway was obtained from the Beijing Rail Transit
Command Center to serve as an auxiliary input for
passenger volume prediction.
4.2 Sentiment Analysis
A sentiment analysis was conducted on the collected
text data using large language models. It will generate
sentiment scores and polarity for each post.
Research compares GPT Omni models with
BERT (Bidirectional Encoder Representations from
Transformers) in sentiment analysis tasks. It found
that large language models exhibit strong
performance in sentiment analysis (Roumeliotis et al.,
2024). This study further validates the effectiveness
of large language models in natural language
processing tasks. Thus, utilizing large language
models for emotion analysis increases productivity
and enables the quantification of data, facilitating
further analysis.
By analyzing sentiment fluctuations across
specific time periods or subway lines, it can provide
additional insights into the emotional factors behind
passenger flow variations.
Sentiment Analysis-Based Subway Passenger Flow Prediction and Decision Support
353
4.3 Subway Passenger Flow Prediction
Model
Machine learning algorithms, such as Random Forest
and LSTM, will be used to build the subway
passenger flow prediction model(Ma et al.,
2021).Data from passenger flow tracking and
sentiment analysis on social media will be combined
to train these algorithms. By training the model, it will
be possible to predict passenger flow trends for the
next few hours or days. It can also provide decision
support for subway management authorities.
4.4 Sentiment-Driven Decision Support
for Management
Based on sentiment analysis results and passenger
flow predictions, the following decision support
strategies can be developed:
Congestion Warning: When negative sentiment
significantly increases in a particular time period or
subway line, potential overcrowding or disruptions
can be anticipated in combination with passenger
flow predictions. Subway operators can preemptively
deploy additional staff for crowd control or schedule
more train services.
Priority Crowd Management Measures: Lines
with significant sentiment fluctuations or pronounced
negative sentiment may require priority crowd
management measures to prevent disorder.
Emergency Response: If a surge in negative
sentiment regarding an emergency event is detected
on social media, the model can automatically alert
subway operators. This would prompt immediate
intervention, such as dispatching more personnel to
maintain order and prevent chaos.
5 RESULTS
5.1 Descriptive Statistics
Large datasets were visualized to better capture data
characteristics and patterns intuitively.
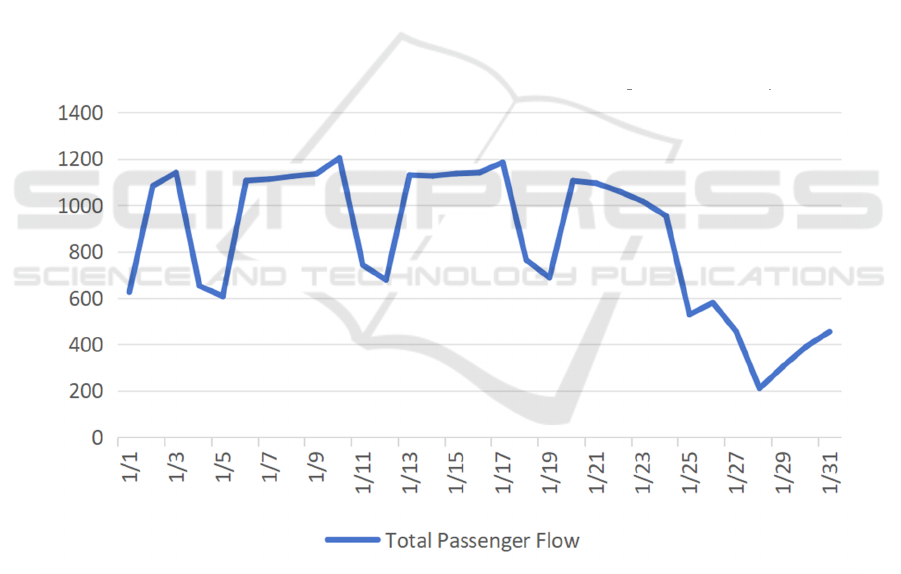
Alt Text for Graphical Figure: A line chart shows that as the date on the x-axis changes, the subway passenger flow on the y-
axis exhibits cyclical variations. Starting from January 25th, the passenger flow significantly decreases.
Figure 1. Total daily passenger traffic of Beijing subway in January 2025 (Picture credit: Original).
Figure 1 presents a line chart of the total daily
passenger volume of the Beijing Subway in January
2025.It shows periodic fluctuations, which may be
influenced by holidays.
PRMC 2025 - International Conference on Public Relations and Media Communication
354
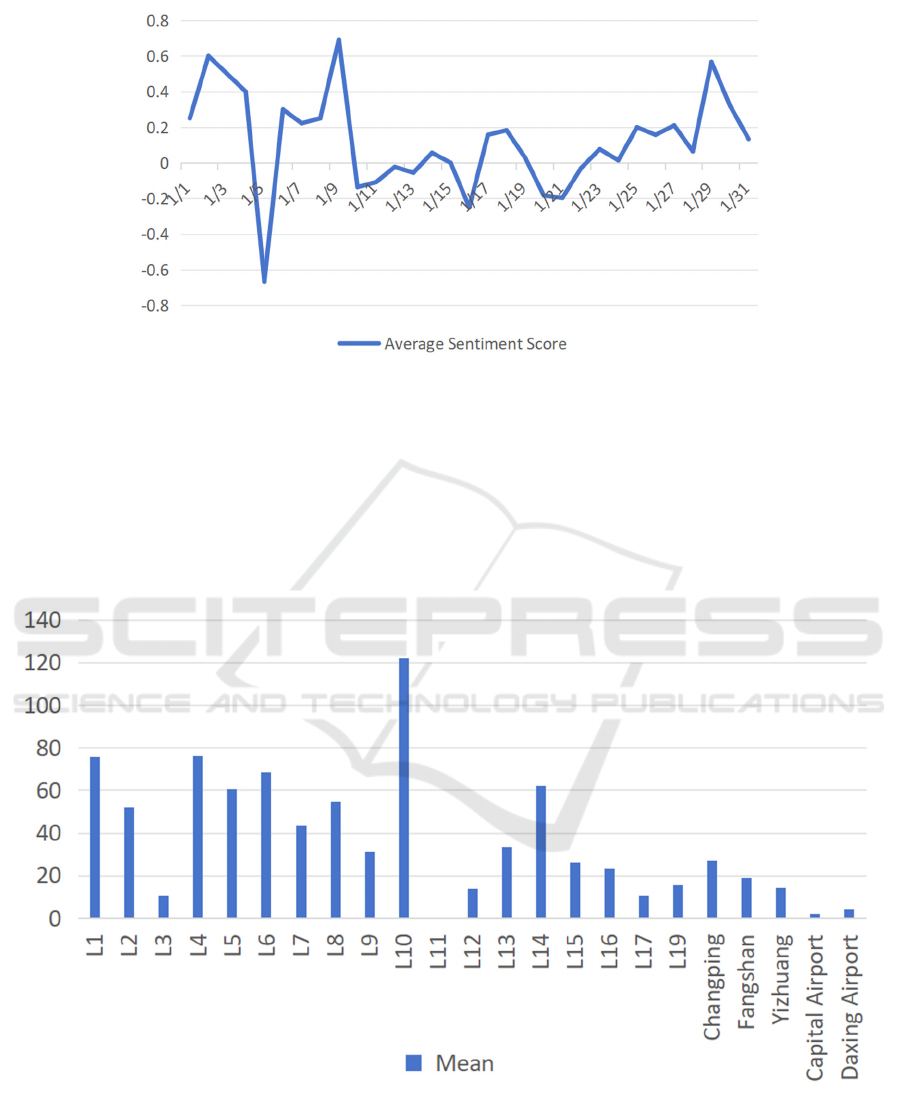
Alt Text for Graphical Figure: A line chart shows irregular fluctuations in the sentiment score (y-axis) over time (x-axis date),
with the largest fluctuations occurring between January 3rd and January 11th.
Figure 2. Average sentiment score of Beijing subway in January 2025 (Picture credit: Original).
Figure 2 displays the average sentiment scores of
collected social media posts related to the Beijing
Subway for January 2025. These scores indicate
public sentiment fluctuations over the month.
Comparing Figures 1 and 2, the sentiment scores
from January 25 to January 31 were more stable and
positive compared to January 1 to January 11, which
could be associated with lower passenger volumes.
The sentiment score on January 6 was notably
negative, possibly due to an unexpected incident.
Alt Text for Graphical Figure: A bar chart displays the average daily subway passenger flow corresponding to different
subway lines on the x-axis. Line 10 shows the highest average flow, while Line 11 shows the lowest.
Figure 3.Average total passenger flow of each line in January 2025 (Picture credit: Original).
Sentiment Analysis-Based Subway Passenger Flow Prediction and Decision Support
355
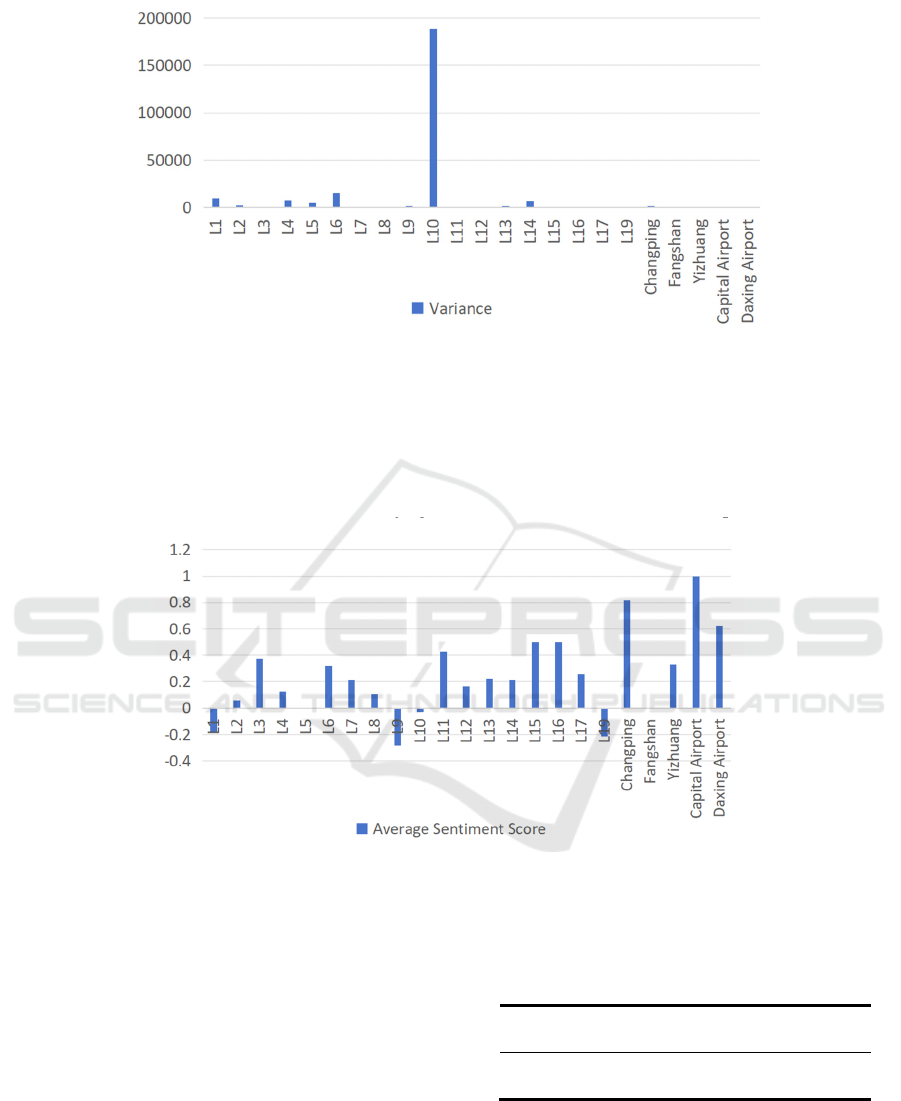
Alt Text for Graphical Figure: A bar chart shows the variance of daily subway passenger flow for different subway lines (x-
axis), where the variance for Line 10 is significantly greater than that of the other lines.
Figure 4. Variance of total passenger flow of each line in January 2025 (Picture credit: Original).
Figures 3 and 4 illustrate the average passenger
volume and variance across different subway lines in
January 2025. The results indicate that Beijing
Subway Line 10 had the highest passenger volume
and the most significant fluctuations. The focus
should be on this line in future predictions.
Alt Text for Graphical Figure: A bar chart shows the average sentiment score corresponding to different subway lines on the
x-axis. Lines 1,9, 10, and 19 show negative scores, while the remaining lines show positive scores.
Figure 5. Average sentiment score of different lines in January 2025 (Picture credit: Original).
Figure 5 presents the average sentiment scores
related to different subway lines in January 2025.
Negative sentiment was observed for Lines 1, 9, 10,
and 19, which may indicate congestion or past
incidents on these routes.
5.2 Correlation Analysis
The association between sentiment scores and
variations in passenger flow was investigated using a
correlation analysis.
Table 1: Correlation Analysis Between Sentiment Score
and Passenger Flow
r
CI95%
p
-val
-0.468 [-0.74, -0.07] 0.024
Table 1 shows that the Pearson correlation
coefficient is -0.4682, showing that sentiment scores
and passenger volume are negatively correlated.the p-
value is 0.0242, which is less than 0.05, implying that
the association is statistically significant.
PRMC 2025 - International Conference on Public Relations and Media Communication
356
5.3 Modeling and Prediction
First, a Random Forest model was constructed based
on data on past passenger volumes. The actual facts
and the anticipated outcomes were contrasted, as
shown in Figure 6.
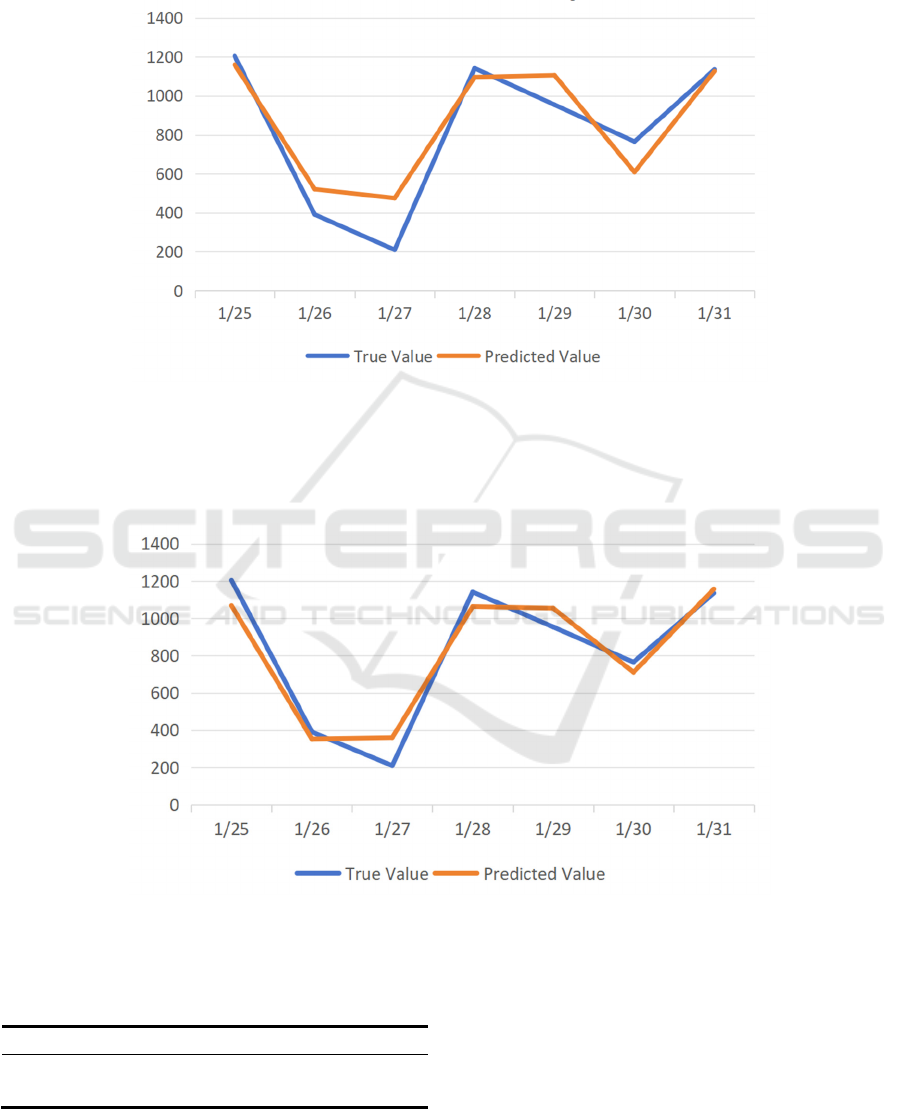
Alt Text for Graphical Figure: A line chart shows both the predicted and actual values of subway passenger flow. On January
26th, January 27th, and January 30th, there are significant differences between the predicted and actual values.
Figure 6. Passenger Flow Forecast Comparison based on historical data (Picture credit: Original).
Next, sentiment data was integrated with historical
passenger flow data, and a new Random Forest model
was developed. The predicted results were compared
with the actual values, as shown in Figure 7.
Alt Text for Graphical Figure: A line chart shows both the predicted and actual values of subway passenger flow. On January
27th, there is a significant difference between the two values.
Figure 7. Passenger Flow Forecast Comparison after incorporating sentiment data (Picture credit: Original).
Table 2. Model Comparison and Evaluation
MSE MAE RMSE R^2
Model 1 19832.58 114.66 140.83 0.85
Model 2 8861.93 82.53 94.14 0.93
Table 2 compares the performance of the
traditional prediction model with the model
incorporating sentiment data. The results reveal that
adding sentiment data improves model performance.
Specifically, after incorporating sentiment data,
Mean Squared Error (MSE) decreased from
19,832.58 to 8,861.93. Mean Absolute Error (MAE)
dropped from 114.66 to 82.53.Root Mean Squared
Sentiment Analysis-Based Subway Passenger Flow Prediction and Decision Support
357

Error (RMSE) reduced from 140.83 to 94.14.These
improvements indicate that incorporating sentiment
data significantly reduces prediction errors and
enhances model accuracy. Furthermore, the
coefficient of determination (R²) increased from 0.85
to 0.93. It shows that the model with sentiment data
explaining data variability better and significantly
improving its goodness-of-fit.
Overall, the inclusion of sentiment data effectively
enhances the predictive power and stability of the
model. It also validates the critical role of sentiment
factors in passenger flow forecasting.
6 DISCUSSION
6.1 Passenger Flow Influencing Factors
6.1.1 Key Aspects of Existing Research on
Subway Passenger Flow Prediction
Researchers often predict passenger flow using
historical data. However, external environmental
factors, such as weather conditions, holidays, and
unexpected events like pandemics, also play a
significant role. The structure of the transportation
network has a major impact as well. Factors like the
layout of transfer stations, congestion levels on
subway lines, and accessibility to other modes of
transport all influence ridership. Additionally,
socioeconomic factors cannot be overlooked. Urban
population density, economic development levels,
and the distribution of employment centers are
closely linked to subway passenger flow.
6.1.2 Relationship Between Sentiment
Factors and Other Factors
Sentiment factors interact with traditional factors
(such as weather and events). For example, adverse
weather conditions may trigger negative emotions,
which in turn reduce people's willingness to travel.
This will further suppress passenger flow.
Unexpected events may also induce negative
emotions (such as anxiety and panic), leading
passengers to opt for alternative transportation
methods. Peak hours are typically associated with
negative emotions, indicating a high volume of
passenger flow during these periods.
Sentiment directly influences passengers' travel
choices and also act as a mediating variable. It can
amplify or mitigate the effects of traditional factors
on passenger flow. For instance, during large-scale
performances, passengers generally experience high
levels of positive emotions (e.g.,excitement and
anticipation). These positive emotions may
encourage people to travel even in bad weather,
thereby weakening the negative impact of poor
weather on passenger flow. Similarly, during the
holiday, the increase in positive sentiment
significantly boosts subway ridership, especially at
stations near tourist attractions and shopping districts.
Sentiment considerations' effects on subway
passenger flow exhibits spatiotemporal
heterogeneity. For example, negative sentiment on
weekdays may have a more pronounced effect on
passenger flow than on weekends.
6.2 Recommendations for Optimizing
Subway Services and Enhancing
Passenger Experience
6.2.1 Sentiment Monitoring and Response
Subway operators can utilize social media sentiment
analysis to monitor passengers' opinions on subway
services and identify potential factors causing
fluctuations in passenger flow (e.g., equipment
failures, overcrowding). Timely optimizations and
adjustments can help mitigate the spread of negative
emotions.
6.2.2 Optimized Passenger Flow
Management
Dynamic Scheduling: During periods of high
negative sentiment (e.g., holidays, post-incident
scenarios), subway operators can dynamically adjust
train dispatching and increase service frequency.
Predictive Optimization: By analyzing historical
sentiment data, subway operators can predict which
routes or time slots are prone to generating negative
emotions and take preemptive measures to optimize
management strategies.
6.2.3 Enhancing Travel Environment and
Passenger Experience
Research suggests that passenger satisfaction with
cabin comfort, transfer convenience, and station
environments is closely linked to overall positive
sentiment. To enhance travel experiences, subway
operators can improve station signage and provide
more guidance information to reduce passenger
anxiety caused by getting lost. They can also enhance
travel environments through music, lighting
adjustments, and ambient improvements to boost the
proportion of positive emotions.
PRMC 2025 - International Conference on Public Relations and Media Communication
358

6.3 Future Research Directions
6.3.1 Refinement of Sentiment Analysis
Future studies can explore the impact of different
sentiment intensities on passenger flow and the
dynamic effects of sentiment transitions (e.g., how
shifts from positive to negative sentiment influence
ridership trends). The impact of specific emotion
categories (such as anger, anxiety, and impatience) in
different travel scenarios could also be investigated.
For example, impatience may be linked to subway
congestion during rush hours, whereas anxiety may
correlate with unexpected incidents or service
disruptions. A deeper analysis of these emotional
factors could enhance predictive accuracy and
improve travel behavior modeling.
6.3.2 Integration of Multi-Modal or
Multi-Source Data
A single data source may not adequately convey the
complexity of passenger flow variations. The
integration of multi-modal data (e.g., real-time
location tracking, video surveillance, and social
media analytics) can help develop more adaptable
forecasting models, improving accuracy across
diverse travel scenarios.
7 CONCLUSION
This study explores the integration of social media
sentiment analysis with subway passenger flow
prediction. It investigates the relationship between
sentiment fluctuations and passenger volume changes
while validating the role of sentiment data in
forecasting. A combination of literature review and
empirical analysis reveals that social media sentiment
data offers valuable insights into behavioral patterns.
These enhance accuracy in passenger flow
predictions. Additionally, incorporating deep
learning and multi-source data fusion further
optimizes predictive models. It offers subway
operators more precise decision-making support.
This study employs sentiment analysis, descriptive
statistics, and correlation analysis on the data. Results
indicate a significant correlation between social
media sentiment trends and subway passenger flow.
An increase in negative sentiment may indicate a
short-term decline in passenger volume, while
positive sentiment is often associated with increased
ridership. Moreover, particularly in scenarios
involving unexpected events or special holidays,
integrating sentiment analysis with machine learning
models significantly improves prediction accuracy .
Under such conditions, sentiment-driven forecasting
outperforms traditional models in terms of fit. Based
on these findings, this study proposes a sentiment-
driven management decision framework. It includes
crowding warnings, priority-based passenger
dispersion strategies, and emergency response plans.
These helps subway operators optimizing resource
allocation and improve operational management.
The key contribution of this study lies in the
introduction of social media sentiment analysis as an
additional information source. Combing with data
mining and deep learning techniques, it enhances the
precision of subway passenger flow forecasting.
Compared to traditional models, this approach
considers raw passenger data and incorporates
passenger emotions, making predictions more
interpretable and practical. In the future, this
methodology can be extended to other urban public
transportation systems and applied to smart city
management. It might also offer insightful
information for emergency response plans and urban
transportation planning.
REFERENCES
Chen, X., Wang, Z., & Di, X. 2023. Sentiment analysis on
multimodal transportation during the COVID-19 using
social media data. Information 14(2):113.
Essien, A., Petrounias, I., Sampaio, P., et al. 2021. A deep-
learning model for urban traffic flow prediction with
traffic events mined from Twitter. World Wide Web
24(4):1345–1368.
Fu, X., Zuo, Y., Wu, J., et al. 2022. Short-term prediction
of metro passenger flow with multi-source data: A
neural network model fusing spatial and temporal
features. Tunnelling and Underground Space
Technology 124:104486.
Lin, C., Wang, K., Wu, D., et al. 2020. Passenger flow
prediction based on land use around metro stations: A
case study. Sustainability 12(17):6844.
Ma, D., Guo, Y., & Ma, S. 2021. Short-term subway
passenger flow prediction based on GCN-BiLSTM.
IOP Conference Series: Earth and Environmental
Science 693(1):012005.
Roumeliotis, K. I., Tselikas, N. D., & Nasiopoulos, D. K.
2024. Leveraging large language models in tourism: A
comparative study of the latest GPT Omni models and
BERT NLP for customer review classification and
sentiment analysis. Information 15(12):792.
Tu, Q., Zhang, Q., Zhang, Z., Gong, D., & Tang, M. 2022.
A deep spatiotemporal fuzzy neural network for
subway passenger flow prediction with COVID-19
search engine data. IEEE Transactions on Fuzzy
Systems 31(2):394–406.
Volovski, M., Grillo, N., Varga, C., Saeed, T. U., & El-
Hakim, M. 2021. Subway ridership: Accounting for
Sentiment Analysis-Based Subway Passenger Flow Prediction and Decision Support
359

regional variation across land-use and socioeconomic
settings. Journal of Infrastructure Systems
27(2):04021010.
Wang, X., Guo, Y., Bai, C., et al. 2020. The effects of
weather on passenger flow of urban rail transit. Civil
Engineering Journal 6(1):11–20.
Xiong, Z., Zheng, J., Song, D., et al. 2019. Passenger flow
prediction of urban rail transit based on deep learning
methods. Smart Cities 2(3):371–387.
Xue, G., Liu, S., Ren, L., et al. 2022. Forecasting the
subway passenger flow under event occurrences with
multivariate disturbances. Expert Systems with
Applications 188:116057.
PRMC 2025 - International Conference on Public Relations and Media Communication
360
