
Convolutional Neural Network Based Crop Monitoring
Sasikala C.
1
, Sainath Reddy R.
2
, Sree Ram Vijaya Vikram R.
2
,
Pavan Kumar Ram Prasad D.
2
and Satish G.
2
1
Department of CSE, Srinivasa Ramanujan Institute of Technology, Rotarypuram Village, BK Samudram Mandal,
Anantapur District‑515701, Andhra Pradesh, India
2
Department of CSE(AI&ML), Srinivasa Ramanujan Institute of Technology, Rotarypuram Village, BK Samudram Mandal,
Anantapur District, 515701, Andhra Pradesh, India
Keywords: Machine Learning, Crop Monitoring, Ripeness Classification, Disease Classification, Histogram of Oriented
Gradients, Convolutional Neural Networks, Sustainable Agriculture.
Abstract: To ensure sustainable crop production, farmers need to focus on efficient farming practices such as crop
health, soil health, pest control and yield analysis. This process relies on reliable monitoring of disease and
ripeness classification. This paper provides a machine learning system that classifies the crop images based
on ripeness and detect diseases. Here for Feature extraction, we use Histogram of oriented gradients, for
ripeness classification we use logistic regression and for disease classification we use Convolutional Neural
Networks. To implement this system, we are using flask-based web interface where it ensures seamless
deployment and we have visual tools like bar chart, pie chart to improve readability. More-over this system
provides insights to nutrient management to optimize yields and reduce crop losses. A voice enabled feature
enables that farmers can retrieve the information about yield analysis, nutrient management, remedial
measures, and disease classification. This system improves efficient crop monitoring where it can minimize
the errors from manual inspection, to maintain sustainable agricultural productivity and it supports decision
making based on data to enhance crop health and yield impact.
1 INTRODUCTION
Agricultural productivity is the core element of food
security and economic stability. To maintain the
proper balance between yield and sustainability, we
need to be aware of crop diseases and quality
monitoring inefficiencies. Ensuring timely
identification of the diseases and proper assessment
of ripeness is important to meet the demands of global
food production. To implement this process, we have
technological innovations, especially in machine
learning and deep learning models offer solutions to
these problems, which enable farmers to make
informed decisions and maintain good crop
production.
This proposed work involves machine learning
models to classify crop diseases and ripeness,
addressing crucial aspects regarding agricultural
monitoring. Features are extracted using Histogram
of Oriented Gradients (HOG); we classify crop
ripeness using logistic regression, and we classify
crop diseases using convolutional neural networks.
The provided system performs very well against all
metrics, where it achieves a high accuracy
demonstrated by an F1 score of 92.3%. It ensures
reliability and effectiveness in real-world
applications.
A seamlessly integrated web-based solution
developed by using Stream-lit and Flask. It ensures
that accessibility and ease of use are available to
users. The system provides various visualizations to
enhance decision-making, including disease yield
impact analysis, disease distribution pie charts,
disease progression timelines, and nutrient
requirement analysis. These insights help farmers and
researchers to improve decision-making ability so
that in the future they will get better results, and also
they will evaluate classification accuracy, disease
trends, and crop health in real time.
Additionally, disease classification, the solution
offers a recommendation system where it includes
nutrient management recommendations to optimize
yield and minimize crop issues. It offers a voice-
enabled feature that helps farmers to analyze disease
856
C., S., R., S. R., R., S. R. V. V., D., P. K. R. P. and G., S.
Convolutional Neural Network Based Crop Monitoring.
DOI: 10.5220/0013956600004919
Paper published under CC license (CC BY-NC-ND 4.0)
In Proceedings of the 1st International Conference on Research and Development in Information, Communication, and Computing Technologies (ICRDICCT‘25 2025) - Volume 5, pages
856-861
ISBN: 978-989-758-777-1
Proceedings Copyright © 2026 by SCITEPRESS – Science and Technology Publications, Lda.

effects and predicted yields by delivering analyses
and suggesting corrective actions. This solution
automates the process of monitoring crops, which
reduces manual errors, enhances classification
accuracy, and tackles agricultural issues related to
diseases. This leads to greater productivity and
improved crop quality and plays a part in global food
security.
2 RELATED WORKS
In precision agriculture, classifying plant diseases
with the help of convolutional neural networks is
essential. Sharma, R., & Jain, A. (2020) To identify
crop diseases from visual attributes such as color,
shape, and texture, we employ image processing
methods like convolutional neural networks. In the
past, many existing machine learning models, like
support vector machine (SVM), k-nearest neighbor
(K-NN), and random forests, relied on manual
inspection for feature extraction, with time being a
critical factor as well. Shah, M. et al, (2019).
Convolutional neural network (CNN) is considered as
the best technique in this field, and it automatically
extracts spatial features and improves highly accurate
disease classification. Earlier, Mohanty et al (2016)
achieved over 99% accuracy in identifying 38 crop
diseases using CNNs. Barbedo, J. G. A. (2019) We
have open datasets like Plant Village; it includes all
types of diseases where we identify common tomato
diseases.
Simonyan, K., & Zisserman, A. (2014). To
improve harvesting techniques and maintain quality
control, ripeness classification is essential. Existing
manual methods lead to errors, are time-consuming,
have limited accuracy, and depend on human
judgment, while new technology innovations like
machine learning models and computer vision
techniques are used to classify ripeness based on
features like shape, color, and texture. Qin, Z.
(2016).To identify ripeness, colour is a key indicator,
with colour space transformations (eg. RGB to HSV)
and histogram analysis to access ripeness stages.
Hinton, G.E., et al, (2012). New advancements
involve CNNs to train on labelled datasets to
achieving high accuracy in classifying ripe, unripe,
old and damaged crops. Ivanovici, M. et al, (2024)
Lighting variations are addressed through techniques
and solved using data processing techniques.
Recommendation systems provide actionable
insights to farmers to mitigate diseases and to analyze
yield impact. These systems suggest soil nutrients,
yield impact, nutrient requirements, remedial
measures, and a voice-enabled feature where it can
help farmers to interact and know more about the
harvesting problems. Earlier, research by Singh et al.
(2018) implements a hybrid recommendation system
that combines rule-based systems and filtering to
recommend best practices to farmers regarding plant
diseases. Moreover, nutrient management has been
highlighted as a key indicator in improving harvesting
and recovery.
Bochtis, D. et al, (2018). Image-based
classification and recommendation systems have
faced so many challenges, such as environmental
factors (lighting, background clutter), image quality
like low-resolution images, blurry images, and not
being suitable for large datasets [10]. In the future, the
advanced technologies used for agricultural disease
management involve integrating IoT sensors, cloud
computing, and AI platforms for data collection and
analytics. This method improves model performance
and gets better results for disease classification and
recommendations while improving scalability.
Moreover, the incorporation of multilingual voice
outputs enhances the accessibility of this work for
farmers aiming at sustainable crop production.
3 DESIGNED SYSTEM
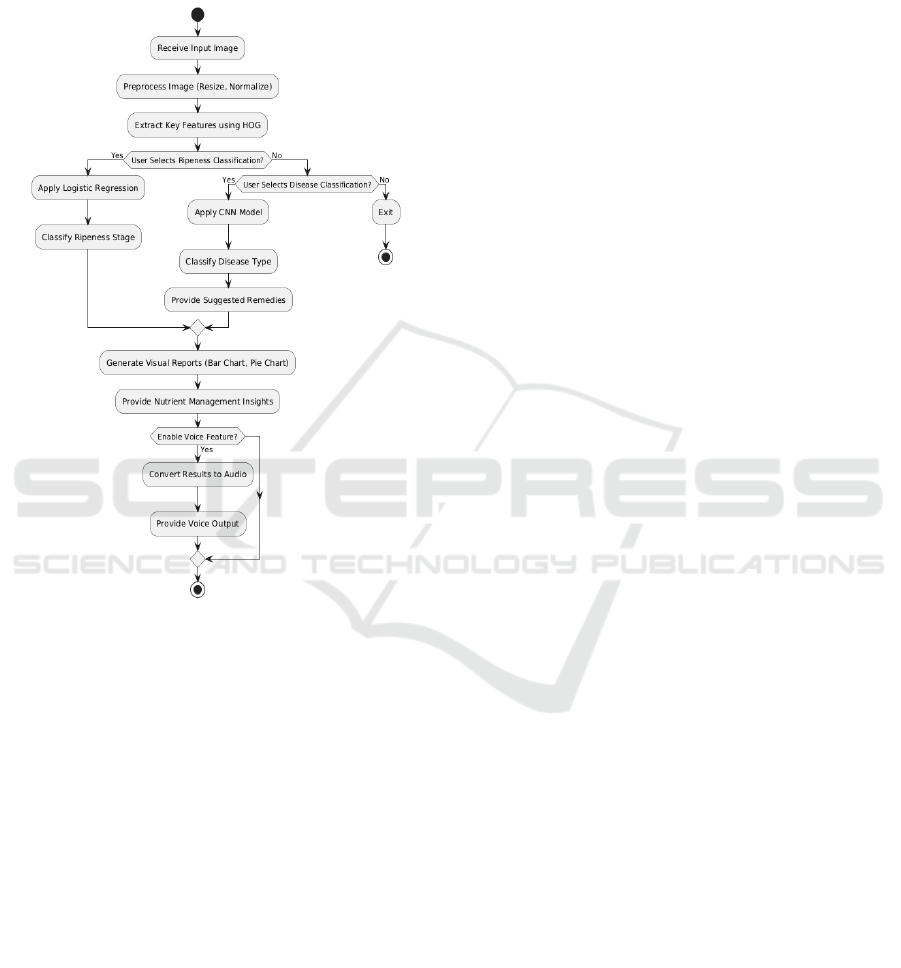
The designed system is used to show the detailed
description on how the images are analyzed and it
also focuses on two main objectives: ripeness
detection and disease classification. Figure 1
illustrates how the system works on the images
dataset and the images are divided into two types:
Ripe Images and Disease images, we need to select
which types of images we are choosing and when the
ripeness classification option is chosen the system
performs ripeness classification over the image and
determines how ripen is the fruit or vegetable and if
the disease detection option is selected the system
performs disease classification and identifies what
kind of disease it is and displays the severity of the
disease over a graph scale.
After the disease classification and ripeness
classification, the next step is visualizations where the
learned data is represented in an interpretable format
so that farmers can easily understand it by observing
it. Users can then have three options to make action
selections, such as prediction, recommendation, or
both. Prediction can give brief description about the
disease name and yield analysis, while
recommendation provides actionable information,
including nutrient requirements and management
suggestions and while selecting both, it provides both
Convolutional Neural Network Based Crop Monitoring
857
prediction and recommendation analysis in a
comprehensive way offering in depth evaluation. The
final step involves a voice response feature,
delivering the results in a user-friendly manner and an
understandable way, providing actionable insights to
the user.
Figure 1: Proposed system for crop monitoring.
Figure 1 - The proposed system involves
technologies such as machine learning and image
processing to improve agricultural productivity and
decision-making. It effectively leverages advanced
methods to get actionable insights, supporting
farmers to have efficient crop yield and sustainable
farming. This will reduce manual errors and increase
crop production, which results in better productivity,
and this will benefit farmers to get better yield
production.
4 IMPLEMENTATION
4.1 Preprocessing Techniques
Picture Scaling and Normalization: Picture scaling is
used to resize the image depending on their size as the
data can be in different sizes typically, they are of
224x224 pixels, to ensure the linearity in the dataset,
normalization is used in resizing the images pixel
values to the range of (0,1) this improves model’s
intersection.
Data Augmentation: Data Augmentation is used
to improve the diversity of training data and also
reduces overfitting, it also involves some techniques
such as rotation, flipping, zooming and adjustments
on brightness are applied. This step not only increases
the size of dataset but also allows the model to
normalize in a much simpler way by learning from
different examples.
Label Encoding: Each and every image in the
dataset is labelled and also helps to indicate or
identify the type of class such as healthy, blight or
ripe. These labels are again converted into numerical
values in order to serve as inputs during the model’s
training.
Noise Removal and Image Filtering: Lack of
better resolution in image and irrelevance in the
content or excessive noise are eliminated in order to
maintain the dataset’s integrity. This step promises
that the model is properly trained with data which is
more precise and accurate.
4.2 Methodologies
An experimental design is chosen in this research.
The reason behind this is to improve and validate a
hybrid system that detects multiple diseases in a
tomato plant and also performs ripeness
classification. The ultimate goal was to integrate
feature extraction using Histogram of Oriented
Gradients (HOG) and to perform image classification
using Convolutional Neural Networks (CNN) in
order to achieve the prediction that are more precise
and trustworthy. This research methodology also
involves preparation and preprocessing of datasets,
feature extraction, model training, deployment and
evaluation. A web application that was interactive
towards the users was developed to make the system
more user friendly.
4.2.1 Feature Extraction Using HOG
The Histogram of Oriented Gradients (HOG) is used
to extract features that are more robust in nature while
performing the tasks. Figure 2 illustrates the working
of feature extraction using HOG.
The primary step for feature extraction begins
with an original image that contains raw data, after
that aligning the image according to the standards.
The image resized has a fixed dimension of 128x128
pixels this process can be applied to multiple images
ICRDICCT‘25 2025 - INTERNATIONAL CONFERENCE ON RESEARCH AND DEVELOPMENT IN INFORMATION,
COMMUNICATION, AND COMPUTING TECHNOLOGIES
858
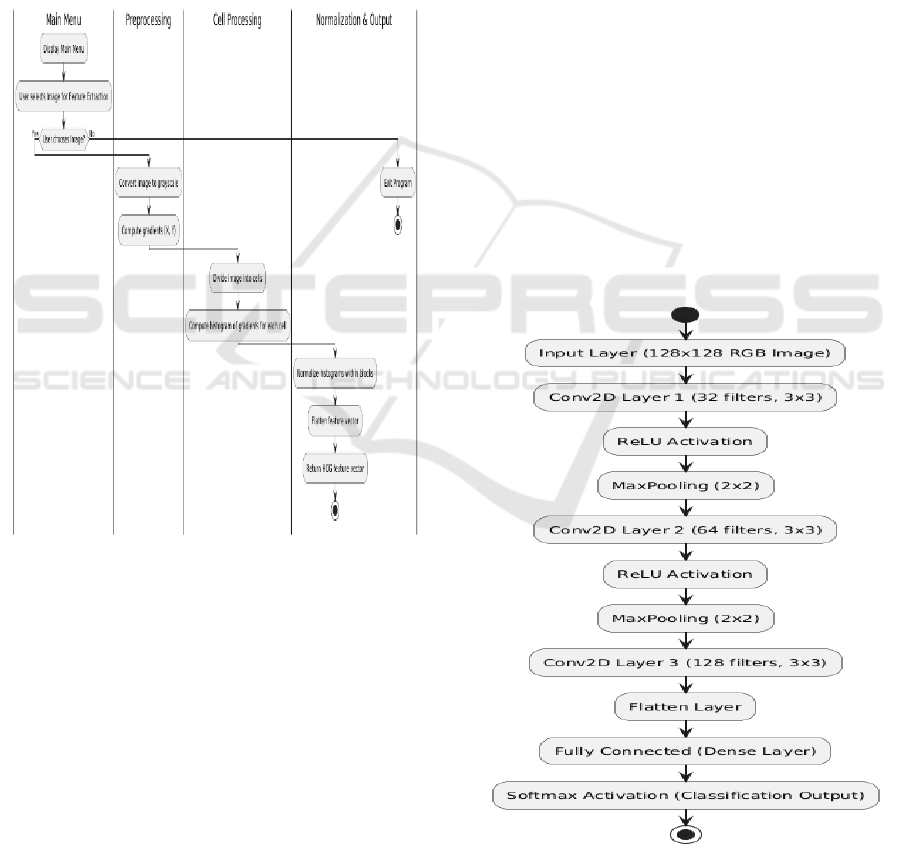
by applying the consistent feature. Later the input
image is divided into non-overlaying cells with a
pixel size of 16x16, this step is important as it
captures all the local features, structure and texture of
the image. The fifth step Gradient computation is an
important step in HOG it measures the pixel intensity
of an image its main purpose is to detect sharp edges,
shapes, texture of an image. After the Gradient
computation step the fifth step is Feature Vector
Generation which is used to divide the image into
small cell of 8x8 size where each cell has HOG in
different direction, the final result is a feature vector
representing edges, contours, patterns, and texture of
an image.
Figure 2: Feature extraction.
4.2.2 CNN Architecture
CNN plays an important role to process and classify
the image based on the disease. Figure 3 explains the
architecture of convolutional neural network, the
input for the model leaf image dimensions is
128x128x3 and passes through several layers, Input
layer is the first layer where images are represented in
RGB and all the images are resized into 128x128x3
pixels for uniformity, after this convolution layer 1
model is used, this uses 32 filters with a dimension of
3x3 along with RELU function. It takes of extra
features like edges, shapes, patterns, etc.., the next
step is Max Pooling Layer 1 where the pooling size is
2x2 filter is used to reduce the dimensions for a
feature map to 64x64x32 while retaining essential
features this layer also reduces the noisy input data.
Now the Convolution Layer 2 is used where the
filters are increased from 32 to 64 to detect more
complexes, kernel size of 3x3 is used along with the
RELU function, this layer is used to extract specific
disease patterns. The fifth step is Max Pooling Layer
2 this layer performs with pooling size of 2x2 to
reduce further dimensions for feature map 32x32x64
and retains all essential features, now the Convolution
Layer 3 is used where the filters are increased from
64 to 128 to identify more complex patterns, it also
uses 3x3 kernel along with RELU function this layer
is used to detect irregular textures and patterns in the
image. Flatten layer is the next step where multi-
dimensional maps convert into 1D array, this process
is done for the next layer’s input process which is
dense layer. Dense layer performs to learn high level
relationships between extracted features. It requires
512 neurons along with the RELU activation
function. Dropout regularization is also performed to
prevent overfitting. The final step Output Layer
consisting of 10 neurons, corresponding to disease
classes where a SoftMax activation function is used
to assign probabilities for each disease class and it
enables multi-class classification.
Figure 3: Convolutional neural network.
Convolutional Neural Network Based Crop Monitoring
859

5 RESULTS AND ANALYSIS
This section is very crucial for any model. Results and
Analysis section is to analyze model performance. It
involves analyzing the experiments outcomes and
comparing the proposed solution with existing model.
So that we can get an idea about the proposed model
performance.
5.1 Evaluation Metrics
Accuracy: Accuracy is a crucial evaluation metric to
assess model performance. This model achieves an
accuracy score of 93% indicates the correctness in
classifying plant diseases and ripeness.
Precision: Precision is an essential evaluation
metric to assess model performance. This model
achieves 92% indicates that a plant has a disease or a
certain ripeness level. It means this model avoids
making incorrect positive predictions.
Recall: Recall is an evaluation metric to assess
model performance. This model achieves a recall
score of 90% which indicates the model is good at
identifying the correctly disease plant.
F1-Score: F1-score is an evaluation metric to
assess model performance. This model achieves a F1-
score of 92.3% which indicates that this model is well
balanced between precision and accuracy. It also
ensures that the model is both accurate and consistent.
Specificity: For this evaluation metric, it achieves
94% score which explains the model's performance in
identifying healthy plants.
5.2 Graphical Representation
5.2.1 Training and Validation Accuracy
Analysis
Figure 4 shows the Training accuracy and Validation
accuracy changes of the model performance over four
epochs during the training process. In this figure, X-
axis represents the number of epochs and Y-axis
represents the accuracy values. As this figure
describes how the model is classifying plant diseases
over training and validation processes.
Blue line describes the training accuracy which
increases gradually with each epoch highlighting the
model's performance to adapt and improve on the
training data. Orange line represents the validation
accuracy which steadily increases, highlights how the
model performs against unseen data.
As this progress indicates that there is a parallel
improvement in both training and validation accuracy
which explains the model balanced learning process.
Gap between two accuracies is relatively small which
shows there is no chance for overfitting and
underfitting. This reflects that the model adapts well
to the validation dataset.
Figure 4: Training accuracy vs validation accuracy.
5.2.2 Training and Validation Loss Analysis
Figure 5 shows the Training loss and Validation loss
changes of the model performance over four epochs
during the training process. In this figure, the X-axis
represents the number of epochs and the Y-axis
represents the loss of values. As this figure assesses if
your model is actually learning patterns or just
identifying patterns and also prevents from
overfitting.
Blue line explains the training loss which
decreases gradually with each epoch illustrating the
model is learning from the training data. Orange line
represents the validation loss which decreases rapidly
over epochs represents improved performance on
unseen validation data.
As both training loss and validation loss decrease
over epochs suggests that the model is learning
effectively and prevents overfitting.
Figure 5: Training loss vs validation loss.
ICRDICCT‘25 2025 - INTERNATIONAL CONFERENCE ON RESEARCH AND DEVELOPMENT IN INFORMATION,
COMMUNICATION, AND COMPUTING TECHNOLOGIES
860
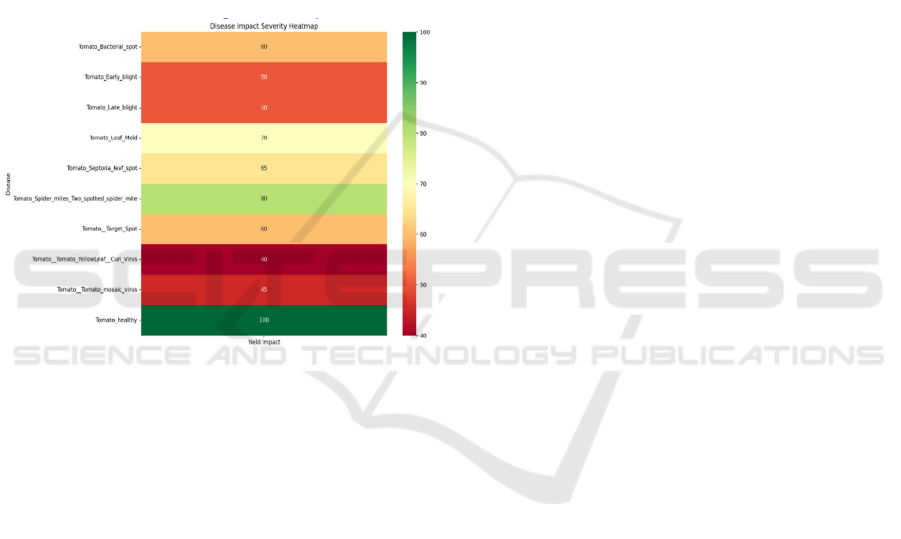
5.2.3 Disease Impact Severity Analysis
Figure 6 indicating heatmap showing the impact
severity of various diseases on tomato yield. The X-
axis represents the yield impact severity as percentage
and Y-axis represents lists of diseases.
Color scale is used to represents how the disease is
impacted. The color ranges from red (low impact) to
green (high impact), along with intermediate shades
indicating severity levels. The healthy tomato is
marked with the highest yield impact (100%), the
diseases show the least yield impact as 40% and 45%
respectively.
This visualization helps in identifying which
diseases has most significant yield impact, providing
a brief overview of their impact severity.
Figure 6: Disease impact severity heatmap.
6 CONCLUSION AND
PROSPECTS
This research provides an in-depth explanation for
disease classification and ripeness classification.
Additionally, it includes visualizations to understand
in detail and recommendations to improve crop yield
and to reduce manual error. A voice-enabled feature
is featured to provide detailed explanations about
disease classification, ripeness classification, and
recommendations to farmers.
For disease classification, we use a convolutional
neural network to analyze images, and to extract
features for ripeness classification, we use a
histogram of oriented gradients.
This system provides an interface that integrates
visual insights through graphical representation.
These visualizations help in identifying diseases and
crop yield and maximizing nutrients to improve yield.
This results in reducing manual errors, improving
decision making, promoting sustainable farming
practices and enhancing productivity and crop health.
The proposed system has solved so many issues
that were addressed previously, but apart from the
existing solution, there are several areas where the
proposed work needs to be expanded so that it
maximizes productivity and promotes sustainable
farming.
The key areas for expansion include Extension to
other crops, Real-Time Monitoring and IoT
Integration, Enhanced Dataset Diversity, Multi-
Language Voice Assistance and Integration with
Drone-Based Crop Monitoring.
REFERENCES
Barbedo, J. G. A. (2019). Plant disease identification from
individual lesions and spots using deep learning.
Biosystems Engineering, 180, 96-107.
El Sakka, M., Mothe, J., & Ivanovici, M. (2024). Images
and CNN applications in smart agriculture. European
Journal of Remote Sensing, 57, 2352386.
Hossain, M.A., & Sajib, M.S.A. (2019).Classification of
image using convolutional neural network (CNN).
Global Journal of Computer Science and Technology,
19, 13–14.
Jha, K., Doshi, A., Patel, P., & Shah, M. (2019). A
comprehensive review on automation in agriculture
using artificial intelligence. Artificial Intelligence in
Agriculture, 2, 1-12.
Krizhevsky, A., Sutskever, I., & Hinton, G.E. (2012).
Imagenet classification with deep convolutional neural
networks. Advances in Neural Information Processing
Systems, 25, 1097-1105.
Liakos, K.G., Busato, P., Moshou, D., Pearson, S., &
Bochtis, D. (2018). Machine learning in agriculture: A
review. Sensors, 18, 2674.
Mohanty, S. P., Hughes, D. P., & Salathé, M. (2016). Using
deep learning for image-based plant disease detection.
Frontiers in Plant Science, 7, 1419.
Qin, Z. (2016). Precision Agriculture Technology for Crop
Farming. CRC Press.
Sharma, R., & Jain, A. (2020). Fruit Ripeness Detection
Using Image Processing and Machine Learning
Techniques: A Review. International Journal of
Applied Sciences and Technology, 2(5), 1–10.
Simonyan, K., & Zisserman, A. (2014). Very Deep
Convolutional Networks for Large-Scale Image
Recognition. arXiv preprint arXiv:1409.1556.
Convolutional Neural Network Based Crop Monitoring
861
