
Stock Market Forecasting with Machine Learning
P. Jacob Vijaya Kumar
1
, Shaik Fayaz
2
, Moghal Rasool Baig
2
, Shaik Mohammad Ershad
2
and Vadla Uday Kiran
2
1
Department of Computer Science and Engineering (AI-ML), Santhiram Engineering College,
Nandyal, Andhra Pradesh, India
2
Department of Computer Science and Design, Santhiram Engineering College, Nandyal, Andhra Pradesh, India
Keywords: Stock Prediction, Machine Learning, Deep Learning, Bayesian Optimization, Streamlit.
Abstract: Stock prices shift each day. People look for ways to predict where they might move next. Computers learn
from past trends and patterns to make smart guesses about future changes. Some methods focus on recognizing
trends. XGBoost, Random Forest, and Support Vector Regression study past stock behavior to predict
upcoming movements. Others focus on time-based patterns. LSTM and GRU observe how prices change over
time, adapting as they learn. Accuracy matters. Randomized Search CV helps adjust machine learning models
for better results. Bayesian optimization refines deep learning models, improving their performance step by
step. No single approach is enough. Machine learning and deep learning predictions are blended together,
reducing errors and increasing reliability. Users need simple access. A web tool built with Streamlit presents
forecasts in a clear way. Data comes from Yahoo Finance will ensure up-to-date stock information is used. By
combining these methods stock predictions become sharper. This approach offers a better way to understand
future market trends.
1 INTRODUCTION
Forecasting prices of stocks has always been a
stochastic process. It was high time for the contract
market to adjust the numbers. A number of elements
determine its course. Traditional methods have
difficulty with sudden changes or floods of new data.
Machine learning introduces an element of
intelligence. It learns from past trends. It predicts
based on patterns. But even the cleverest models
stumble when the market acts in ways they have never
encountered. That’s where deep learning comes into
play. It does not dumb like picture models, it adjusts.
It develops as the market changes. It does not simply
refer to past trends. It learns from what is changing,
at the moment. Over the years, its predictions become
increasingly sharp. It learns new patterns and
modifies its internal model. Machine learning + Deep
Learning: This is a great combination One analyzes
past trends. The other adapts to new ones. Pass
combined makes stock predictions more trustworthy
by giving investors better insights into an
unpredictable use.
2 LITERATURE REVIEW
2.1 How Machine Learning Assists
Stock Market Predictions
The automatic trading of stocks uses machine
learning that analyzes historical prices and identifies
patterns. People prefer it because it:
• Can quickly go through large amounts of
data
• Finds connections that humans might miss
• Adjusts to market changes over time
But standard stock prediction models have some
issues:
• They don’t always handle sudden price
jumps well
• They might focus too much on past trends
and make wrong guesses
• Their decisions are sometimes too complex
to explain
By adding deep learning and better data processing
this system makes predictions more accurate and
flexible by helping investors make better choices.
Kumar, P. J. V., Fayaz, S., Baig, M. R., Ershad, S. M. and Kiran, V. U.
Stock Market Forecasting with Machine Learning.
DOI: 10.5220/0013942400004919
Paper published under CC license (CC BY-NC-ND 4.0)
In Proceedings of the 1st International Conference on Research and Development in Information, Communication, and Computing Technologies (ICRDICCT‘25 2025) - Volume 5, pages
697-703
ISBN: 978-989-758-777-1
Proceedings Copyright © 2026 by SCITEPRESS – Science and Technology Publications, Lda.
697

2.2 How Does Machine Learning Play
a Role in Stock Market Predictions
It is utilised to predict prices more cleverly and
swiftly by stock specialists.
• Detecting Hidden Patterns: It analyses
previous stock prices and really identifies
trends that humans tend to ignore.
• Critical processing: It doesn’t make
decisions influenced by feelings unlike
humans it only looks in numbers.
• More Intelligent Predictions: By studying
past movements, it gives better estimates of
where stocks may head in the future.
2.3 Big Improvements in Stock Market
ML
• Mixing Different ML Methods: Some
models now use both deep learning and
traditional techniques to improve
predictions.
• Tracking News Instantly: ML tools can
scan news and social media in real time to
predict market changes.
• Noticing Odd Moves: Some ML systems
catch unusual trading behaviors that might
signal fraud or market tricks.
2.4 Challenges and Future Possibilities
ML is beneficial but certain issues persist.
• Messy Data: Stock market data can be full
of errors by making it hard for ML to learn
correctly.
• Unexpected Market Crashes: If something
big happens like a sudden crisis then ML
predictions can fail.
• Expensive Technology: Training ML
models needs powerful computers which
everyone cannot afford.
2.5 What Researchers Are Working On
• Making the ML Models Lighter: Experts
are working on models that do not need
heavy computing making stock predictions
faster and more efficient.
• Keeps Data Secure: New methods help to
protect user privacy while improving
prediction accuracy.
• Mixing of More Data Sources: Future
models may combine stock trends with real-
time news and economic events for smarter
predictions.
3 EXISTING SYSTEMS
3.1 Problems from Old Stock
Prediction Methods
• Not Enough Data is Considered:
Traditional systems mostly use past stock
prices by ignoring real-time market
influences.
• Struggle with the Sudden Market Shifts:
Big changes like economic crashes will
often make old methods unreliable for
prediction.
• Can not Recognize Fraud: Old models
struggle to find strange trading activities and
market tricks.
3.2 ML That Reads the Market’s Mood
How This Model Works: This system tracks stock
prices and market trends in real-time. It uses machine
learning to study past data and find patterns. By doing
this it predicts how the market might move. The
model adapts to the latest market changes and helps
investors understand where prices are headed.
Uncommon Merits:
• Uses smart machine learning to find hidden
patterns.
• Harder for fake news or sudden hype to trick
the system.
Drawbacks:
• Needs strong computers to work fast.
• Struggles with totally random events like
global crises. `
3.3 Blazing-Fast Stock Movement
Detection
How it works: Using models like LSTM and
Transformer, this system predicts where stock prices
might go next. It looks at historical stock data and
tries to find patterns that show up over time. Even
when the market is changing quickly the model keeps
up and gives predictions about stock movements.
Cool features:
• Can track many stocks at once.
• Works even when the market is moving
wildly.
ICRDICCT‘25 2025 - INTERNATIONAL CONFERENCE ON RESEARCH AND DEVELOPMENT IN INFORMATION,
COMMUNICATION, AND COMPUTING TECHNOLOGIES
698

Drawbacks:
• Needs powerful graphics cards to run well.
• Still has trouble with stocks that move
unpredictably.
3.4 Fake Stock Hype Buster
How it works: This system watches for both real and
fake stock movements. It compares stock changes
with news and social media. The model looks for fake
trends and warns investors before they are tricked. It
helps make sure that stock predictions are not affected
by misleading information.
Cool features:
• Catches misleading trends before they trick
investors.
• Helps make stock predictions more reliable.
Drawbacks:
• Needs a huge amount of data to learn
properly.
• Uses a lot of computer power.
3.5 Smart Market Tracking in Real
Time
How it works: This model combines live stock prices
with news and social media to track changes as they
happen. It looks for important trends and sudden
stock movements. By analyzing live data the system
helps spot which stocks are rising or falling fast by
keeping predictions up-to-date.
Cool features:
• Updates instantly with the latest stock
changes.
• Can show which stocks are rising fast or
falling hard.
Drawbacks:
• Needs a steady internet connection.
• Costs more to run because it pulls in live
data.
3.6 Super-Secure Stock Predictions
How it works: This model uses different machine
learning methods together. Each model checks the
others so the predictions are more accurate. The
system reduces mistakes by comparing data from
different sources. This makes stock predictions safer
for investors who want more reliable information.
Cool features:
• Makes predictions more accurate by cross-
checking data.
• Good for people who want safer investment
decisions.
Drawbacks:
• Harder to build and connect all the models.
• Costs more to set up and keep running.
3.7 Comparing Different Stock
Prediction Methods
Table 1 gives the information about the Stock
Prediction.
Table 1: Comparison of Stock Prediction.
Method How It
Works
Why It’s
Useful
What’s Tricky
News &
Social
Media
Analysis
Reads
financial
news and
social
media to
sense
market
mood.
Spots
trends
early,
warns
about hype
or panic.
Can
misunderstand
sarcasm or
fake news.
Smart AI
Stock
Predictions
Uses deep
learning to
study past
stock
prices and
guess
future
trends.
Learns
patterns
well,
adapts to
new trends.
Needs strong
computers,
struggles with
sudden market
crashes.
Detecting
Odd
Market
Moves
Finds
unusual
stock price
jumps or
drops that
seem
suspicious.
Helps
avoid risky
trades,
catches
fraud early.
Can raise false
alarms, needs
lots of past
data.
AI
Learning
to Trade
AI tests
different
trading
strategies
and keeps
improving
over time.
Adapts on
its own,
can make
better
choices.
Takes time to
learn and risky
if trained on
bad data.
Mixing AI
with Old-
School
Indicators
Combines
machine
learning
with charts
traders
already
use (like
RSI,
MACD).
Gets the
best of
both
worlds,
balances
AI with
human
experience.
Harder to set
up, needs
expert fine-
tuning.
Stock Market Forecasting with Machine Learning
699

4 METHODOLOGY
4.1 Problem Definition
The structure in which we do our project in steps to
attain our project goals. The ultimate goal is to create
a smart system that employs machine learning (ML)
methods to forecast stock prices.
• Developing a
Stock Prediction System: The system
will gather historical stock prices, observe price
movements, and analyze the significant leading
indicators that influence stocks. It will seek
to
observe trends in the rise and fall of stock prices.
• Deep Learning Model:
The system will work with
models that are based on RNN like LSTM· GRU
They will review historical prices, remember long-
term trends and will predict stock prices in the future
on the basis of how stocks have behaved
in the past.
• Introducing Classic ML Models to Achieve
Accuracy: To improve predictions, models such as
XGBoost, random forest and SVR will be added.
These models utilize diverse approaches to
unveil
concealed patterns and lessen errors in forecasting.
4.2 Software Requirements
To develop the stock prediction system, we need the
following software tools:
• Development Tools:
o Streamlit (for creating an interactive web
interface)
o TensorFlow & Keras (to train the deep
learning models)
o Scikit-Learn (data preparation and
evaluation)
o XGBoost (boosting accuracy)
o Pandas & NumPy (handling data)
o Matplotlib (making charts and graphs)
4.3 Hardware Requirements
For smooth operation, the system requires:
• At least 8GB RAM to process stock data
efficiently
• A GPU to speed up deep learning model
training
• Fast internet to fetch real-time stock data
4.4 Inputs & Outputs
• Inputs: Stock history data, technical
indicators
• Outputs: Future stock price predictions,
performance graphs, accuracy reports
4.5 Use Case
The system is designed for different users, each with
specific roles:
• User:
o It receives stock-related information from
the user such as the company ticker
symbol, the date range for analysis, and the
prediction period.
o This creates stock predictions which the
user views and interprets alongside their
own analysis to make their decisions.
• System:
o Stock market data, including live and
historical prices, are retrieved by the
system for accurate analysis.
o The data is then cleaned, and a
MinMaxScaler is applied to better
normalize the data points to improve the
model streamline.
o The next step for the system is to build
machine learning models or a deep
learning model to understand the stock
market trends and predict future moves.
o Ultimately system shows the predicted
stock valus as well as trend on
visualization which makes it easy for the
user to perceive stock market movement.
4.6 Data Flow Diagram (DFD)
The Data Flow Diagram (DFD) presents how
information moves through the system. Figure 1
covers:
• The user enters stock-related details such as
the company ticker, time range and
prediction period.
• The system collects stock market data
including past and real-time prices from
reliable sources.
• The collected data is preprocessed, cleaned
and scaled to prepare it for analysis.
• Machine learning and deep learning models
are trained using the processed data to
generate predictions.
• The system then displays the predicted stock
values in a user-friendly format often with
graphs and visual trends to help the user
interpret the results easily.
ICRDICCT‘25 2025 - INTERNATIONAL CONFERENCE ON RESEARCH AND DEVELOPMENT IN INFORMATION,
COMMUNICATION, AND COMPUTING TECHNOLOGIES
700
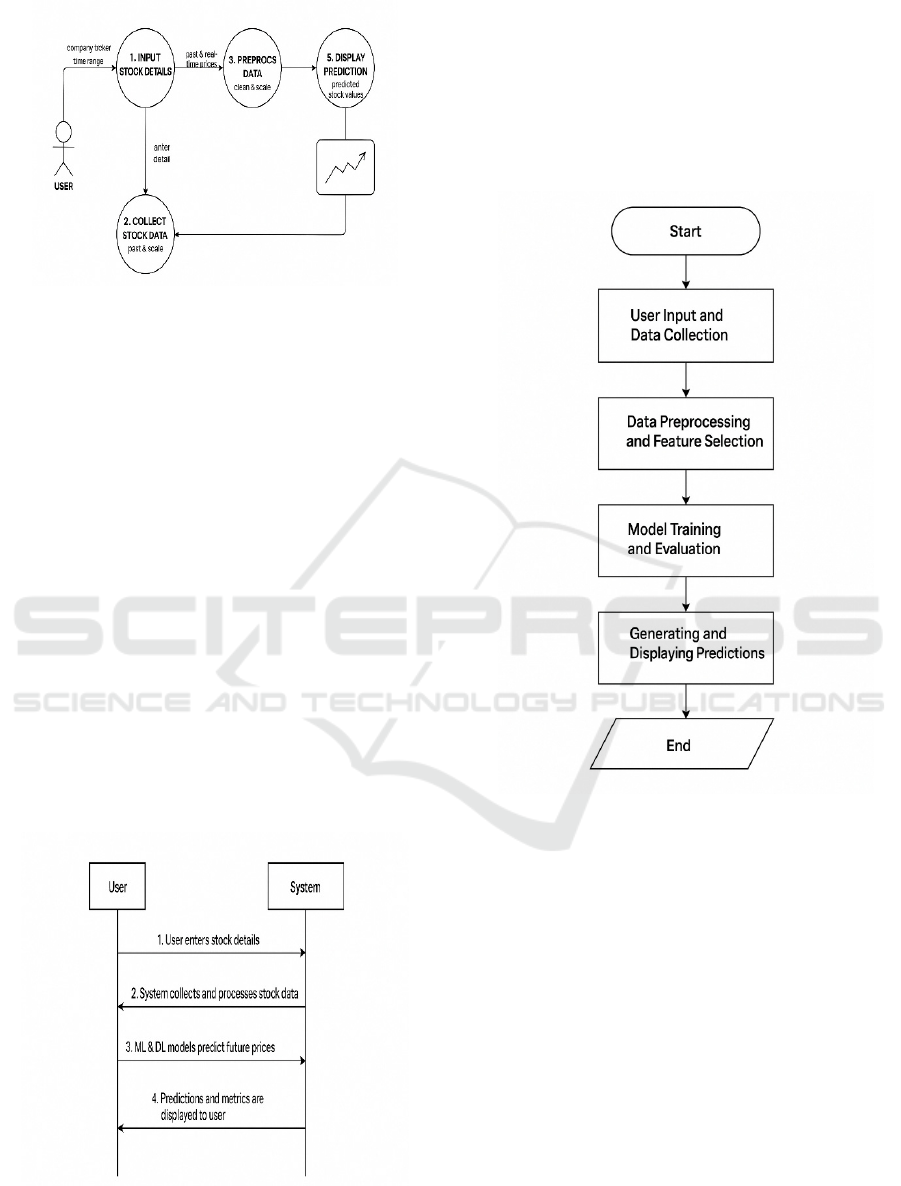
Figure 1: Data Flow Diagram of the Stock Prediction
System.
4.7 Database
The system does not store data in a traditional
database. Instead, it uses caching and storage
techniques to improve efficiency. It manages:
• Stock ticker symbols and details
• Past stock prices
• Preprocessed data
• Saved models for reuse
• Prediction outcomes and accuracy reports
4.8 Sequence Diagram
The Figure 2 Sequence Diagram shows the system's
flow step by step:
1. User enters stock details.
2. System collects and processes stock data.
3. ML & DL models predict future prices.
4. Predictions and metrics are displayed to the
user.
Figure 2: Sequence Diagram of the Stock Prediction
System.
4.9 Flowchart
The Flowchart visually represents how the stock
prediction system operates. Figure 3 illustrates:
• User input and data collection
• Data preprocessing and feature selection
• Model training and evaluation
• Generating and displaying predictions
Figure 3: Flowchart of the Stock Prediction System.
5 EXECUTION AND OUTCOMES
5.1 Overview of the Model
The model combines two major approaches
traditional machine learning and deep learning to
predict stock prices. By merging these methods, it
aims to boost prediction accuracy. Deep learning is
handled through LSTM (Long Short-Term Memory)
and GRU (Gated Recurrent Unit) models, which are
designed to find complex patterns in stock price data.
On the other hand traditional models like XGBoost,
Random Forest, and Support Vector Regression
(SVR) bring in extra insights based on structured
features.
Stock Market Forecasting with Machine Learning
701

5.2 Data Preparation Process
Data collection starts with retrieving stock prices
from Yahoo Finance using the yfinance API. The
'Close' prices are then scaled using MinMaxScaler
which converts them into a range between 0 and 1.
The time series data is structured into windows by
using 60 past days to predict the price for the next day.
This data is split into training and testing sets to
ensure proper evaluation.
5.3 Deep Learning Model Structure
The deep learning part of the model uses a mix of
LSTM and GRU layers, perfect for handling time-
sequenced data like stock prices. These layers are
bidirectional means they process the data both
forward and backward to understand dependencies
from the past and the future. Dropout layers are
included to prevent overfitting by randomly dropping
some weights during training. Training is done using
the Adam optimizer with the learning rate fine-tuned
through Bayesian Optimization.
5.4 Traditional Machine Learning
Models
The traditional machine learning models including
XGBoost, Random Forest and SVR are applied to the
prepared data. Hyperparameter tuning for these
models is carried out using randomized search
techniques to find the best setup for stock price
prediction.
5.5 Model Prediction
At the end of the process the model provides
predictions for the next 30 days of stock prices. The
final output is a combination of predictions from both
the deep learning and machine learning models by
producing a more accurate result through ensemble
methods.
5.6 Checking Model Performance
We tried different machine learning and deep learning
models to predict stock prices. Each model had a
different way of understanding patterns in stock data:
• LSTM – This model remembers past trends
and uses them to predict future stock prices.
• GRU – Works like LSTM but is faster and
needs less memory.
• XGBoost – A smart decision-making model
that finds patterns in stock prices.
• Random Forest – A group of decision trees
that work together to give better results.
• SVR – A model that focuses on predicting
stock prices using advanced math formulas.
To check how well these models work we
measured their accuracy using Mean Squared Error,
Root Mean Squared Error and R² Score. Lower errors
meant the model was predicting better.
5.7 Overall Model Performance
The ensemble model combining deep learning (DL)
and machine learning (ML) which delivers strong
results shown in table 2.
• MAE (Mean Absolute Error): The model’s
predictions are generally close to the actual
stock prices, with only small deviations on
average.
• MSE (Mean Squared Error): While the
model shows some larger errors at times it
remains effective in predicting overall trends
with the larger mistakes helping guide
improvements.
• RMSE (Root Mean Squared Error):
Considering all the errors the model's
predictions are accurate enough by
reflecting the true stock price changes
without large discrepancies.
• R² Score: The model explains almost all of
the variations in stock prices by indicating
that it closely follows the price movements
and can predict them effectively.
Table 2: Ensemble Model Performance Evaluation
(Blended Deep Learning & Tuned Machine Learning).
Metric Value
Mean Absolute Error (MAE) 13.8200
Mean Squared Error (MSE) 234.0953
Root Mean Squared Error (RMSE) 18.2783
R² Score 0.9803
5.8 Saving Predictions in CSV or Excel
To make things easy the system lets users download
stock predictions in CSV or Excel format. Users just
need to choose a stock and a date range and the
system creates a neat file with:
• Date – The day for which the prediction is
made.
• Actual Price – The real stock price, if
available.
ICRDICCT‘25 2025 - INTERNATIONAL CONFERENCE ON RESEARCH AND DEVELOPMENT IN INFORMATION,
COMMUNICATION, AND COMPUTING TECHNOLOGIES
702

• Predicted Price – This model is the best
guess for the stock price.
• Errors – The gap between the real price and
the prediction.
This helps investors check forecasts compare them
with actual prices and plan wisely.
6 CONCLUSIONS
This project uses machine learning to predict stock
prices. It helps investors make better decisions by
showing potential future prices. Instead of guessing it
looks at past stock data and trends to find patterns.
These patterns are used to predict future prices more
accurately.
This helps the system make smart predictions.
Machine learning is great for finding patterns in large
sets of data that are hard for humans to see. By using
this technology, the project gives investors a tool to
predict prices based on real data not just assumptions.
In the end it helps investors plan their actions with
more confidence by making stock predictions clearer
and more reliable.
7 FUTURE SCOPE
In the future we plan to improve the stock prediction
system by integrating live stock data to ensure
predictions are based on up-to-date market
information. By incorporating more financial details
such as earnings reports and economic indicators we
can enhance the accuracy of the forecasts. We also
aim to combine deep learning with other advanced
techniques to make the predictions more adaptive to
market changes by allowing the system to improve
over time. Enhancing the user interface with
interactive charts and graphs will make the system
easier to use and understand. These improvements
will make the system more accurate, efficient and
user-friendly.
REFERENCES
M. S. Sonani, A. Badii, and A. Moin, “LSTM with Graph
Neural Network for Stock Prediction,” arXiv preprint,
2025.
W. Gu, Y. Zhong, S. Li, et al., “Stock Price Prediction Using
LSTM and News Sentiment Analysis,” arXiv preprint,
2024.
C. Fjellström, “Ensemble LSTM Models for Stock Market
Prediction,” arXiv preprint, 2022.
P. Tran, T. K. A. Pham, et al., “Deep Learning for Stock
Trends: A Case Study on Vietnam’s Market,” Nature
Scientific Reports, 2024.
X. Zhang and D. Wu, “Time Series Analysis and Stock
Price Prediction Using Deep Learning,” International
Journal of Financial Studies, vol. 6, no. 2, p. 36, 2018.
J. Patel, S. Shah, P. Thakkar, and K. Kotecha, “Predicting
Stock Market Index Using Fusion of Machine Learning
Techniques,” Expert Systems with Applications, vol. 42,
no. 4, pp. 2162–2172, 2015.
D. S. Kumar, M. V. Subramanyam, and A. P. S. Kumar, “A
hybrid spotted hyena and whale optimization
algorithm-based load-balanced clustering technique in
WSNs,” Proceedings of International Conference on
Recent Trends in Computing: ICRTC 2022, Singapore:
Springer Nature Singapore, 2023.
J. D. S. Kumar, M. V. Subramanyam, and A. P. S. Kumar,
“Hybrid Sand Cat Swarm Optimization Algorithm-
based reliable coverage optimization strategy for
heterogeneous wireless sensor networks,” International
Journal of Information Technology, 2024. Available:
https://doi.org/10.1007/s41870-024-02163-8.
J. D. S. Kumar, M. V. Subramanyam, and A. P. S. Kumar,
“Hybrid Chameleon Search and Remora Optimization
Algorithm‐based Dynamic Heterogeneous load
balancing clustering protocol for extending the lifetime
of wireless sensor networks,” International Journal of
Communication Systems, vol. 36, 2023. DOI:
10.1002/dac.5609.
Stock Market Forecasting with Machine Learning
703
