Analysis of Auditory Attention Based EEG Signals across Time,
Frequency and Time‑Frequency Domains
Vanisha R. and Sushma S. Jagtap
Department of ECE, Rajalakshmi Engineering College, Chennai, Tamil Nadu, India
Keywords: Auditory Attention, Ensemble Classifiers, EEG, PhyAAt, Time‑Frequency Domain.
Abstract: In this digital age auditory attention plays an important role in everything from flying an airplane to learning
in a classroom environment. It is essential to focus on the user's or individual's auditory attention analysis
because attention may differ while communicating with a non-native speaker and, in some cases, native
speakers. Although there are many different types of physiological signals to analyze attention, EEG is the
most widely used because this EEG signal is relatively simple and non-invasive. Among the numerous types
of physiological datasets, the lack of study fails to auditory Attention to natural speech. This was
complemented by the Physiology of Auditory attention to Speech Dataset, it was obtained from 25 healthy
subjects by performing three separate tasks (resting, writing, and listening) at varied noise levels with native
and non-native speakers. This study examines auditory attention in the time, frequency, and time-frequency
domains while considering the all-noise level EEG data from three separate activities while interacting with
native and non-native speakers. For this purpose, we employ a unique data segmentation preprocessing
method that combines all EEG signals with specific window size and machine learning algorithms for task
classification. The results show that the time-frequency domain surpasses the other domains.
1 INTRODUCTION
Auditory attention is a cognitive process that allows
us to focus on certain sounds while ignoring others.
This process can also influence other physiological
responses, including heart rate and sympathetic tone
(Scharf, B 2016). The Electroencephalogram (EEG)
can be used to investigate brain activity, while the
Photoplethysmogram (PPG) and Galvanic Skin
Response (GSR) signals can be used to extract heart
rate and sympathetic response (Val-Calvo, M., et al.,
2020). EEG signals were used in our study to detect
auditory attention because they are non-invasive and
complex signals with numerous applications in
biomedical fields such as sleep and brain-computer
interface. Among the numerous types of
physiological datasets, the absence of study fails to
auditory Pay attention to natural speech.
The Physiology of Auditory Attention
supplemented the Speech Dataset (Bajaj et al., 2020).
The dataset includes three physiological signals
recorded at a sampling rate of 128Hz from 25 healthy
subjects performing three distinct tasks (resting,
writing, and listening) under different noise levels,
with both native and non-native speakers. The EEG
signal is recorded with a 14-channel Emotive Epoc
device. Two signals of Galvanic Skin Response
(GSR) were recorded: instantaneous sample and
moving averaged signal.
A
raw
signal, inter-beat
interval (IBI), and pulse rate were all recorded from
the photoplethysmogram(PPG) sensor (pulse sensor).
All signals were properly labeled. 'AF3', 'F7', 'F3',
'FC5', 'T7', 'P7', 'O1', 'O2', 'P8', 'T8', 'FC6', 'F4', 'F8',
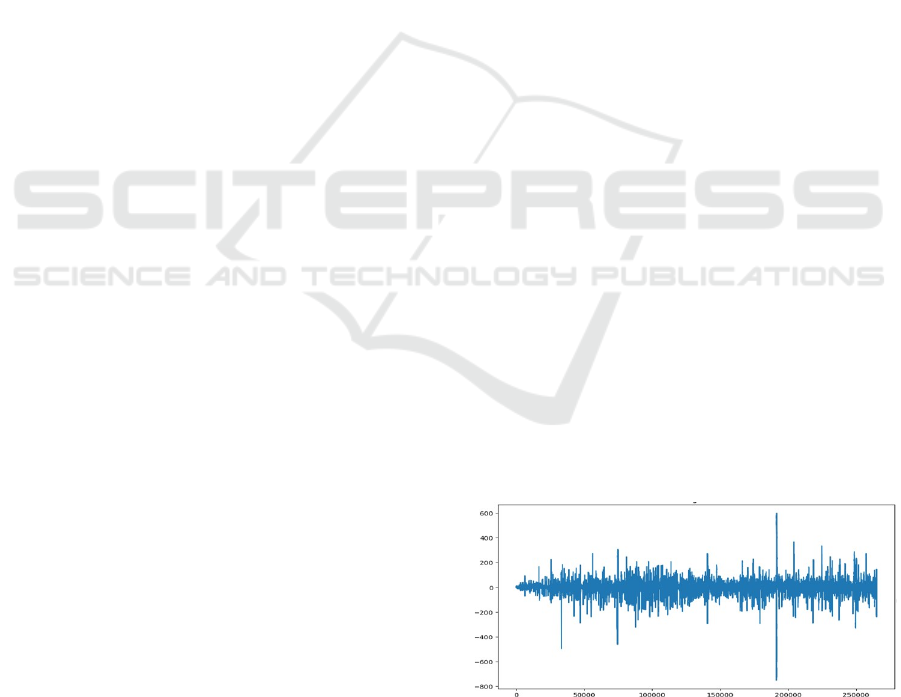
'AF4'. Figure 1 shows the EEG representation of
raw signal.
Figure 1: EEG representation of raw signal.
We used a unique pre-processing method that
segmented the signals, accounting for the varying
signal lengths across the dataset's tasks. This study
606
R., V. and Jagtap, S. S.
Analysis of Auditory Attention Based EEG Signals across Time, Frequency and Time-Frequency Domains.
DOI: 10.5220/0013938700004919
Paper published under CC license (CC BY-NC-ND 4.0)
In Proceedings of the 1st International Conference on Research and Development in Information, Communication, and Computing Technologies (ICRDICCT‘25 2025) - Volume 5, pages
606-616
ISBN: 978-989-758-777-1
Proceedings Copyright © 2026 by SCITEPRESS – Science and Technology Publications, Lda.

examines EEG signals under various noise levels
and semantic conditions, employing time,
frequency, and time-frequency analyses. For this
classification, we used ensemble classifiers such as
AdaBoost (ADA) (Hoseini, S.S 20204). XGBoost
(XGB) (Wang, F., et al., 2022) and Random Forest
(RF) (Edla, D.R., et al., 2018). XGB performs better
than the other two classifiers, particularly in
frequency domain analysis.
2 RELATED WORKS
This section discusses a variety of Auditory attention
detection task-related works. A novel neural-inspired
architecture for EEG-based auditory attention
detection (AAD) beat both linear and CNN models
on the KUL and DTU databases, with average
accuracies of 91.2% and 61.5% within 5-second
windows, respectively. It demonstrated continuous
improvements throughout 1 to 5-second decision
windows while being much more computationally
efficient (less than 1% of SSF-CNN's cost), making
it appropriate for neuro-steered hearing aids.
However, its accuracy lags behind the cutting-edge
SSF-CNN model (Cai, S., et al., 2022) STAnet, a
model for auditory spatial attention detection
(ASAD), uses spatial and temporal EEG data to
achieve excellent accuracy on the KUL and DTU
databases (92.6% and 76.1% within 5-second
windows, respectively). It works well with as few as
16 EEG channels and incorporates spatial-temporal
aspects for greater accuracy. However, it may
encounter overfitting or computational complexity
issues (Su, E., et al., 2022) EEG-Graph Net, an EEG-
graph convolutional network with a neural attention
mechanism, decodes auditory attention by modeling
EEG channels as nodes and their interactions as
edges, so representing the brain's spatial patterns as a
graph. It obtained outstanding 1-second window
accuracies of 96.1% and 78.7% on the KUL and
DTU databases, respectively (Cai, S., T. Schultz, and
H. Li 2023). A neuronal attention mechanism has
been proposed to dynamically assign weights to EEG
sub-bands and channels, collecting discriminative
representations for auditory attention detection
(AAD). When combined with an AAD system, it
achieved 1-second and 2- second average accuracies
of 79.3% and 82.96% on the KUL and DTU
databases, respectively. While effective, its precision
falls short of previous works (Cai, S., et al., 2021). A
unique Auditory Attention Decoding (AAD)
mechanism was presented, which combines CNN and
ConvLSTM to extract spectro-spatial-temporal
information from 3D descriptors using
topographical activity maps of multi-frequency
bands. Experiments on KUL, DTU, and PKU
databases with 0.1s, 1s, 2s, and 5s decision windows
outperformed SSF-CNN and cutting-edge models.
Even without auditory stimuli, the model improved
AAD accuracy, with different trends observed across
databases and decision windows. Multi-band
frequency analysis and ConvLSTM-based temporal
analysis made major contributions to the accuracy
gains (Jiang et al., 2022).
As previously stated, the majority of prior
classification work has used the KUL and DTU
datasets;
however, no
work
has
used
the
PhyAAt dataset for this form of categorization.
Nonetheless, some research has focused on attention
score (Bajaj et al., 2022) detection tasks on the
PhyAAt dataset, as described below. Study (Ahuja,
C. and D. Setia 2022) enhances selective auditory
attention research by combining 14-channel EEG
data from the PhyAAt dataset with speech-to-text
annotations. Using EEGNet and traditional machine
learning, it reduced test MAE from 29.65 to 22.47
for a single individual, resulting in an overall
MAE of 31.47. Incorporating speech-to-text data
improves attention monitoring, but the model is
prone to overfitting and lacks evaluation at various
noise and semantic levels. Study (Kim, D.-Y., et al
2022) used Multivariate Multiscale Entropy
(MMSE) to examine entropy variations in EEG data
in relation to auditory input and attention levels. The
MMSE, a measure of information in random signals,
demonstrated that entropy rises during sentence
practice, non-semantic sentence presentation, and
when noise is combined with input sentences. These
findings present a quantitative technique to assessing
cognitive models. However, the emphasis on specific
conditions (rehearsal, non-semantic words, noise)
limits its applicability to other situations, and
depending entirely on MMSE and entropy-based
analysis may neglect other relevant EEG signal
variables.
3 PROPOSED METHODOLOGY
To evaluate and detect task classification in the
PhyAAt dataset, we used a variety of domain
analyses along with ensemble classifier's. Our
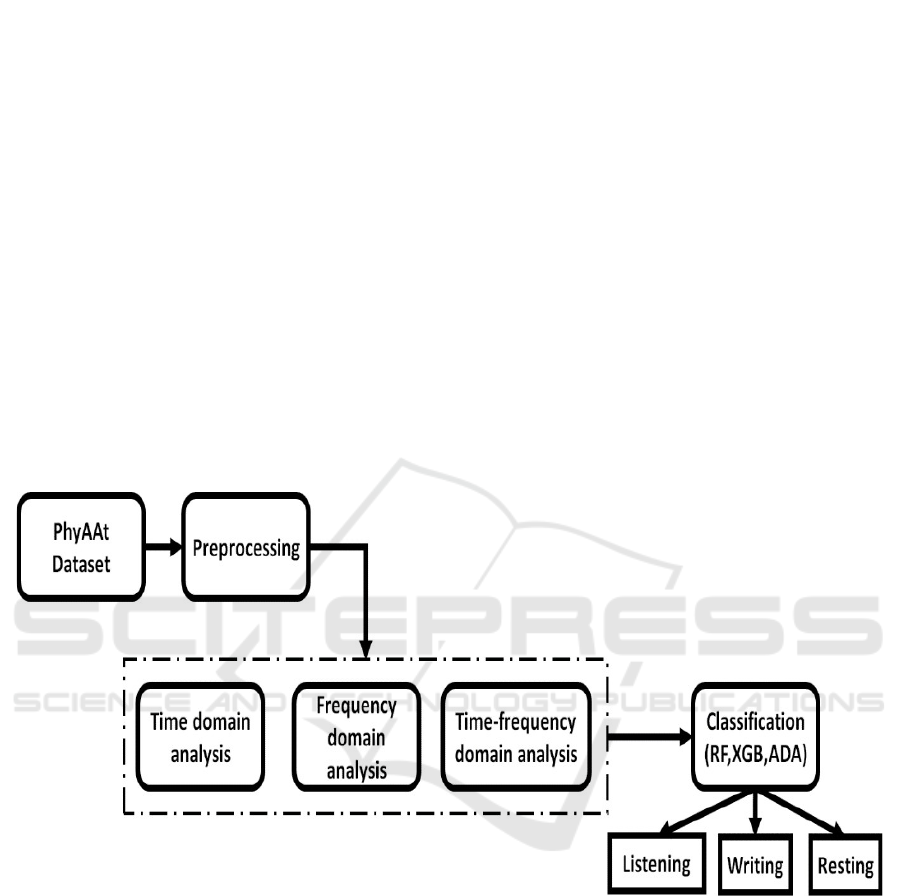
proposed mechanism involves three stages of work:
preprocessing, feature extraction, and classification.
Figure 2. represent the general block diagram of
proposed work.
Analysis of Auditory Attention Based EEG Signals across Time, Frequency and Time-Frequency Domains
607
3.1 Unique Data segmentation
Preprocessing
In this study, we used EEG signals from 25 different
subjects to evaluate performance on a per-subject
basis. The pre-processing, feature extraction, and
classification steps were carried out consistently
across all subjects. At this point, we combined
signals from different noise and semantic levels for
classification. Each subject's dataset includes signals
from three stages: writing, listening, and resting.
These signals vary in length and order, making it
difficult to use traditional label-based task separation
methods. This problem is further complicated by
the fact that each subject's dataset contains 300,000
records, necessitating a more specialized approach to
effectively handle task-wise signal separation. To
minimize the complexity, we used a unique data
segmentation mechanism for signal separation. This
method was created specifically to handle the
varying lengths and orders of EEG signals from each
task (writing, listening, and resting). The analysis
process includes several key steps:
1.
Initial Preprocessing: We begin by carrying out
fundamental data cleaning, which includes
eliminating duplicates and handling missing values.
2.
Label Segmentation: Unique labels are
identified, and a mask is created to detect invalid
entries (e.g., label: -1 = unwanted data, 0 = listening,
1 = writing, 2
= resting), which are then filtered for further
analysis. Label -1 was removed, and the remaining
labels (0, 1, and 2) were considered for the next
process.
3.
Task Segmentation: Each record is assigned a
serial number, which helps in accurate separation by
distinguishing various activities (writing, listening,
and resting) and determining discontinuities.
Figure 2: General block diagram of different domain auditory attention analysis.
It begins with doing the standard Exploratory
Data Analysis (EDA) procedure, that involved tasks
like null value detection and duplicate removal.
Next, we find every unique label in the dataset. To
find the entries where the label equals (-1 =
unwanted data, 0 = listening, 1 = writing, and 2 =
resting), which usua ly denotes invalid or noisy data,
we next build a mask. Lastly, we use this mask to
filter the dataset and extract the rows that have the
labels (-1, 0, 1, and 2), storing them in a different
variable for handling the data with the labels (0, 1,
and 2) and eliminating the data with the label (-1).
Before separating the task records, we added a serial
number to the data in order to identify the
discontinuities for each label. This serial number is
used to track the continuity of the records and
identify where task changes occur. By giving each
record a unique identity, we may more reliably
differentiate the signals associated with different
jobs (writing, listening, and resting) based on the
discovered discontinuities. This stage guarantees that
the signals are properly segregated and isolates each
task for further analysis. Once all the discontinuities
are identified and the tasks are segmented, each
segment undergoes feature extraction in different
domains. Specifically, we extract features from the
ICRDICCT‘25 2025 - INTERNATIONAL CONFERENCE ON RESEARCH AND DEVELOPMENT IN INFORMATION,
COMMUNICATION, AND COMPUTING TECHNOLOGIES
608
time domain, frequency domain, and time- frequency
domain.
3.2 Feature Extraction
1.
Time Domain feature extraction:
In the time-domain feature extraction technique, we
used raw EEG signals as input and extracted
multiple statistical features such as mean, variance,
standard deviation, root mean
square (RMS),
skewness, and kurtosis (Alazzawı, A., et al., 2024)
Table 1 represents the details of statical features
extraction.
Table 1: Statistical Feature Extraction.
Statistical features Formula
Mean
𝑁
1
𝑀𝑒𝑎𝑛
=
∑
𝑆
𝑛
𝑁
𝑛
=1
Variance
𝑁
1
𝑉𝑎𝑟𝑖𝑎𝑛𝑐𝑒
=
∑
(
𝑆
𝑛
−
𝑀𝑒𝑎𝑛
)
2
𝑁
𝑛
=1
Standard deviation
𝑁
1
𝑠𝑡𝑑
=
√ ∑
(
𝑆
𝑛
−
𝑀𝑒𝑎𝑛
)
2
𝑁
𝑛
=1
Root mean Square
𝑁
1
2
𝑟𝑚𝑠
=
√
𝑁
∑
𝑆
𝑛
𝑛
=1
Skewness
𝑆𝑘𝑒𝑤𝑛𝑒𝑠𝑠
1
∑
𝑁
(
𝑆
−
𝑀𝑒𝑎𝑛
)
4
=
𝑁
𝑛
=1
𝑛
2
(√
1
∑
𝑁
(
𝑆
−
𝑀𝑒𝑎𝑛
)
2
)
𝑁
𝑛
=1
𝑛
Kurtosis
𝐾𝑢𝑟𝑡𝑜𝑠𝑖𝑠
1
∑
𝑁
(
𝑆
−
𝑀𝑒𝑎𝑛
)
3
=
𝑁
𝑛
=1
𝑛
3
(√
1
∑
𝑁
(
𝑆
−
𝑀𝑒𝑎𝑛
)
2
)
𝑁
𝑛
=1
𝑛
Where 𝑆
𝑛
represents each data point, and N is
the total number of samples.
2.
Frequency Domain feature extraction:
Frequency-domain evaluation involves
converting time-domain EEG signals to the
frequency domain via Power Spectral Density (PSD)
estimation. The PSD assists identify the distribution
of signal power among different frequency
components. After obtaining the PSD, we extract
statistical features including mean, variance,
standard deviation, RMS, skewness, and kurtosis,
which were used in the time-domain analysis.
Integrating alpha, beta, and gamma band power
analysis with these statistical features gives us a
deeper comprehension of the EEG signal. The
Analysis of Auditory Attention Based EEG Signals across Time, Frequency and Time-Frequency Domains
609

combined method gathers both statistical
3.
Time-Frequency domain feature extraction:
Discrete Wavelet Transform (DWT): We apply the
Discrete Wavelet Transform (DWT) with 'db2'
(Daubechies wavelet with 2 vanishing moments)
as the selected wavelet in order to analyze the EEG
signals in the time-frequency domain. A
mathematical method called the Discrete Wavelet
Transform (DWT) is used to convert a signal into a
wavelet-based representation. It is especially helpful
for analyzing non-stationary signals like EEG,
where both frequency content and time localization
are crucial, because it offers both time and frequency
information (Pattnaik et al., 2016).
4 RESULTS AND DISCUSSION
In this section, we perform the experiments ten
times in order to increase the robustness and
reliability of the classifier. The three ensemble
classifiers performance (Ada, XGB, and RF) was
examine d using the mean accuracy and standard
deviation. Table 2 shows the performance of the
classifiers on time, frequency, and time-frequency
domain evaluation for all 25 subjects.
4.1 Time Domain
The time domain evaluation showed that the XGB
and RF performed better than the ADA boost
classifier. For subjects 2, 6, 7, 9, 10, 11, 12, 15, 16,
17, 18, and 25, RF outperformed XGB and ADA
boost classifiers. However, XGB only provided
approximate RF performance for those subjects. On
the other hand, subjects 1,3,4,5,8,13,14,19,20,21,22,
23, and 24 XGB outperformed RF and ADA boost
classifiers. The accuracy of XGB beat RF and ADA,
indicating that the model is better at recognizing
EEG signals. Subject 5 obtained the highest accuracy
of 89.77%, while subject 10 had a minimum
accuracy of 64.34%.
Table 2: Performance analysis of the classifiers on time, frequency and time- frequency domain analysis for all 25 subjects.
Sub /Metrics Time domain Frequency domain Time-frequency domain
RF XGB ADA RF XGB ADA RF XGB ADA
S1
Mean
Accurac
y
82.97 83.75 75 84.22 85.55 81.48 79.92 76.88 70.08
Std
deviation
0.025 0.028 0.036 0.031 0.031 0.031 0.024 0.035 0.038
S2
Mean
Accurac
y
81.48 81.48 73.05 84.22 85.55 81.48 79.14 78.44 66.64
Std
deviation
0.017 0.027 0.041 0.031 0.031 0.031 0.027 0.047 0.026
S3
Mean
Accurac
y
75.58 76.43 68.7 80.16 81.01 73.18 76.82 74.26 66.36
Std
deviation
0.034 0.035 0.053 0.023 0.024 0.033 0.025 0.031 0.032
S4
Mean
Accurac
y
65.43 66.59 61.78 62.17 59.61 57.05 62.79 62.4 61.01
Std
deviation
0.031 0.035 0.02 0.033 0.037 0.025 0.047 0.029 0.042
S5
Mean
Accurac
y
86.56 89.77 86.95 84.3 87.27 75.7 86.88 89.06 85.39
ICRDICCT‘25 2025 - INTERNATIONAL CONFERENCE ON RESEARCH AND DEVELOPMENT IN INFORMATION,
COMMUNICATION, AND COMPUTING TECHNOLOGIES
610

Std
deviation
0.024 0.028 0.026 0.028 0.026 0.06 0.029 0.025 0.051
S6
Mean
Accurac
y
88.14 87.75 83.72 91.94 90.39 83.57 86.9 88.53 84.88
Std
deviation
0.018 0.014 0.043 0.015 0.023 0.04 0.019 0.02 0.02
S7
Mean
Accurac
y
72.79 71.63 63.88 76.59 78.22 71.01 76.9 75.81 69.3
Std
deviation
0.37 0.032 0.035 0.03 0.03 0.03 0.033 0.035 0.048
S8 Mean
Accurac
y
71.16 71.55 63.95 80.23 78.6 71.55 73.64 71.86 62.02
Std deviation 0.031 0.032 0.337 0.023 0.309 0.041 0.04 0.033 0.041
S9
Mean
Accurac
y
80.08 79.22 72.25 86.2 85.43 83.72 81.4 80.39 75.89
Std deviation 0.034 0.033 0.035 0.024 0.027 0.042 0.033 0.023 0.035
S10
Mean
Accurac
y
64.34 62.48 61.55 71.55 72.33 62.56 68.14 67.6 57.91
Std deviation 0.032 0.032 0.035 0.033 0.031 0.051 0.028 0.03 0.041
S11
Mean
Accurac
y
82.95 81.4 77.21 79.53 80.00 72.64 72.71 70.54 65.27
Std
deviation
0.024 0.028 0.036 0.019 0.031 0.039 0.047 0.031 0.024
S12
Mean
Accurac
y
65.81 64.11 57.67 74.16 72.25 67.67 71.16 65.97 62.25
Std deviation 0.034 0.04 0.053 0.013 0.027 0.038 0.025 0.042 0.042
S13
Mean
Accurac
y
73.49 74.37 69.15 79.69 78.29 70.54 77.29 75.89 73.8
Std deviation 0.029 0.031 0.035 0.028 0.035 0.037 0.023 0.013 0.052
S14
Mean
Accurac
y
81.71 84.34 74.73 82.33 80.08 73.18 78.14 78.45 73.57
Std
deviation
0.03 0.025 0.07 0.033 0.032 0.063 0.031 0.032 0.027
S15
Mean
Accurac
y
69.69 69.15 64.73 85.53 84.65 79.3 67.75 64.57 58.37
Std deviation 0.02 0.049 0.071 0.033 0.021 0.025 0.036 0.045 0.034
Analysis of Auditory Attention Based EEG Signals across Time, Frequency and Time-Frequency Domains
611
S16
Mean
Accurac
y
65.89 64.11 61.94 64.19 65.5 59.84 69.22 67.29 62.48
Std deviation 0.029 0.029 0.048 0.027 0.013 0.039 0.024 0.024 0.031
S17
Mean
Accurac
y
74.73 74.19 70.47 79.61 78.84 74.96 73.72 69.92 65.81
Std deviation 0.031 0.032 0.043 0.023 0.027 0.023 0.023 0.027 0.028
S18
Mean
Accurac
y
88.53 87.75 78.14 85.35 84.34 76.51 84.57 82.56 73.88
Std deviation 0.007 0.027 0.034 0.016 0.023 0.031 0.024 0.024 0.065
S19
Mean
Accurac
y
71.01 73.1 69.3 72.79 70.00 65.89 70.78 69.84 67.98
Std deviation 0.038 0.024 0.035 0.037 0.025 0.046 0.031 0.044 0.042
S20
Mean
Accurac
y
87.05 87.67 77.44 88.37 86.43 84.11 83.64 81.71 73.18
Std
deviation
0.025 0.022 0.072 0.027 0.032 0.041 0.024 0.029 0.045
S21
Mean
Accurac
y
74.5 77.98 64.34 79.84 81.63 73.57 74.73 73.02 64.26
Std deviation 0.029 0.034 0.031 0.029 0.038 0.044 0.021 0.039 0.031
S22
Mean
Accurac
y
68.14 68.91 61.24 78.37 79.22 73.26 72.02 68.06 65.12
Std deviation 0.034 0.028 0.05 0.019 0.04 0.032 0.016 0.051 0.035
S23
Mean
Accurac
y
67.75 67.91 57.6 75.5 75.04 69.15 68.06 64.73 60.08
Std
deviation
0.027 0.09 0.027 0.036 0.035 0.057 0.045 0.023 0.031
S24
Mean
Accurac
y
56.12 58.29 52.4 60.78 57.75 54.88 61.24 57.8 51.4
Std deviation 0.042 0.034 0.041 0.045 0.025 0.03 0.043 0.026 0.033
S25
Mean
Accurac
y
83.64 82.33 77.36 84.88 85.19 81.09 79.69 78.76 74.81
Std deviation 0.025 0.028 0.041 0.029 0.012 0.031 0.034 0.027 0.032
Average
Accurac
y
75.1816 75.4504 68.982 78.9 78.5268 72.7156 75.09 73.3736 67.6696
ICRDICCT‘25 2025 - INTERNATIONAL CONFERENCE ON RESEARCH AND DEVELOPMENT IN INFORMATION,
COMMUNICATION, AND COMPUTING TECHNOLOGIES
612
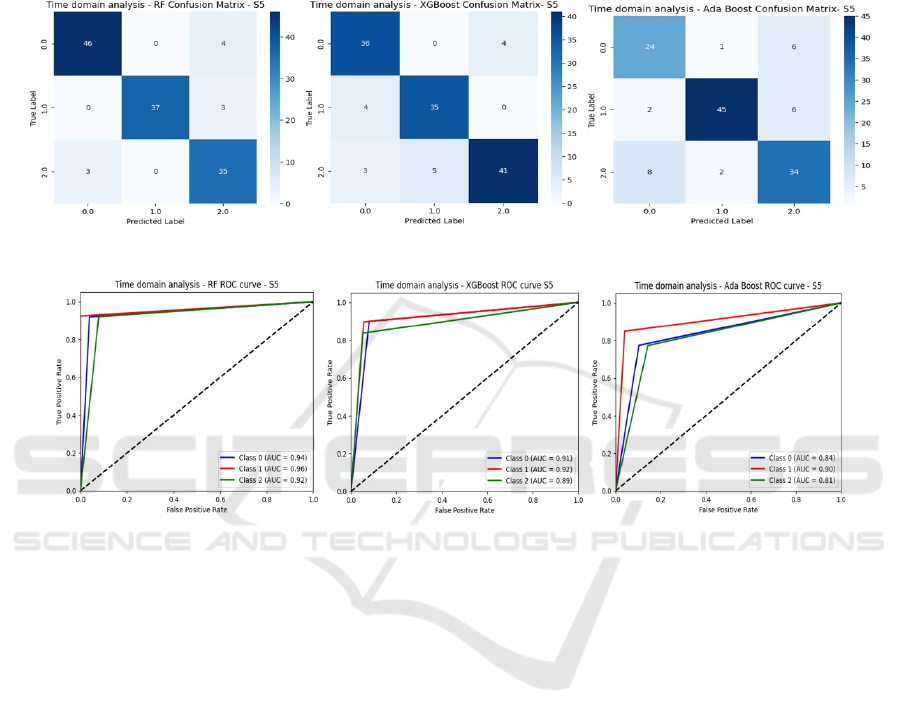
Figure 3 and 4 represent the confusion matrices
and ROC curves for RF, XGB, and Ada classifiers,
respectively. From these confusion matrix results, it
is evident that RF effectively classifies the listening
task, XGB shows superior performance in
classifying the resting task, and AdaBoost excels in
classifying the writing task compared to the other
two tasks. Among the three tasks, the ROC curves
indicate that the writing task consistently shows
superior performance across all classifiers when
compared to resting and listening task.
Figure 3: Confusion matrix for RF, XGB and ADA. (Time domain).
Figure 4: ROC curve for RF, XGB and ADA. (Time domain).
4.2 Frequency Domain
In the time domain evaluation XGB and RF
performed better than the ADA boost classifier. In
subjects 4, 6, 8, 9, 12, 13, 14, 15, 17, 18, 19, 20,
23, 24, and 25, RF outperformed XGB and ADA
boost classifiers. However, in subjects 1, 2, 3, 5,
7, 10, 11, 16, 21, and 22, XGB outperformed RF and
ADA boost classifiers. RF beat both XGB and ADA
suggesting that the model is more efficient at
recognizing EEG signals in the frequency domain.
Subject 6 achieved the highest accuracy in frequency
domain analysis (91.99%), while subject 24 had the
lowest accuracy (60.78%). Figure 5 and 6 present the
confusion matrices and ROC curves for RF, XGB,
and Ada classifiers, respectively on frequency
domain. From the confusion matrix results, it is
evident that all classifiers perform equally well in
classifying the listening, writing, and resting tasks in
the frequency domain analysis. Among the three
tasks, the ROC curves indicate that the listening task
consistently shows superior performance across all
classifiers when compared to resting and wring task
in frequency domain analysis.
Analysis of Auditory Attention Based EEG Signals across Time, Frequency and Time-Frequency Domains
613
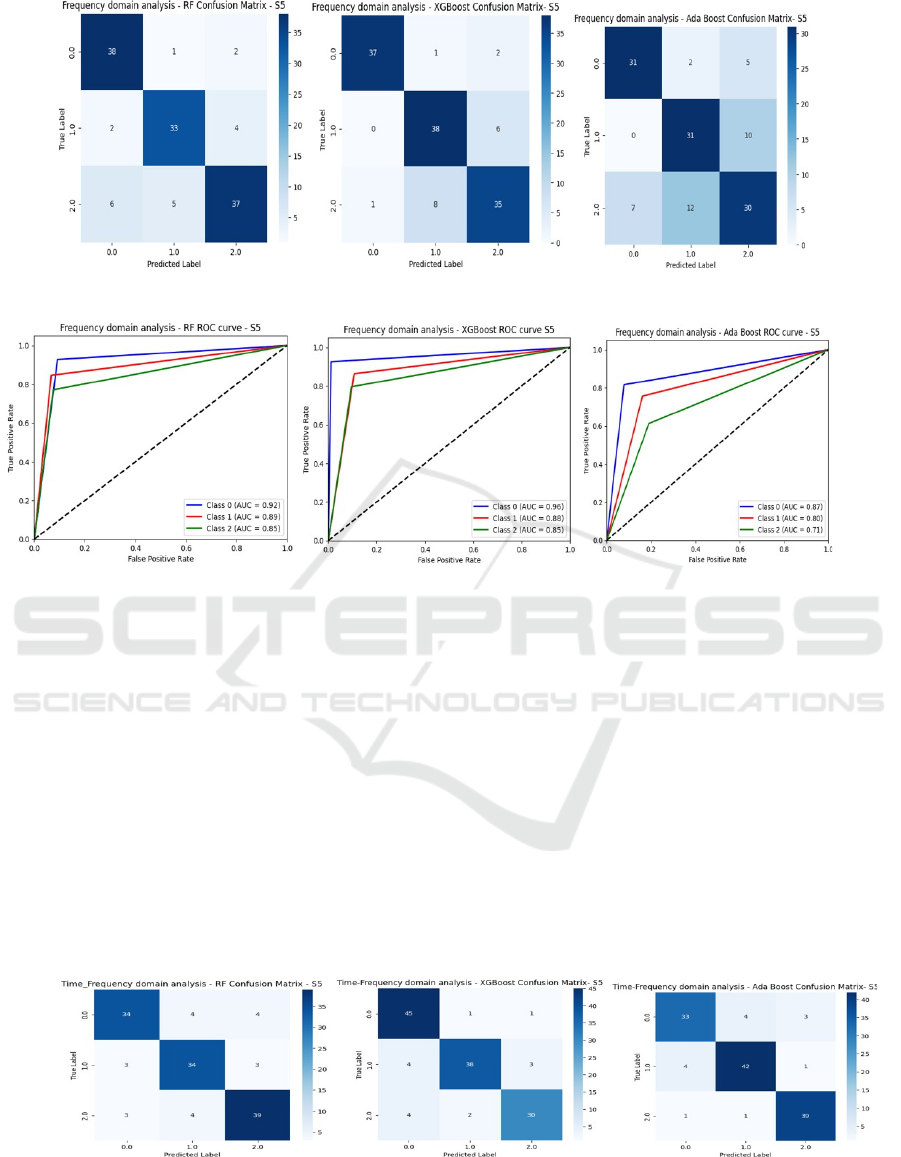
Figure 5: Confusion matrix for RF, XGB and ADA. (Frequency domain).
Figure 6: ROC curve for RF, XGB and ADA. (Frequency domain).
4.3 Time-Frequency Domain
In the time-frequency domain, the RF and XGB
performed better than the ADA boost classifier. In
subjects 1, 2, 3, 4, 7, 8, 9, 10, 11, 12, 13, 15, 16,
17, 18, 19, 20, 21, 22, 23, 24, and 25, RF
outperformed XGB and ADA boost classifiers. For
those subjects, XGB only produced an approximate
RF performance. However, XGB outperformed RF
and ADA boost classifiers in subjects 5, 6, and 14.
Both XGB and AdaBoost were surpassed in accuracy
by RF, indicating that the model is more successful
in accurately classifying the EEG signals in the time
- frequency domain. Subject 5 achieved the highest
accuracy of 89.05% in frequency domain analysis,
while subject 24 had the lowest accuracy of 61.24%.
Figure 7 and 8 present the confusion matrices and
ROC curves for RF, XGB, and Ada classifiers,
respectively on time-frequency domain. From these
confusion matrix results, it is evident that RF
effectively classifies the resting task, XGB shows
superior performance in classifying the listening task,
and AdaBoost excels in classifying the writing task
compared to the other two tasks. Among the three
tasks, the ROC curves indicate that performed
equally well in classifying the listening, writing, and
resting tasks in the time-frequency domain analysis.
Figure 7: Confusion matrix for RF, XGB and ADA (Time-Frequency domain).
ICRDICCT‘25 2025 - INTERNATIONAL CONFERENCE ON RESEARCH AND DEVELOPMENT IN INFORMATION,
COMMUNICATION, AND COMPUTING TECHNOLOGIES
614

Figure 8: ROC curve for RF, XGB and ADA. (Time-Frequency domain).
In the time, frequency, and time-frequency
domains, XGB and RF performed better than
AdaBoost on average, according to the three
classifiers' analysis. However, XGB performed
better in terms of false positives and false negatives.
Our analysis showed that Subject 5 outperformed the
other subjects. This superior performance was
maintained in all three domains. Subject 24 had the
lowest classification performance among all the
subjects. For this subject, the time-frequency domain
was the only analysis method that showed a
significant improvement in performance. Unlike the
time and frequency domains, which struggled to
distinguish between tasks, the time-frequency
domain was able to capture key signal
characteristics, resulting in improved classification
accuracy. This indicates that for subjects with lower
performance in time and frequency evaluations, the
time-frequency analysis offers a more robust
technique for gathering and identifying EEG signal
patterns.
5 CONCLUSIONS
The research found that using time, frequency, and
time-frequency domain evaluations on EEG data
showed major variations in effectiveness of task
classification (listening, writing, and resting) across
all subjects. According to the results, subject 5
achieved the highest scores of 89.77%, 87.27%, and
89.06%, on time, frequency and time-frequency
domains respectively. Reliable task classification
required only features taken from the frequency and
time domains. Alternatively, Subject 24 carried out
lowest performance, with significant gains mostly in
the time-frequency domain. This finding highlights
the importance of time-frequency analysis in
detecting complex signal features,
particularly when time or frequency
domain feature
s are insufficient. In summary, incorporating time-
frequency domain analysis demonstrated to be a
powerful approach for improving classification
accuracy across diverse subjects by tackling the
variability in individual EEG signal patterns. Future
research will focus on classifying tasks based on
different noise and semantic levels to better
understand the ways they affect EEG signal patterns.
Additionally, by finding and employing the most
relevant EEG channels, we seek to use channel
selection strategies to improve classification
performance.
REFERENCES
A. Alazzawi et al., “Schizophrenia diagnosis based on
diverse epoch size resting-state EEG using machine
learning,” PeerJ Comput. Sci., vol. 10, p. e2170, 2024.
B. Scharf, Auditory Attention: The Psychoacoustical
Approach, in Attention, Psychology Press, 2016, pp.
75–117.
C. Ahuja and D. Setia, “Measuring human auditory
attention with EEG,” in Proc. 14th Int. Conf. on
Communication Systems & Networks (COMSNETS),
IEEE, 2022. DOI: 10.1109/COMSNETS53615.2022.
9668363.
D. R. Edla et al., “Classification of EEG data for human
mental state analysis using Random Forest classifier,”
Procedia Comput. Sci., vol. 132, pp. 1523–1532, 2018.
DOI: 10.1016/j.procs.2018.05.116.
D.-Y. Kim et al., “Cognitive modeling using multivariate
multiscale entropy analysis of EEG: Entropy changes
according to auditory inputs and the level of attention,”
in Proc. IEEE Int. Conf. on Consumer Electronics-Asia
(ICCE-Asia), IEEE, 2022. DOI: 10.1109/ICCE-
Asia57006.2022.9954710.
Analysis of Auditory Attention Based EEG Signals across Time, Frequency and Time-Frequency Domains
615

E. Su et al., “STAnet: A spatiotemporal attention network
for decoding auditory spatial attention from EEG,”
IEEE Trans. Biomed. Eng., vol. 69, no. 7, pp. 2233–
2242, 2022. DOI: 10.1109/TBME.2022.3140246.
F. Wang et al., “An ensemble of XGBoost models for
detecting disorders of consciousness in brain injuries
through EEG connectivity,” Expert Syst. Appl., vol.
198, p. 116778, 2022. DOI: 10.1016/j.eswa.2022.1167
78.
M. Val-Calvo et al., “Real-time multi-modal estimation of
dynamically evoked emotions using EEG, heart rate
and galvanic skin response,” Int. J. Neural Syst., vol.
30, no. 4, p. 2050013, 2020. DOI:
10.1142/S0129065720500136.
N. Bajaj, J. R. Carrión, and F. Bellotti, “Phyaat: Physiology
of auditory attention to speech dataset,” arXiv preprint
arXiv:2005.11577, 2020.
N. Bajaj, J. R. Carrión, and F. Bellotti, “Deep representation
of EEG data from spatio-spectral feature images,”
arXiv preprint arXiv:2206.09807, 2022.
S. Pattnaik, M. Dash, and S. Sabut, “DWT-based feature
extraction and classification for motor imaginary EEG
signals,” in Proc. Int. Conf. on Systems in Medicine and
Biology (ICSMB), IEEE, 2016.
S. Cai et al., “EEG-based auditory attention detection via
frequency and channel neural attention,” IEEE Trans.
Hum.-Mach. Syst., vol. 52, no. 2, pp. 256–266, 2021.
DOI: 10.1109/THMS.2021.3125283.
S. Cai et al., “A neural-inspired architecture for EEG-based
auditory attention detection,” IEEE Trans. Hum.-Mach.
Syst., vol. 52, no. 4, pp. 668–676, 2022. DOI:
10.1109/THMS.2022.3176212.
S. Cai, T. Schultz, and H. Li, “Brain topology modeling
with EEG-graphs for auditory spatial attention
detection,” IEEE Trans. Biomed. Eng., 2023. DOI:
10.1109/TBME.2023.3294242.
S. S. Hoseini, “Enhancing anxiety diagnosis through ADA
BOOST-assisted decision-level fusion,” J. Curr. Trends
Comput. Sci. Res., vol. 3, no. 3, pp. 1–10, 2024.
W. B. Ng et al., “PSD-based features extraction for EEG
signal during typing task,” IOP Conf. Ser.: Mater. Sci.
Eng., vol. 557, no. 1, p. 012032, 2019. DOI:
10.1088/1757-899X/557/1/012032.
Y. Jiang, N. Chen, and J. Jin, “Detecting the locus of
auditory attention based on the spectro-spatial-temporal
analysis of EEG,” J. Neural Eng., vol. 19, no. 5, p.
056035, 2022. DOI: 10.1088/1741-2552/ac975c.
ICRDICCT‘25 2025 - INTERNATIONAL CONFERENCE ON RESEARCH AND DEVELOPMENT IN INFORMATION,
COMMUNICATION, AND COMPUTING TECHNOLOGIES
616
