
Temporal Analysis of Land Cover Dynamics in Chhatrapati
Sambhaji Nagar Using Sentinel‑2 Imagery and Random Forest
Classification
Yogesh R. Tayade
1
and Vijaya B. Musande
2
1
Department of Artificial Intelligence and Data Science, CSMSS CSCOE, Chhatrapati Sambhajinagar 431 002,
Maharashtra, India
2
Department of Computer Science and Engineering, Jawaharlal Nehru Engineering College, Chhatrapati Sambhajinagar
431003, Maharashtra, India
Keywords: RM - RandomForest, LULC - Landuse Landcover, GEE - Google Earth Engine.
Abstract: Urbanization presents a significant challenge for sustainable development, demanding a clear understanding
of land-use and land-cover (LULC) changes. This study addresses this need by employing the Random Forest
algorithm, a powerful tool for handling complex spatial and temporal data. We focus on Chhatrapati
Sambhajinagar, a rapidly urbanizing city in India. A decade-long time series of Sentinel-2 satellite imagery
(2014-2024) is utilized to overcome limitations in spatial resolution, spectral variability, and temporal
dynamics, which often hinder accurate LULC classification. Through rigorous application of the Random
Forest algorithm, the study meticulously identifies and analyzes LULC changes across the ten-year period.
The key findings highlight a concerning trend: a decrease in vital land cover types, including water bodies
and vegetation. Conversely, the study reveals a substantial increase in built-up areas and bare land, a clear
indicator of urbanization's impact on Chhatrapati Sambhajinagar's landscape.
1 INTRODUCTION
Land Use and Land Cover (LULC) classification
involves categorizing and mapping different land use
and cover types using remote sensing data, but it
encounters challenges such as spatial and temporal
resolution limitations, mixed pixels, spectral
variability, scale discrepancies, algorithm selection
dilemmas, training data scarcity, and
cloud/atmospheric interference. These obstacles
demand a combination of advanced techniques,
including machine learning algorithms, field
validation, and expert knowledge, to accurately
classify land cover types and understand their
dynamics in a given area.
Considering the challenges, it's crucial to
emphasize the scientific rigor and relevance of the
Random Forest algorithm for Land Use and Land
Cover (LULC) classification. Random Forest stands
out as a robust and effective choice for this task due
to its ensemble nature, which mitigates overfitting
concerns often encountered in complex datasets like
remote sensing imagery. Its capacity to handle high-
dimensional data makes it particularly suitable for
leveraging multispectral information inherent in
remote sensing datasets for accurate classification of
diverse land cover types. Furthermore, Random
Forest's ability to accommodate both categorical
and continuous variables facilitates the integration of
various spectral, spatial, and ancillary data layers,
enhancing classification performance. Notably, its
provision of variable importance measures aids in the
interpretation of results, contributing to the scientific
understanding of land cover dynamics. Thus, within
the realm of scientific inquiry and analysis, Random
Forest emerges as a compelling algorithmic choice
for LULC classification tasks, underpinned by its
robustness, versatility, and capacity for extracting
meaningful insights from complex spatial datasets.
In this study, we employed spatiotemporal
analysis using the Random Forest algorithm to
analyze a decade-long time series of Sentinel-2
satellite imagery spanning from 2014 to 2024 over
Chhatrapati Sambhaji Nagar. The selected Sentinel-2
bands utilized for this investigation include the visible
and near-infrared bands: B2 (Blue), B3 (Green), B4
Tayade, Y. R. and Musande, V. B.
Temporal Analysis of Land Cover Dynamics in Chhatrapati Sambhaji Nagar Using Sentinel-2 Imagery and Random Forest Classification.
DOI: 10.5220/0013930900004919
Paper published under CC license (CC BY-NC-ND 4.0)
In Proceedings of the 1st International Conference on Research and Development in Information, Communication, and Computing Technologies (ICRDICCT‘25 2025) - Volume 5, pages
427-434
ISBN: 978-989-758-777-1
Proceedings Copyright © 2026 by SCITEPRESS – Science and Technology Publications, Lda.
427

(Red), B8 (Near-Infrared), along with additional
spectral indices such as NDVI (Normalized
Difference Vegetation Index) and NDWI
(Normalized Difference Water Index). These bands
and indices are particularly suitable for capturing
temporal changes in land cover dynamics. Through
rigorous classification, we categorized the temporal
changes into four distinct classes: bare land,
vegetation, built-up areas, and water bodies, enabling
a comprehensive analysis of the spatiotemporal
trends and dynamics in land cover within the study
area over the specified timeframe.
2 RELATED WORKS
Land Use and Water Quality: Hua (2017) investigated
the relationship between LULC changes and water
quality, employing remote sensing and multivariate
statistical techniques. The study highlighted that
agricultural and urban expansion deteriorates water
quality by increasing pollutant loads. Deforestation,
industrial effluents, and excessive use of fertilizers
contribute to the contamination of water bodies,
affecting aquatic ecosystems and human health.
Strategies such as buffer zones, sustainable
agriculture, and improved wastewater treatment can
help mitigate these negative impacts.
Spatio-Temporal Analysis of LULC Changes:
Chamling and Bera (2020) examined the Bhutan-
Bengal foothill region's LULC changes from 1987 to
2019, emphasizing the role of geospatial tools in
policy-making. Their study showed how land
transformation influenced ecological balance and
socio-economic conditions. Similarly, Yesuph and
Dagnew (2019) assessed LULC changes in Ethiopia’s
Beshillo Catchment, identifying deforestation and
agricultural expansion as major driving forces. They
highlighted the importance of integrating geospatial
analysis with local governance to ensure sustainable
land management.
Climate and Hydrological Impacts: Watson et al.
(2000) and Romanowicz (2017) explored the links
between LULC changes and climate, particularly the
effects on hydrological cycles. They emphasized
deforestation's role in altering precipitation and
temperature patterns, leading to increased drought
risks and reduced groundwater recharge. Changes in
land cover also affect evapotranspiration and runoff,
influencing flood and erosion patterns. These studies
underline the need for adaptive water management
strategies to counteract climate-induced hydrological
disruptions.
LULC Change Models:Agarwal et al. (2002)
provided a comprehensive review of LULC change
models, highlighting spatial, temporal, and human
decision-making factors. These models integrate
socioeconomic variables, remote sensing data, and
predictive analytics to simulate future land-use
patterns. Similarly, Li et al. (2012) discussed urban
sustainability and LULC in East Asia, linking land
changes to public health outcomes. Their research
indicated that unplanned urban expansion leads to
increased pollution and habitat loss, necessitating the
adoption of sustainable land-use policies.
Ecosystem Services and Land Use: Chen et al.
(2014) analyzed LULC changes in China's Small
Sanjiang Plain and their effects on ecosystem
services. They found that agricultural expansion and
urbanization reduced natural vegetation, leading to a
decline in carbon sequestration and soil fertility.
Pande et al. (2021) estimated crop and forest biomass
using satellite data, contributing to resource
management strategies. Their findings emphasize the
importance of balancing economic growth with
environmental conservation to maintain ecosystem
integrity.
Urbanization and Microclimate Changes: Swain
et al. (2016) and Chadchan & Shankar (2012)
investigated the impact of rapid urbanization on urban
microclimates, focusing on Indian cities. Their
studies highlighted rising land surface temperatures
due to urban expansion, causing heat stress and
altering local weather patterns. The replacement of
vegetated areas with impervious surfaces exacerbates
the urban heat island effect, necessitating the
integration of green infrastructure in urban planning.
Urbanization and Environmental Interactions: Bai
et al. (2017) proposed a framework linking
urbanization with environmental changes. Their
study demonstrated how land-use changes affect air
quality, biodiversity, and natural resource
availability. Patra et al. (2018) emphasized
groundwater depletion as a consequence of urban
sprawl. They suggested that integrating groundwater
recharge techniques and efficient water management
policies can help sustain urban growth while
minimizing environmental degradation.
Remote Sensing Applications in LULC Studies:
Avtar et al. (2014) and Prasad & Ramesh (2019) used
remote sensing to monitor traditional water bodies
and ecologically fragile areas, respectively. These
techniques enhance the ability to track land changes
over time, supporting conservation efforts and
sustainable planning. Hsieh (2021) integrated
climate-sensitive urban planning in LULC
ICRDICCT‘25 2025 - INTERNATIONAL CONFERENCE ON RESEARCH AND DEVELOPMENT IN INFORMATION,
COMMUNICATION, AND COMPUTING TECHNOLOGIES
428
assessments, demonstrating how satellite-based data
can guide policy decisions for climate resilience.
Green Spaces and Sustainable Urban Planning:
Ramaiah & Avtar (2019) reviewed urban green
spaces' importance in rapidly urbanizing Indian cities.
Their findings emphasized the role of green corridors,
parks, and urban forests in mitigating air pollution,
enhancing biodiversity, and improving residents'
well-being. Ramaiah et al. (2020) analyzed how land
cover influences land surface temperature in two
proposed smart cities, suggesting that incorporating
green spaces can significantly reduce urban heat
stress.
GIS-Based LULC Analysis: GebreMedhin et al.
(2019) utilized GIS and remote sensing to detect
urban LULC dynamics in Axum Town, Ethiopia.
Their study showed how GIS-based techniques help
in visualizing and predicting urban expansion, aiding
policymakers in sustainable city planning.
Schellnhuber et al. (2012) warned about the
implications of a 4-degree Celsius temperature rise
due to LULC alterations, stressing the urgency of
mitigating land degradation through proactive
policies.
3 STUDY AREA
Chhatrapati Sambhajinagar, colloquially known as
Aurangabad, lies in the heart of Maharashtra, India,
positioned approximately 335 kilometers east of
Mumbai. Nestled at coordinates around 19.8762° N
latitude and 75.3433° E longitude, the city boasts a
diverse topographical canvas, from sprawling plains
to undulating landscapes interspersed with hills and
valleys, reflecting a rich geological tapestry of
basaltic lava flows and sedimentary formations.
Leveraging remote sensing technologies, researchers
can delve into a multitude of facets defining
Aurangabad's geography. Through satellite imagery
from platforms such as Landsat 8 and Sentinel-2, they
can decipher intricate land use patterns, delineate
urban expansion, and monitor the transformation of
natural landscapes into built environments. These
satellites, with their regular revisit times and
multispectral capabilities, offer a comprehensive
view of the region's evolving landscape over time.
This granular insight extends to the assessment of
vegetation cover, identifying areas of dense greenery
alongside regions undergoing deforestation or
degradation. Moreover, remote sensing facilitates the
scrutiny of water resources, aiding in the management
of rivers, lakes, and groundwater aquifers, while also
unveiling pollution hotspots and monitoring water
quality dynamics. In the context of Aurangabad's
burgeoning urbanization, satellite data serves as a
vital tool for urban planners, enabling them to chart
sustainable development pathways and mitigate the
environmental impact of rapid urban growth.
Additionally, by capturing atmospheric parameters
and land surface temperatures, remote sensing
contributes indispensable inputs to climate studies,
furnishing researchers with a comprehensive
understanding of Aurangabad's environmental
dynamics and resilience in the face of global climatic
shifts.
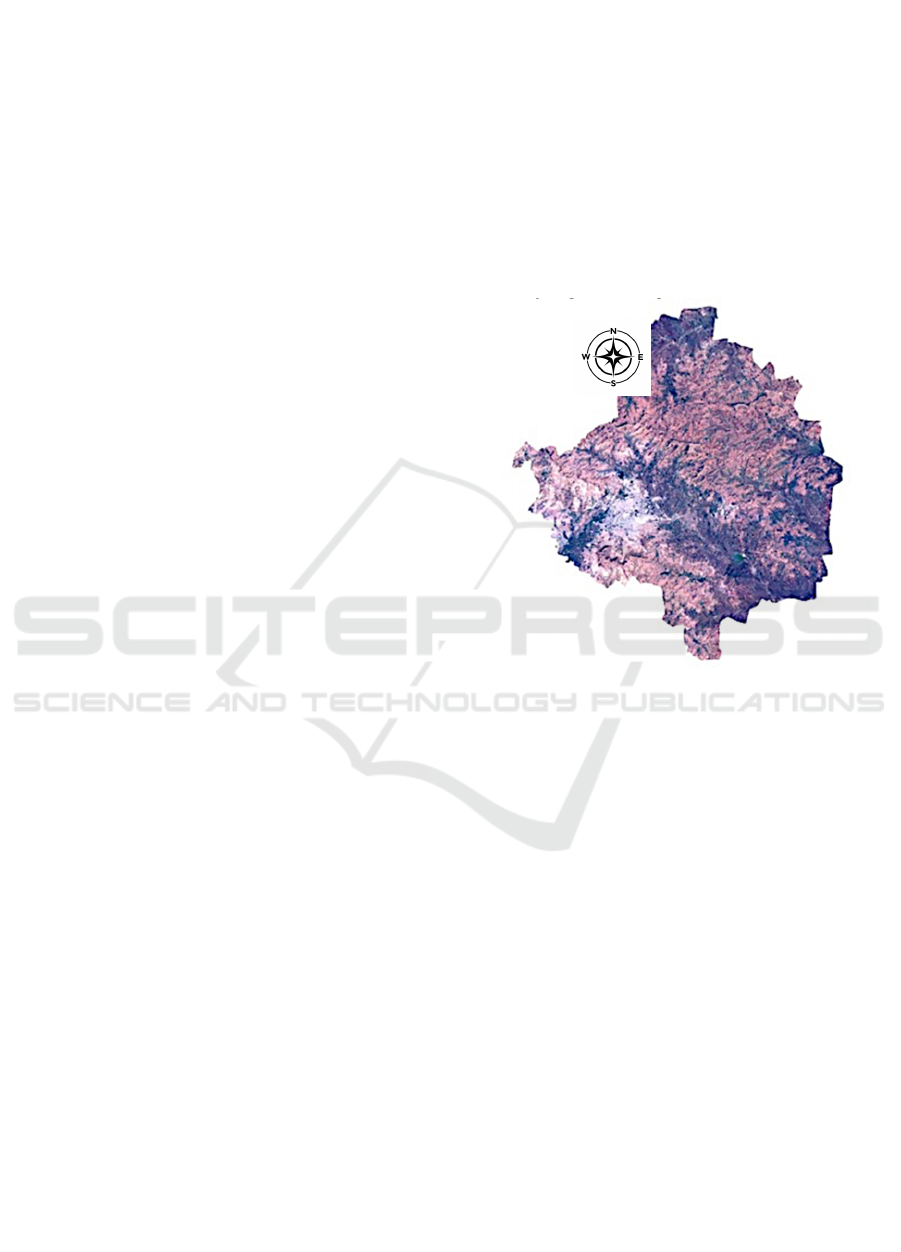
Figure 1 shows the Study Area - Chhatrapati
Sambhajinagar (Aurangabad).
Figure 1: Study Area - Chhatrapati Sambhajinagar
(Aurangabad).
4 METHODOLOGY
To study the geographical dynamics of Chhatrapati
Sambhajinagar (Aurangabad), Maharashtra, from
2014 to 2024, Landsat 8 and Sentinel-2 satellite
datasets were instrumental. Landsat 8, launched by
NASA and the USGS in 2014, provides moderate-
resolution imagery with a revisit time of
approximately 16 days. Sentinel-2, part of the
European Union's Copernicus program, offers high-
resolution multispectral imagery with a revisit time of
5 days. Leveraging the capabilities of these satellites,
researchers conducted a comprehensive analysis of
Aurangabad's landscape. The area was classified into
four major land cover classes: Vegetation, Bareland,
Built-up Area, and Waterbodies. Through a
meticulous examination of Landsat 8 and Sentinel-2
imagery, researchers discerned patterns of land use
and land cover changes. The Vegetation class
delineated areas of dense green cover, indicating
Temporal Analysis of Land Cover Dynamics in Chhatrapati Sambhaji Nagar Using Sentinel-2 Imagery and Random Forest Classification
429

ecological richness and potential habitat regions.
Bareland regions, devoid of vegetation, were
identified, suggesting natural degradation or
anthropogenic activities such as mining. The Built-up
Area class mapped urban sprawl and infrastructure
development, offering insights into the city's
expansion and population growth. Waterbodies
classification provided information on the
distribution and dynamics of rivers, lakes, and
reservoirs, crucial for water resource management
and environmental conservation efforts. By
integrating Landsat 8 and Sentinel-2 datasets and
employing these major classification classes,
researchers gained a comprehensive understanding of
Aurangabad's evolving landscape, facilitating
informed decision-making for sustainable
development and environmental management
initiatives.
The Landsat 8 satellite, operated by NASA and
the US Geological Survey, is renowned for its
multispectral imagery with a spatial resolution of 30
meters and a revisit time of 16 days. The paper delves
into the spectral characteristics of Landsat 8,
highlighting its effectiveness in capturing detailed
information about various land features.
Sentinel-2, another satellite system from the
European Space Agency, stands out for its high-
resolution multispectral imagery with spatial
resolutions ranging from 10 to 60 meters. The
research investigates the spectral bands of Sentinel-2
and assesses its potential for detailed land cover
classification, including the discrimination of
vegetation types, landforms, and water bodies.
Through a comparative analysis of these three
satellites, the paper aims to elucidate the trade-offs
between spatial resolution, temporal frequency, and
spectral characteristics in the context of LULC
mapping. Additionally, considerations such as cost,
data accessibility, and processing requirements are
discussed to provide a holistic framework for
decision-making when selecting a satellite platform
for LULC studies.
Therefore, the most efficient satellite often
involves a combination: Landsat 8 + Sentinel-
2: Offers detailed land cover maps with high spatial
resolution and frequent updates for change detection.
4.1 Data Analysis
For the research paper focused on classifying the land
cover of Chhatrapati Sambhajinagar (Aurangabad),
Maharashtra, from 2014 to 2024, utilizing the RM
algorithm offers a robust methodology. RM combines
multiple decision trees to improve classification
accurcy and robustness. The algorithm works by
constucting a multitude ofdecision trees during
training and outputs the mode of the classes predicted
by individual trees as the final classification.
In the context of land cover classification, the RM
algorithm excels in handling complex, high-
dimensional datasets such as multispectral imagery
from Landsat 8 and Sentinel-2 satellites. The
algorithm's ability to handle large datasets and
capture nonlinear relationships between spectral
features and land cover classes makes it well-suited
for this task.
The RM algorithm can be mathematically
represented as follows:
4.2 Training Phase
Given a training dataset
𝐷={(𝑥1,𝑦1),(𝑥2,𝑦2),...,(𝑥𝑛,𝑦𝑛)}D={(x1,y1
),(x2,y2),...,(xn,yn)}, where 𝑥𝑖xi represents the
input features (spectral bands) and 𝑦𝑖yi
represents the corresponding land cover class
labels.
RM builds multiple decision trees 𝑇1, 2, 𝑇𝑛T1
, T2,,Tn by randomly selecting subsets of
features and data samples (bootstrap
aggregating or bagging).
At each node of the decision tree, a random
subset of features is considered for splitting,
and the best split is chosen based on criteria
such as Gini impurity or information gain.
The trees continue to grow until a stopping
criterion is met, such as reaching a maximum
depth or minimum number of samples per leaf
node.
4.2.1 Prediction Phase
During the prediction phase, each decision
tree in the forest independently classifies the
input data point.
For a given input feature vector 𝑥x, each
decision tree outputs a predicted class label.
The final prediction is determined by
aggregating the individual predictions through
a majority voting scheme. The class with the
most votes across all trees is assigned as the
final prediction.
In the research paper, the RM algorithm would be
applied to the Landsat 8 and Sentinel-2 datasets to
classify the land cover of Aurangabad into the
predefined classes (Vegetation, Bareland, Built-up
Area, and Waterbodies). The performance of the
classifier would be evaluated using metrics such as
ICRDICCT‘25 2025 - INTERNATIONAL CONFERENCE ON RESEARCH AND DEVELOPMENT IN INFORMATION,
COMMUNICATION, AND COMPUTING TECHNOLOGIES
430

overall accuracy, precision, recall, and F1-score, and
compared against other classification algorithms.
Additionally, feature importance analysis could be
conducted to identify the most influential spectral
bands for land cover classification. Overall,
leveraging RM for land cover classification provides
a robust and efficient approach for analyzing the
dynamics of Aurangabad's landscape over the
specified period.
4.3 Feature Selection and Classification
In our research, feature selection for RM
classification in Google Earth Engine (GEE) was
conducted to accurately classify the land cover of
Chhatrapati Sambhajinagar (Aurangabad),
Maharashtra, from 2014 to 2024. Initially, relevant
spectral bands from Landsat and Sentinel-2 satellite
imagery were identified, including visible, near-
infrared, and shortwave infrared bands, known to be
informative for distinguishing between different land
cover classes. Additionally, vegetation indices such
as Normalized Difference Vegetation Index (NDVI),
Enhanced Vegetation Index (EVI), and Soil Adjusted
Vegetation Index (SAVI) were derived from the
available spectral bands to capture important
vegetation-related information. Ancillary data layers
such as elevation, slope, aspect, and land surface
temperature were also incorporated as additional
input features, utilizing the capabilities of GEE's
ee.Terrain module and accessing other datasets
through ee.ImageCollection. These selected features
were combined into a single feature stack, ensuring
they were on comparable scales. Subsequently, a RM
classifier was instantiated using the
ee.Classifier.randomForest() function, with
parameters such as the number of trees in the forest
and the number of input features to consider at each
split specified. The dataset was divided into training
and validation sets using random sampling, and the
classifier was trained using the training dataset and
evaluated using the validation dataset. Performance
metrics including overall accuracy, kappa coefficient,
precision, recall, and F1-score were computed to
assess the classification accuracy of the trained
model. By following this methodology, we aimed to
achieve accurate and robust land cover mapping and
analysis for Aurangabad, Maharashtra, facilitating
informed decision-making for sustainable
development and environmental management
initiatives in the region.
In our research, the selection of sample points,
training, and classification for RM in Google Earth
Engine (GEE) was meticulously conducted to
accurately assess the land cover dynamics of
Chhatrapati Sambhajinagar (Aurangabad),
Maharashtra, spanning from 2014 to 2024. Initially,
sample points were strategically selected across the
study area to ensure spatial representation and capture
the variability of different land cover classes. This
was achieved by employing random or systematic
sampling techniques within each land cover class of
interest. The sample points were then visually
inspected and verified to ensure their accuracy and
representativeness.
Subsequently, a RM classifier was trained using
the selected sample points. The
ee.Classifier.randomForest() function in GEE was
employed to instantiate the classifier, with parameters
such as the number of trees in the forest and the
number of input features specified. The training
dataset consisting of the sample points along with
their corresponding land cover labels was used to
train the classifier. During the training process, the
classifier learned the relationship between the input
features (e.g., spectral bands, vegetation indices,
ancillary data) and the land cover classes.
Following the training phase, the trained RM
classifier was applied to the entire study area for land
cover classification. Satellite imagery, such as
Landsat or Sentinel-2, covering the specified time
period was utilized for classification. The classifier
assigned a land cover class label to each pixel in the
study area based on its spectral characteristics and the
learned decision rules from the training phase.
To assess the accuracy of the classification, a
validation dataset consisting of independently
collected ground truth data or a subset of the original
dataset was used. Performance metrics such as overall
accuracy, kappa coefficient, precision, recall, and F1-
score were computed by comparing the classified
land cover map against the validation dataset.
By meticulously selecting sample points, training
a RM classifier, and accurately classifying the land
cover using GEE, our research aimed to provide
valuable insights into the land cover dynamics of
Aurangabad, Maharashtra, facilitating informed
decision-making for land management and
environmental conservation efforts in the region.
Figure 2 shows the 2014. Figure 3 shows the 2024.
Table 1 shows the Classification Details in Hectors.
Buitup Area:
Waterbodies:
Bareland:
Vegitation:
Temporal Analysis of Land Cover Dynamics in Chhatrapati Sambhaji Nagar Using Sentinel-2 Imagery and Random Forest Classification
431
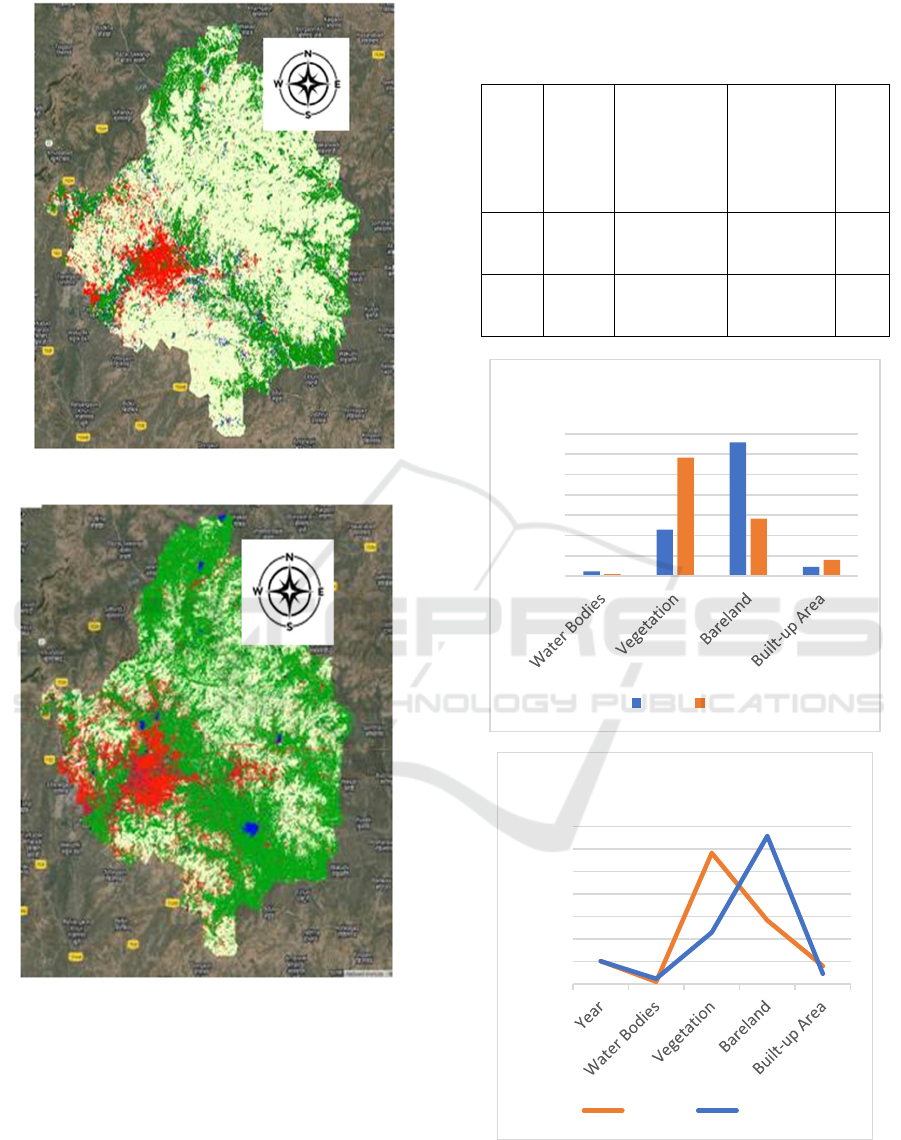
Figure 2 : 2014
Figure 3: 2024.
4.4 Statistics
Table 1: Classification Details in Hectors.
Year
Water
Bodie
s (ha)
Vegetation
(ha)
Bareland
(ha)
Buil
t-up
Are
a
(ha)
2014
457.5
4
4,573.53 13,160.36
893.
85
2024
190.5
0
11,660.05 5,646.60
1,58
8.14
(a)
(b)
Figure 4(a),4(b): Classification Chart. (Values are in
hectors)
0
2000
4000
6000
8000
10000
12000
14000
Chart Title
2014 2024
0
2000
4000
6000
8000
10000
12000
14000
Chart Title
Series2 Series1
ICRDICCT‘25 2025 - INTERNATIONAL CONFERENCE ON RESEARCH AND DEVELOPMENT IN INFORMATION,
COMMUNICATION, AND COMPUTING TECHNOLOGIES
432

5 CONCLUSIONS
The classification approach on the region of interest
using RM is based on the training data and the
accuracy based on the trained model using random
forest algorithm. The observations from the results
are over the timespan of study the water bodies and
vegetation are gradually decreases whereas the
builtup area and bareland increases gradually. It
shows that the urbanization has major impact on the
land cover parameter. The proposed method finding
can be used for the further landuse landcover studies.
This research not only demonstrates the effectiveness
of the Random Forest algorithm in capturing intricate
land cover dynamics but also provides valuable
insights for policymakers and urban planners. Figure
4(a),4(b) shows the Classification Chart. (Values are
in hectors) These insights can be leveraged to develop
informed land management strategies that promote
sustainable urban growth and environmental
conservation in Chhatrapati Sambhajinagar and other
rapidly developing cities
REFERENCES
Agarwal, C.; Green, G.M.; Grove, J.M.; Evans, T.P.;
Schweik, C.M. A Review and Assessment of Land-Use
Change Models: Dynamics of Space, Time, and Human
Choice; Gen. Tech. Rep. NE-297; U.S. Department of
Agriculture, Forest Service, Northeastern Research
Station: Newton Square, PA, USA, 2002; Volume 297,
61p.
Avtar, R.; Herath, S.; Saito, O.; Gera, W.; Singh, G.;
Mishra, B.; Takeuchi, K. Application of remote sensing
techniques toward the role of traditional water bodies
with respect to vegetation conditions. Environ. Dev.
Sustain. 2014, 16, 995–1011.
Bai, X.; McPhearson, T.; Cleugh, H.; Nagendra, H.; Tong,
X.; Zhu, T.; Zhu, Y.-G. Linking Urbanization and the
Environment: Conceptual and Empirical
Advances. Annu. Rev. Environ. Resour. 2017, 42,
215–240.
Chadchan, J.; Shankar, R. An Analysis of Urban Growth
Trends in the Post-Economic Reforms Period in
India. Int. J. Sustain. Built Environ. 2012, 1, 36–49.
Chamling, M.; Bera, B. Spatio-Temporal Patterns of Land
Use/Land Cover Change in the Bhutan–Bengal Foothill
Region Between 1987 and 2019: Study Towards
Geospatial Applications and Policy Making. Earth
Syst. Environ. 2020, 4, 1–14.
Chen, J.; Sun, B.-M.; Chen, D.; Wu, X.; Guo, L.-Z.; Wang,
G. Land Use Changes and Their Effects on the Value of
Ecosystem Services in the Small Sanjiang Plain in
China. Sci. World J. 2014, 2014, e752846.
Ethiopia. Environ. Syst. Res. 2019, 8, 21.
GebreMedhin, A.; Biruh, W.; Govindu, V.; Demissie, B.;
Mehari, A. Detection of Urban Land Use Land Cover
Dynamics Using GIS and Remote Sensing: A Case
Study of Axum Town, Northern Ethiopia. J. Indian Soc.
Remote Sens. 2019, 47, 1209–1222.
Hong, H.T.C.; Avtar, R.; Fujii, M. Monitoring changes in
land use and distribution of mangroves in the
Hsieh, C.-M. Sustainable Planning and Design: Urban
Climate Solutions for Healthy, Livable Urban and
Rural Areas. J. Urban Manag. 2021, 10, 1–2.
Hua, A.K. Land Use Land Cover Changes in Detection of
Water Quality: A Study Based on Remote Sensing and
Multivariate Statistics. J. Environ. Public
Health 2017, 2017, 7515130.
Li, X.-H.; Liu, J.-L.; Gibson, V.; Zhu, Y.-G. Urban
Sustainability and Human Health in China, East Asia
and Southeast Asia. Curr. Opin. Environ.
Sustain. 2012, 4, 436–442.
Mahmood, R.; Jia, S.; Zhu, W. Analysis of Climate
Variability, Trends, and Prediction in the Most Active
Parts of the Lake Chad Basin, Africa. Sci. Rep. 2019, 9,
6317.
Pande, C.B.; Moharir, K.N.; Kumar Singh, S.; Varade,
A.M.; Elbeltagi, A.; Khadri, S.F.R.; Choudhari, P.
Estimation of Crop and Forest Biomass Resources in a
Semi-Arid Region Using Satellite Data and GIS. J.
Saudi Soc. Agric. Sci. 2021, 20, 302–311.
Patra, S.; Sahoo, S.; Mishra, P.; Mahapatra, S.C. Impacts of
Urbanization on Land Use/Cover Changes and Its
Probable Implications on Local Climate and
Groundwater Level. J. Urban Manag. 2018, 7, 70–84.
Prasad, G.; Ramesh, M.V. Spatio-Temporal Analysis of
Land Use/Land Cover Changes in an Ecologically
Fragile Area—Alappuzha District, Southern Kerala,
India. Nat. Resour. Res. 2019, 28, 31–42.
Ramaiah, M.; Avtar, R. Urban Green Spaces and Their
Need in Cities of Rapidly Urbanizing India: A
Review. Urban Sci. 2019, 3, 94.
Ramaiah, M.; Avtar, R.; Rahman, M.M. Land Cover
Influences on LST in Two Proposed Smart Cities of
India: Comparative Analysis Using Spectral
Indices. Land 2020, 9, 292.
Romanowicz, R.J. The Impacts of Changes in Climate and
Land Use on Hydrological Processes. Acta
Geophys. 2017, 65, 785–787.
Schellnhuber, H.J.; Hare, W.; Serdeczny, O.; Adams, S.;
Coumou, D.; Frieler, K.; Martin, M.; Otto, I.M.;
Perrette, M.; Robinson, A.; et al. Turn down the Heat:
Why a 4 Deg C Warmer World Must Be Avoided;
Sauvons le Climat-SLC: Paris, France, 2012; p. 110.
Swain, D.; Roberts, G.J.; Dash, J.; Vinoj, V.; Lekshmi, K.;
Tripathy, S. Impact of Rapid Urbanization on the
Microclimate of Indian Cities: A Case Study for the
City of Bhubaneswar. In Land Surface and Cryosphere
Remote Sensing III; International Society for Optics
and Photonics: Bellingham, WA, USA, 2016; Volume
9877, p. 98772X.
Watson, R.T.; Noble, I.R.; Bolin, B.; Ravindranath, N.H.;
Verardo, D.J.; Dokken, D.J. Land Use, Land-Use
Change and Forestry: A Special Report of the
Temporal Analysis of Land Cover Dynamics in Chhatrapati Sambhaji Nagar Using Sentinel-2 Imagery and Random Forest Classification
433

Intergovernmental Panel on Climate Change;
Cambridge University Press: Cambridge, UK, 2000.
Yesuph, A.Y.; Dagnew, A.B. Land Use/Cover
Spatiotemporal Dynamics, Driving Forces and
Implications at the Beshillo Catchment of the Blue Nile
Basin, North Eastern Highlands of
ICRDICCT‘25 2025 - INTERNATIONAL CONFERENCE ON RESEARCH AND DEVELOPMENT IN INFORMATION,
COMMUNICATION, AND COMPUTING TECHNOLOGIES
434
