
Empirical Analysis of AI‑Based Hotspot Detection in Photovoltaic
Panels Using Thermal Images
K. Subha
1
and S. Sharanya
2
1
Department of CSE, SRM IST, Kattankulathur, Chennai, Tamil Nadu, India
2
Department of DSBS, SRM IST, Kattankulathur, Chennai, Tamil Nadu, India
Keywords: Photovoltaic Panels, Hotspot, Fault Detection, Fault Classification, Thermal Image, Empirical Analysis,
Machine Learning.
Abstract: The abundant heat energy exhaled from the sun can be used for diverse applications using modern technology,
which is known as solar energy. Photoelectric cell converts sunlight energy into electrical energy directly by
using a photovoltaic effect. Long-term exposure of PV panels to malicious conditions increases their risk of
cell damage which causes hot-spot and can reduce the efficiency of electricity production, perhaps resulting
in fires. Surface fault detection (FD) is a key strategy to enhance PV panel reliability and performance and
improve energy management. This study presents an empirical analysis of hotspot detection in PV panels
using thermal images through different machine learning (ML) and deep learning (DL) algorithms including
Vision Transformer (ViT) that were assessed for fault detection in solar cells. A dataset consisting of thermal
images, derived from the solar plant, was utilized in this study, consisting of 3 classes: cell, hot spot and multi
hot spot for experiment fault classification in solar panels. To evaluate performance a comprehensive
comparison of accuracy, precision, f1-score, recall, mAP (Mean Average Precision) parameters of the model
were used. The result showed that the model based on the vision transformer exhibited better performance in
hotspot fault detection problems in PV modules. In fact, transformer models were found to be efficient for
fault detection with good accuracy (98%). Through empirical analysis it was found that Transformer based
techniques have outperformed well based on ML, DL-based approaches.
1 INTRODUCTION
Energy that originates from natural resources and is
regenerated within a human timescale is known as
renewable energy. These resources are crucial for
transitioning to a cleaner and more sustainable energy
future, as they are typically abundant and
environmentally beneficial. Renewable energy
consists mainly of solar, wind, hydropower, biomass,
and geothermal sources. Solar energy and wind
energy systems will meet 88% of global energy
demand and of all energy sources by 2050 (Ram,
Manish, et al. 2019) Solar energy is an alternative and
more pollution free electric energy while compared to
thermal energy.
The Earth absorbs solar radiation at a pace that is
about ten times higher than the rate at which people
use energy. Solar panels or PV panels are complex
structures made up of various numbers of PV cells for
producing solar energy. To keep this PV working
more efficiently and reliably over time with different
climate conditions they should be strictly monitored,
protected and inspected. However, a motley of
fault issues could appear while solar panel modules are
accomplishing due to variations in the external
environment (Alajmi, Masoud, et al, 2019)
Hotspots, cracks, open circuits, shadows and short
circuits are examples for common defects. Solar
panels that are left out in the elements for an extended
period of time are vulnerable to damage and cracking
from thunderstorms, ultra violet rays, and thermal
cycling. Hot-spot failure will arise from localized
heating of the solar panels caused by over irradiation.
Hot spots release heat and reduce the efficiency of
power generation by consuming power produced in
other parts of the panel. Solder joints on the panels
may melt when the temperature rises, harming them
and perhaps starting a fire. There are two main
avenues of study for hot-spot fault detection of solar
panels: one uses the electrical properties of the panels,
and the other uses the infrared image characteristics
of the panels (Dhimish, Mahmoud, and Ghadeer
400
Subha, K. and Sharanya, S.
Empirical Analysis of AI-Based Hotspot Detection in Photovoltaic Panels Using Thermal Images.
DOI: 10.5220/0013930500004919
Paper published under CC license (CC BY-NC-ND 4.0)
In Proceedings of the 1st International Conference on Research and Development in Information, Communication, and Computing Technologies (ICRDICCT‘25 2025) - Volume 5, pages
400-407
ISBN: 978-989-758-777-1
Proceedings Copyright © 2026 by SCITEPRESS – Science and Technology Publications, Lda.
Badran, 2019), (Yang, Weihua,2022)
In order to use photovoltaic panel electrical
characteristics such as voltage and current for hot-
spot fault detection, these characteristics must first be
obtained and then input into an analytical
mathematical-statistical model of intelligent
algorithms. Another common method involves using
temperature and pixel data from images of infrared
photovoltaic panels. Non-contact detection
contributes to maintaining solar panel performance,
extending equipment life and increasing financial
returns. This can be done by using unmanned aerial
vehicles (UAVs) for extensive utilization of target
identification with low cost, high efficiency and a
significant field of vision. Additionally, this offers a
fresh approach to the tiresome and recurrent hot- spot
defect detection work faced by photovoltaic power
plants. Big data problems that are high-dimensional,
redundant and noisy can be better solved by deep
learning models. When detecting faults in PV panels
in a complex environment using thermal images taken
by UAV, the lightweight deep learning model is used
to speed up detection and reduce resource
consumption but cannot improve the robustness and
accuracy of hotspot detection.
This survey begins by detailing the external
factors that lead to failures in PV modules, discussing
their impact on both the physical components and
overall performance. Consequently, an examination
of the various types and modes of failure is conducted,
identifying hotspots as the most significant issue. In
conclusion, strategies for reducing these failures are
suggested.
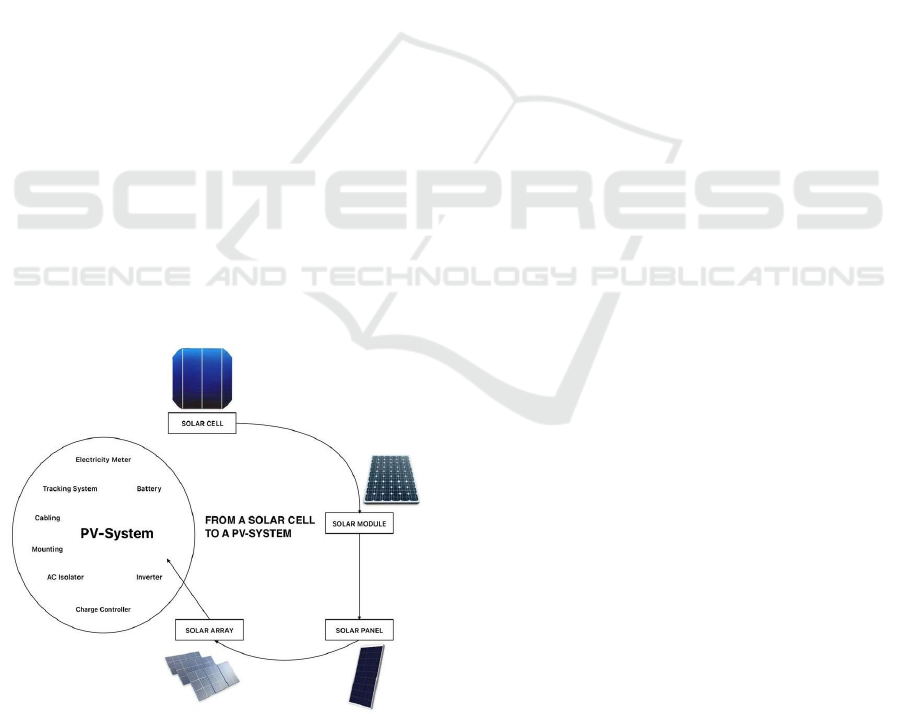
Figure 1: From a solar cell to a PV-system.
Figure 1 outlines a PV system's components, from
solar cells to panels, inverters, meters, and optional
batteries, illustrating how sunlight is converted into
electricity for home or grid use.
2 LITERATURE SURVEY
(Qian et al. 2023) mentioned about Hotspot Defect
Detection (HDD) in photovoltaic (PV) modules with
infrared images (IFIs) is a challenging task due to the
size and morphology variations of individual hotspots
and the lack of an effective detection method to find
all hotspots. HF protective measures such as
segmentation of IFIs and implementation of state-of-
the-art YOLOv5s in the training of background noise
data up to October 2023 that is not befitting of the FI
will improve the identification of FI hotspots leading
to tailored HF supplier screening and reduced
transmission rates of FI.
(Alajmi et al. 2019) did a research on incredibly
cooling efficiency which exhibits the deficiency of
conventional defect localization methods in PV
arrays. This promotes a new approach for fault
hotspot detection based on infrared thermal imaging;
going forward, they plan to build models that allow
for the quick detection of open-circuit and short-
circuit faults.
(Dhimish and Badran. 2019) Presented a fuzzy
logic-based approach for detection of faults in
photovoltaic modules. Input parameters used in
model: three input parameters were proposed in their
model: open circuit voltage (Voc), short-circuit current
(Isc), and Power Loss Percentage (PPL). One major
drawback of their method is that the hot spots are not
identified under high partial shading conditions.
(Yang et al, 2022) reviewed a number of CNN-
based surface defect detection methods. This study
emphasizes the significance of artificial intelligence
in enhancing defect recognition in photovoltaic
modules based on machine vision. (Dhimish, Mather,
and Holmes et al, 2019) characterize eight
horticultural types of hotspots based on PV
degradation rate and PPL. They use cumulative
density function (CDF) modeling to achieve 80%
accuracy in hotspot impact prediction. It indicates
that hybridization of models with CDF will
significantly improve the predictive capability.
(Liu et al. 2024) presented a Machine Learning
based Stacking Classifier (MLSC) as a solution for
solar panel hotspot fault diagnosis. It compares the
physical methods of detection, threshold methods and
AI methods of detection. The results obtained with
this method can serve as a basis to present whether
MLSC is useful for accurate detection; in this case,
fault detection is achieved based on irradiance,
Empirical Analysis of AI-Based Hotspot Detection in Photovoltaic Panels Using Thermal Images
401
temperature, current, and power parameters.
The proposal for accurate PV string diagnosis
suggests a stacking classifier (MLSC) model to
accomplish accurate classification automatically and
remotely. The MLSC for PV string accurate fault
diagnosis is inspired and based on the physical fault
detection methods known as artificial intelligence.
PV fault diagnosis techniques incorporate physical
detection methods, threshold methodologies and
machine learning methods of detection. Additionally,
physical techniques tackle the identification and
position of the fault through the use of measuring
instruments to capture and scrutinize the performance
features of the PV defect. Threshold techniques apply
the I- V technique based on the position of inverter
current scans to generate I-V curves under normal and
faulty conditions.
3 RESEARCH METHODOLOGY
It describes strategies for analyzing data with the
intent of anticipating hotspot faults in PV systems. By
Performing Empirical analysis, we can identify
appropriate ML and DL algorithms for fault
detection. Algorithms like Support Vector Machine
(SVM), Logistic Regression, Decision Tree,
XGBoost, Naive Bayes, and Convolutional Neural
Networks (CNN) were analyzed in this work.
This work employs quantitative research
methodology to analyze the use of ML and DL
techniques for hotspot fault detection in PV systems.
The methodology includes data capture, feature
engineering, data preparation, model choice, and
analysis of results with the purpose of determining the
practicality of hotspot fault methods within the
context of solar energy system reliability and
performance optimization.
Data Collection: The analysis is based on
operational data acquired from a real-world solar PV
system in Location. Data on temperature patterns, in
the form of infrared (IR) thermography imaging, are
collected from different equipment and saved in
cloud- based systems for real-time analysis of hotspot
faults in solar panels.
Data Processing: The use of higher-order statistics
(HOS) such as mean, variance, skewness, and kurtosis
in data processing to reveal subsurface defects is an
essential part of machine learning. These parameters
compress the entire thermographic sequence into one,
or very few, images that contain detailed information
about the defects.
Model Development: ML and DL techniques are
used to develop fault detection models that can
identify deterioration patterns in solar panel
infrastructure. For classification problems, logistic
regression, tree-based methods, XGBoost, Naive
Bayes, and Support Vector Machines are
examples of supervised learning methods which are
adopted.
Model Training and Validation: To predict hotspot
faults in solar Panels, training and validation data
were evaluated using a 60-40 split. Cross- validation
techniques were applied to validate the data.
Optimising model performance and improving
predicted accuracy is achieved by hyperparameter
tuning. Model validation is performed with the use of
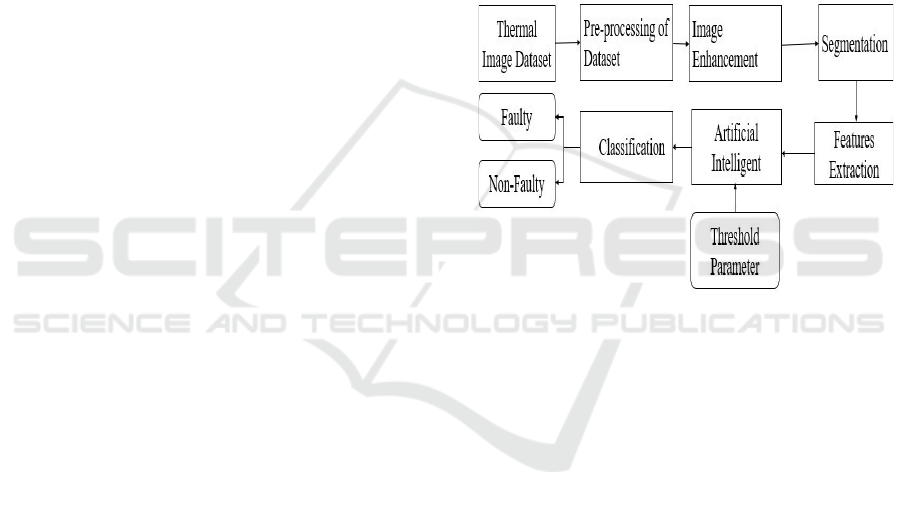
Accuracy, Precision, Recall, and F1-score. The figure
2 represents a basic architecture diagram for AI based
hotspot fault detection in PV panels.
Figure 2: The proposed AI model to detect hotspot.
Support Vector Machine (SVM): Support Vector
Machines (SVMs) are learning algorithms that use
supervised models to tackle tricky problems in
classification, regression, and spotting outliers. Two
distinct classes- health (non-faulty) and faulty
(hotspot) are created from the thermal pictures of PV
panels using SVM to detect faults. SVM's primary
goal is to find a function for training data that is as
smooth as possible with no deviations from the real
vectors. This method splits thermographic images of
PV systems into separate parts, and creates color
descriptors for each area. These color descriptors then
serve as features to train various learning algorithms.
These algorithms group PV panels into three types:
normal, hotspot, and faulty. After rigorous testing and
in-depth analysis, the results show that the learning
system has an accuracy of 92%.
Decision Trees: Decision trees are great approach
for hotspot analysis in solar PV system. Very simple
to deploy with good performance for both numerical
and categorical data. This method helps narrow down
the conditions that can predict hotspots considering
ICRDICCT‘25 2025 - INTERNATIONAL CONFERENCE ON RESEARCH AND DEVELOPMENT IN INFORMATION,
COMMUNICATION, AND COMPUTING TECHNOLOGIES
402

many factors such as temperature and irradiance and
current and voltage. The input data for solar power
plants consists of power generation and weather, and
the process of pre-processing data until training the
model using the proposed DT-LGB (Decision Trees
with Light Gradient Boosting) algorithm to predict
errors. After training, the model learns to identify
patterns and anomalies in the input data, whether
these are major flaws or smaller discrepancies. Most
of these findings require follow-up for appropriate
treatment or diagnosis. According to the study's
results, the model attained an efficiency rate of 81%.
Logistic regression: Logistic regression, a
statistical tool used mostly in binary classification,
can be used for thermal image classification where
image pixels are considered features and predicted
with the use of a sigmoid function. It is most
appropriate for binary classification problems, for
which one needs to predict two possible outcomes.
Sigmoid functions convert any real number input to
a value between 0 and 1; it is a chance of belonging
to that specific class. According to the study results,
the model achieved an efficiency rate of 89 percent.
Naive Bayes: Naive bayes is a probabilistic
classifier based on Bayes' theorem for hotspot
analysis in solar PV systems with strong(naive)
independence assumptions between the features. This
algorithm is used to detect visual flaws in
photovoltaic modules based on data extracted from
deep learning model. The findings imply that deep
learning feature extraction combined with naive
bayes offers a strong technique for PV module
condition monitoring, providing a dependable means
of problem detection and system efficiency
maintenance.
CNN: The CNN was trainee dusting a data set of
labeled thermal images where hotspots were
manually annotated, allowing the system to learn the
distinguishing features of hotspot patterns. The
system achieved an impressive 95% detection rate,
demonstrating its effectiveness in accurately
identifying hotspots.
Random Forest: Random forest extracted features
according to the calculated feature importance by
forming the feature subspace. It selected the decision
trees for construction according to the similarity and
classification accuracy of different decisions. After
performing the rigorous testing, it provides 85 percent
accuracy.
ViT: Vision Transformers, or ViT for short, is a
fascinating architecture that leverages self-attention
mechanisms to analyze images. The whole setup is
built around a sequence of transformer blocks. Each
of these blocks is made up of two key components: a
multi-head self- attention layer and a feed-forward
layer. This model attained an efficiency rate of 98
percent.
4 EMPIRICAL ANALYSIS
An empirical analysis involves collecting and
analysing data to test hypotheses based on machine
learning algorithms with different classification
metrics. The focus of this subsection is to show the
results achieved with various supervised
classification algorithms and their corresponding
metrics like Accuracy, Precision, Recall, F1-score,
and mean Average Precision (mAP).
INDICATOR AND PROMINENCE: Indicators are
essential tools used in machine learning and deep
learning algorithms to provide information about
specific conditions, performance of PV panels with
various classification metrics. It is used to establish to
what extent the model is applicable to the given
situation and to ascertain the health state of the
machine. They are of extreme relevance in
confirming the model dataset. Some of the possible
metrics in classification are discussed below.
4.1 Accuracy
Accuracy refers to the proportion of correctly
identified images versus the total number of images.
To achieve these confusion matrices are used for the
effectiveness of a classification framework. It is a
matrix table that uses four distinct combinations of
expected and actual values—TP, TN, FP and FN to
summarize how well a machine learning algorithm
performs.
I.
True Positive (TP): It is able to predict defect
columns.
II.
False Positive (FP): It is able to predict non-
defect columns as defect columns.
III.
False Negative (FN): It is able to predict
defect columns as non-defect columns.
IV.
True Negative (TN): It is able to predict non-
defect columns.
Mathematically, it is expressed as:
𝐴𝑐𝑐𝑢𝑟𝑎𝑐𝑦 =
(1)
4.2 Precision
Precision is a measure to find the accuracy of positive
predictions made by a model. Precision of image
classification is the number of correctly predicted
positive examples over all the examples which were
Empirical Analysis of AI-Based Hotspot Detection in Photovoltaic Panels Using Thermal Images
403
predicted positive. Mathematically, it is expressed as
𝑃𝑒𝑟𝑐𝑖𝑠𝑖𝑜𝑛 =
()
(2)
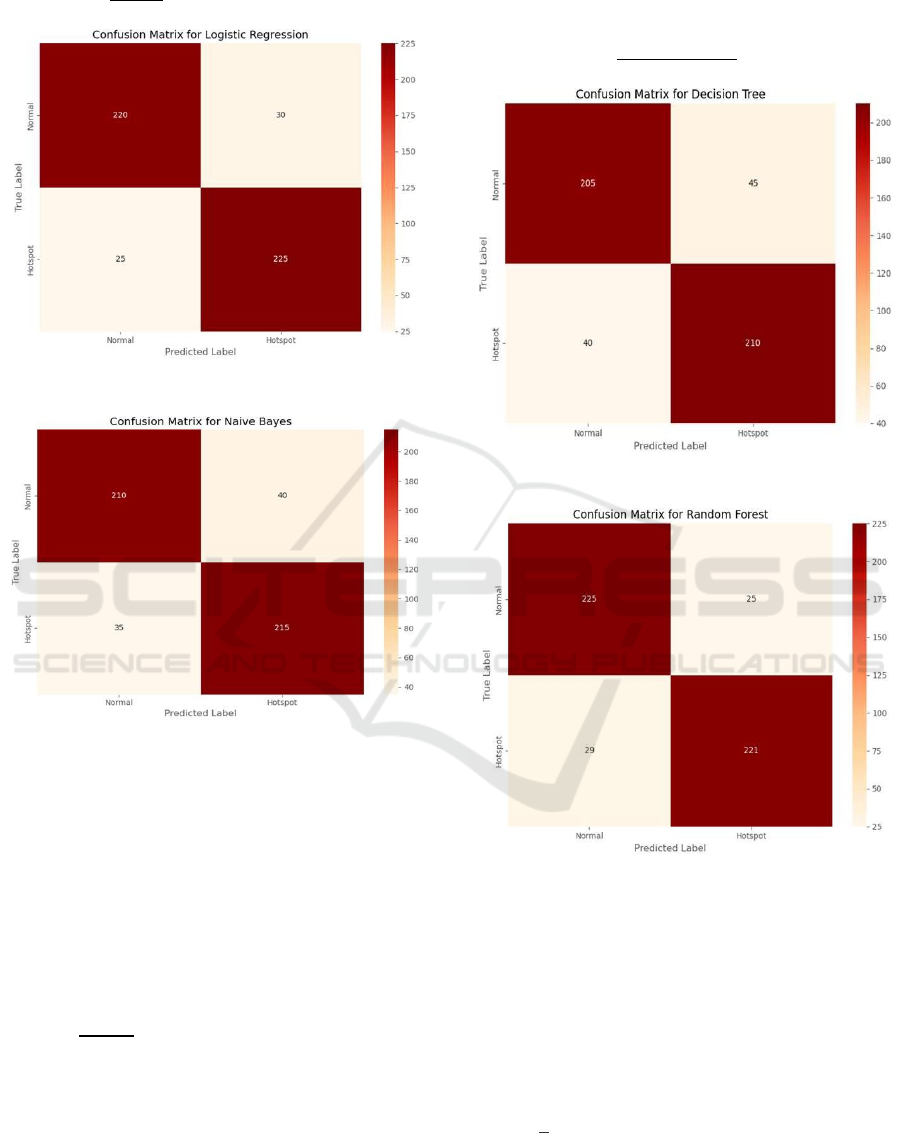
Figure 3: Confusion matrix of logistic regression.
Figure 4: Confusion matrix of naive bayes.
4.3 Recall (R)
Remember that recall, sensitivity, or true positive rate
measures the skill of a classification model to capture
all relevant data points within a given dataset. As far
as image classification is concerned, recall measures
the ratio of true positive cases (images belonging to a
certain class) which the model recognizes to the total
number of positive cases. Mathematically, it is
expressed as:
𝑅𝑒𝑐𝑎𝑙𝑙 =
()
(3)
4.4 F1-Score
The performance of image classification models
relies on many metrics, one being F1-Score, which
captures both precision and recall in a single measure
that balances the trade-off. The model can be utilized
in various aspects of classification accuracy and is a
good add-on to models that integrate other form of AI
tasks. Mathematically, it is expressed as:
𝐹1−𝑆𝑐𝑜𝑟𝑒=2∗
(∗)
()
(4)
Figure 5: Confusion matrix of decision tree.
Figure 6: Confusion matrix of random forest.
Multi-class image classification comes hand in
hand with object detection, and object detection
comes with its own F1-Score based metrics named
Mean Average Precision (mAP). AP is commonly
known for capturing the precision-recall trade-off but
for a targeted class. Mathematically, it is expressed
as:
𝐴𝑃 = ∑
(
𝑅
𝑅
)
𝑃
(5)
𝑚𝐴𝑃 =
∑
𝐴𝑃
(6)
ICRDICCT‘25 2025 - INTERNATIONAL CONFERENCE ON RESEARCH AND DEVELOPMENT IN INFORMATION,
COMMUNICATION, AND COMPUTING TECHNOLOGIES
404
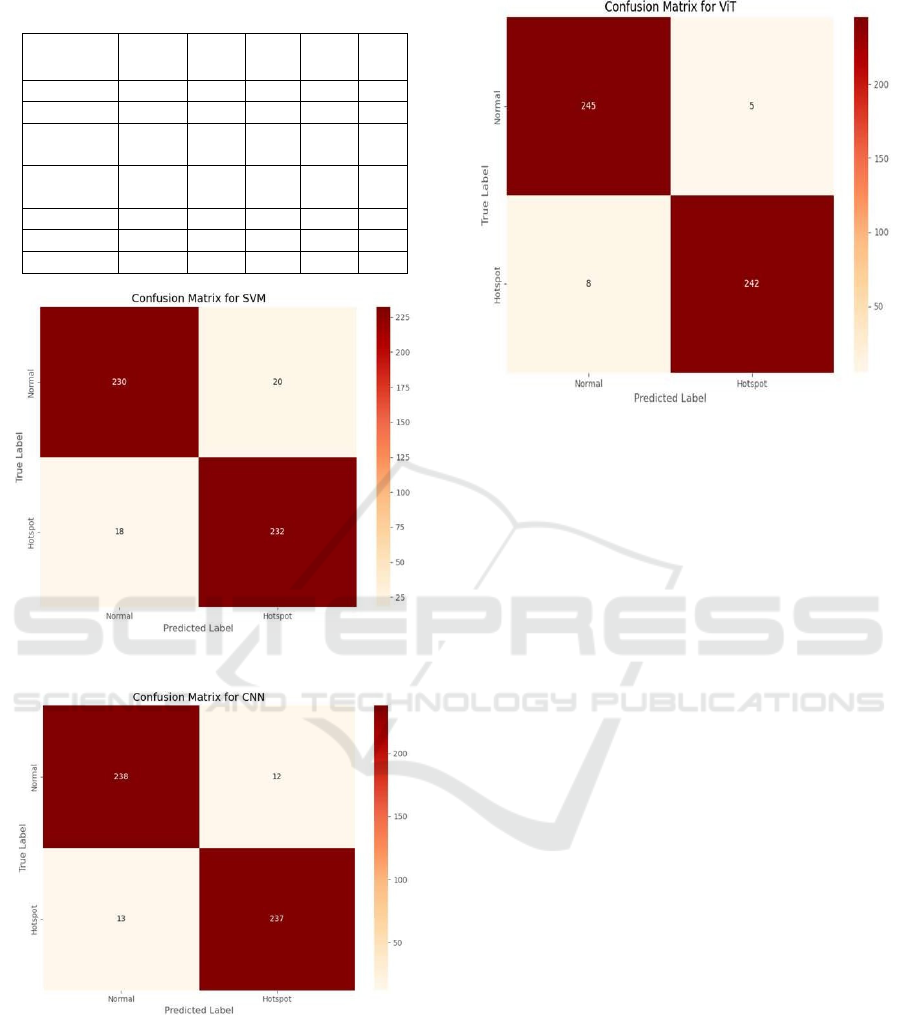
Table 1: Algorithm comparison.
Algorithm
Accur
ac
y
Preci
sion
Recall
F1-
Score
mA
P
LR
89 87 86 86 85
Naive Bayes 83 81 82 81 79
Decision
Trees
81 79 83 81 78
Random
Forest
85 90 92 91 86
SVM 92 91 90 90 89
CN
N
95 94 95 95 93
ViT 97 96 97 96 95
Figure 7: Confusion matrix of SVM.
Figure 8: Confusion matrix of CNN.
Figure 9: Confusion matrix of vision transform.
The empirical analysis of seven machine learning
models Logistic Regression, Naive Bayes, Decision
Trees, Random Forest, SVM, CNN, and Vision
Transformer (ViT) demonstrates the superiority of
deep learning approaches for anomaly detection in
photovoltaic system thermography (figure 3-9).
Traditional models like Logistic Regression (89%
accuracy) and Naïve Bayes (83% accuracy) showed
reasonable performance but suffered from higher
misclassification rates, as observed in their confusion
matrices, where a significant number of false
positives and false negatives were recorded. Decision
Trees (81%) and Random Forest (85%) improved in
recall but lacked overall precision, indicating
inconsistencies in classification. SVM (92%)
provided a more balanced performance with fewer
misclassifications, showing its ability to handle non-
linearly separable data effectively. However, CNN
(95%) and ViT (97%) outperformed all traditional
models, with ViT achieving the highest precision
(96%) and recall (97%), signifying its superior ability
to capture complex spatial patterns in thermal images.
The confusion matrix for ViT exhibited the lowest
number of false classifications, demonstrating its
robustness. The
results
confirm
that
deep
learning-based
models, especially ViT, are the most
effective for analyzing photovoltaic thermographic
data, offering higher accuracy and reliability in
detecting hotspots and anomalies, which is crucial for
early fault detection and maintenance in solar energy
systems.
Empirical Analysis of AI-Based Hotspot Detection in Photovoltaic Panels Using Thermal Images
405
5 RESULT AND DISCUSSIONS
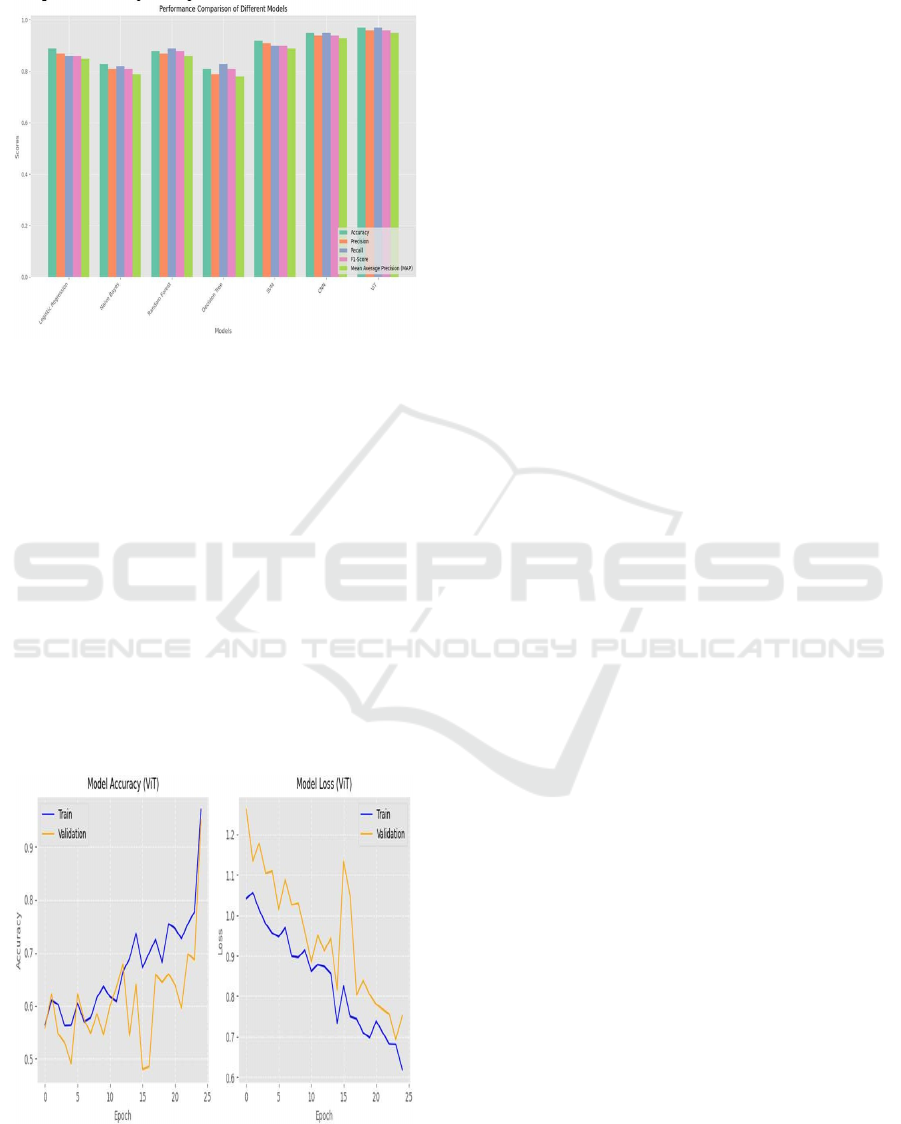
Figure 10: Performs comparison.
By comparing seven diverse classification
algorithm such as Logistic Regression, Naïve Bayes,
Decision Trees, Random Forest, SVM, CNN, and
Vision Transforms (ViT) to evaluate performance of
fault detection in PV panel using thermal image.
Based on Accuracy, Precision, Recall, and F1-score
and mAP, ViT algorithm illustrated the most
excellent outcomes with the most elevated precision
and the slightest misclassification blunders. CNN and
SVM moreover performed well but had marginally
lower accuracy compared to ViT. Conventional
machine learning models appeared generally lower in
execution, showing that profound learning
approaches, particularly ViT, are more compelling
for accomplishing superior classification. Figure 10
shows the comparison among the algorithms.
Figure 11: ViT accuracy and performance validation.
The analysis of the effectiveness of various
machine learning models integrated with photovoltaic
framework thermography shows that Vision
Transformer (ViT) outperforms the others by a
considerable performance metrics. ViT achieved the
most elevated accuracy (97%) with prevalent
precision (96%), recall (97%), and F1-score (96%),
demonstrating its robustness in classification tasks
(figure 11). The confusion matrix for ViT appears to
have negligible misclassifications, with only few
False Positives and False Negatives, making it the
most reliable. CNN takes after closely with a
precision of 95%, whereas SVM moreover performs
well at 92%, but both show somewhat higher
misclassification rates. Conventional models like
Calculated Relapse, Naïve Bayes, Choice Trees, and
Irregular Woodland appear lower precision,
extending from 81% to 89%, with expanded
misclassification blunders. The experimental
examination affirms that profound learning
approaches, especially ViT, viably capture spatial and
relevant data, making them the optimal choice for
identifying warm peculiarities in photovoltaic
frameworks.
6 CONCLUSIONS
This analysis compiles a comparative study of
different classification techniques conducted to
determine the best algorithm for PV system hotspot
fault detection. The result indicates that models
developed on deep learning, and Vision Transforms
(ViT) in particular, outperformed all other
conventional machine learning algorithms in terms of
accuracy, precision, recall, F1 score and mAP. ViT
recorded the highest accuracy of 97%, and hence it is
the best choice when the correct detection of defects
in PV panels. CNN and SVM were also doing
exceptionally well, and other conventional models
like Logistic Regression, Naive Bayes, Decision
Trees and Random Forest recorded much lower
accuracy and reliability.Based on these findings, it is
evident that advanced deep learning techniques
provide superior results, making them well-suited for
enhancing the efficiency of photovoltaic system
monitoring and fault detection.
REFERENCES
Alajmi, Masoud, et al. "IR thermal image analysis: An
efficient algorithm for accurate hot-spot fault detection
and localization in solar photovoltaic systems." 2019
ICRDICCT‘25 2025 - INTERNATIONAL CONFERENCE ON RESEARCH AND DEVELOPMENT IN INFORMATION,
COMMUNICATION, AND COMPUTING TECHNOLOGIES
406

IEEE International Conference on Electro Information
Technology (EIT). IEEE, 2019.
Ali, Muhammad Umair, et al. "Early hotspot detection in
photovoltaic modules using color image descriptors:
An infrared thermography study." International Journal
of Energy Research 46.2 (2022): 774-785.
Balasubramani, Gomathy, and Venkatesan Thangavelu.
"Thermal Image Analysis of Photovoltaic Panel for
Condition Monitoring Using Hybrid Thermal Pixel
Counting Algorithm and XGBoost Classifier." Electric
Power Components and Systems (2023): 1-14.
Dhimish, Mahmoud, and Ghadeer Badran. "Photovoltaic
hot- spots fault detection algorithm using fuzzy
systems." IEEE Transactions on Device and Materials
Reliability 19.4 (2019): 671-679.
Dhimish, Mahmoud, Peter Mather, and Violeta Holmes.
"Novel photovoltaic hot-spotting fault detection
algorithm." IEEE Transactions on Device and Materials
Reliability 19.2 (2019): 378-386.
Koester, L.; Linding, S.; Louwen, A.; Astigarraga, A.;
Manzolini, G.; Moser, D. Review of photovoltaic
module degradation, field inspection techniques and
techno-economic assessment. Renew. Sustain. Energy
Rev. 2022, 165, 112616.
Liu, Bo, et al. "Fault diagnosis of photovoltaic strings by
using machine learning‐based stacking classifier." IET
Renewable Power Generation 18.3 (2024): 384-397.
Moskovchenko, Alexey, and Michal Svantner.
"Thermographic Data Processing and Feature
Extraction Approaches for Machine Learning-Based
Defect Detection." Engineering Proceedings 51.1
(2023): 5.
Pruthviraj, Umesh, et al. "Solar photovoltaic hotspot
inspection using unmanned aerial vehicle thermal
images at a solar field in south india." Remote Sensing
15.7 (2023): 1914.
Qian, Huimin, et al. "Hotspot defect detection for
photovoltaic modules under complex backgrounds."
Multimedia Systems 29.6 (2023): 3245-3258.
Qureshi, Muhammad Salik, Shayan Umar, and Muhammad
Usman Nawaz. "Machine Learning for Predictive
Maintenance in Solar Farms." International Journal of
Advanced Engineering Technologies and Innovations
1.3 (2024): 27-49.
Ram, Manish, et al. "Global energy system based on 100%
renewable energy–power, heat, transport and
desalination sectors." Study by Lappeenranta
University of Technology and Energy Watch Group,
Lappeenranta, Berlin 10 (2019)
Sharanya, S., and Revathi Venkataraman. "Empirical
analysis of machine learning algorithms in fault
diagnosis of coolant tower in nuclear power plants."
New Trends in Computational Vision and Bio-inspired
Computing: Selected works presented at the ICCVBIC
2018, Coimbatore, India (2020): 1325-1332.
Sivagamasundari, S., and Manjula Sri Rayudu. "IoT based
solar panel fault and maintenance detection using
decision tree with light gradient boosting."
Measurement: Sensors 27 (2023): 100726.
T. Alqahtani, A. Almutared and A. Alzahrani,
"Photovoltaic Hot Spot Detection System Using Deep
Convolution Neural Networks," 2023 IEEE
International Future Energy Electronics Conference
(IFEEC), Sydney, Australia, 2023, pp. 327-330, doi:
10.1109/IFEEC58486.2023.10458570.
Umar, Shayan, Muhammad Salik Qureshi, and Muhammad
Usman Nawaz. "Thermal imaging and ai in solar panel
defect identification." International Journal of
Advanced Engineering Technologies and Innovations
1.3 (2024): 73-95.
Venkatesh, S. Naveen, et al. "A comparative study on bayes
classifier for detecting photovoltaic module visual
faults using deep learning features." Sustainable Energy
Technologies and Assessments 64 (2024): 103713.
Yang, Weihua. "A survey of surface defect detection based
on deep learning." 2022 7th International Conference
on Modern Management and Education Technology
(MMET 2022). Atlantis Press, 2022.
Zazoum, Bouchaib. "Solar photovoltaic power prediction
using different machine learning methods." Energy
Reports 8 (2022): 19-25.
Empirical Analysis of AI-Based Hotspot Detection in Photovoltaic Panels Using Thermal Images
407
