
Clear Brook: A Mobile App that Crowd Sources Water‑Related
Problems from Around a Community and Display Them on a Man
S. Manikandan
1
, M. Rehaana Hafrin
1
, V. Bhagyalakshmi
1
, Sudaroli
1
,
M. Ramakrishnan
2
and M. P. Thiruvenkatasuresh
2
1
Department of Information Technology, E.G.S. Pillay Engineering College, Nagapattinam, Tamil Nadu, India
2
Department of Information Technology, Erode Senguthar Engineering College, Erode, Tamil Nadu, India
Keywords: Geolocation Services, Community Reporting, Real‑Time Monitoring, Water Issue Tracking, Data
Visualization, GIS Mapping.
Abstract: Water-Related challenges, including scarcity, contamination, leakage, and flooding, significantly impact
communities worldwide. This paper presents a mobile application that leverages crowdsourcing and
geolocation technologies to enable users to report and track water issues in real-time. Through an intuitive
interface, citizens can submit location-based reports enriched with descriptions, photos, and severity levels.
These reports are aggregated, validated, and displayed on an interactive map, providing authorities, NGOs,
and policymakers with valuable insights into critical water-related problems. The platform fosters community
participation and data-driven decision-making, facilitating proactive interventions and sustainable water
resource management. By bridging the gap between citizens and stakeholders, the application enhances
response efficiency and contributes to long-term water sustainability efforts.
1 INTRODUCTION
Water-related challenges such as scarcity,
contamination, leakage, and flooding pose significant
threats to communities worldwide, impacting public
health, agriculture, and infrastructure. Addressing
these issues requires efficient monitoring, timely
reporting, and coordinated intervention. Traditional
water management systems often rely on manual
reporting and bureaucratic processes, leading to
delays in identifying and resolving issues.
Additionally, the lack of centralized data and real-
time monitoring hinders effective decision-making
and resource allocation (
J. M. Shepherd, 2022).
This paper introduces a mobile application that
leverages crowdsourcing and geolocation
technologies to enable community-driven reporting
of water-related problems (
M. P. Gomez and L. J.
Brown, 2022)
. The platform allows users to submit
location-based reports enriched with descriptions,
images, and severity levels. These reports are
aggregated and visualized on an interactive map,
offering real-time insights into problem hotspots. By
integrating computer vision and machine learning
techniques, the system enhances data validation and
categorization, ensuring reliable information for
decision-makers (
P. Rajalakshmi., 2022).
Unlike traditional water management approaches,
this application bridges the gap between citizens and
authorities by fostering active participation,
accountability, and collaboration (
N. Al-Ghamdi and K.
S. Al-Hassan., 2021)
. The system incorporates an alert
mechanism to notify relevant stakeholders about
critical issues, enabling a faster response to
emergencies such as pipeline bursts or flood risks.
Furthermore, predictive analytics can be integrated to
analyze historical data and anticipate potential water-
related issues before they escalate.
The proposed solution is designed to be scalable
and adaptable (
R. K. Mishra et al., 2021), making it
suitable for both urban and rural environments (
S.
Wang et al., 2021)
. It can be customized to
accommodate region-specific water challenges and
integrate with existing governmental or non-
governmental databases (
S.Manikandan et al., 2024). By
providing a decentralized yet structured approach to
water issue reporting, the application contributes to
long-term sustainability, disaster preparedness, and
efficient resource management (
Saradhi Thommandru
V et al., 2024)
.
This paper explores the system’s architecture, key
Manikandan, S., Hafrin, M. R., Bhagyalakshmi, V., Sudaroli, , Ramakrishnan, M. and Thiruvenkatasuresh, M. P.
Clear Brook: A Mobile App that Crowd Sources Water-Related Problems from Around a Community and Display Them on a Man.
DOI: 10.5220/0013929900004919
Paper published under CC license (CC BY-NC-ND 4.0)
In Proceedings of the 1st Inter national Conference on Research and Development in Information, Communication, and Computing Technologies (ICRDICCT‘25 2025) - Volume 5, pages
357-361
ISBN: 978-989-758-777-1
Proceedings Copyright © 2026 by SCITEPRESS – Science and Technology Publications, Lda.
357
functionalities, user engagement strategies, and the
broader impact of crowdsourced water issue tracking.
Additionally, we discuss potential challenges such as
data validation, user participation, and system
scalability, along with future enhancements to
improve its effectiveness (
Mujawar, M et al., 2024)
.
2 METHODOLOGY
The proposed system integrates Firebase services and
machine learning techniques to create a secure,
efficient, and real-time platform for water issue
reporting and management. The methodology
consists of the following key components:
2.1 User Authentication & Security
The system ensures secure user authentication using
Firebase Authentication, which employs scrypt for
password hashing, HMAC-SHA256 for JWT signing,
and OAuth 2.0 for Google Sign-In. This prevents
unauthorized access and protects user data.
2.2 Real-Time Database & Data
Management
Firestore is used as the primary database, offering B-
tree indexing for fast retrieval, WebSockets for real-
time updates, and Firestore Security Rules to enforce
access control. This enables seamless storage and
retrieval of issue reports.
2.3 Media Handling & Storage
Users can upload images as proof of water-related
issues. These images are stored securely in Firebase
Storage, which utilizes AES-256 encryption, HMAC-
SHA256 for signed URLs, and resumable uploads to
ensure efficient and secure file handling.
2.4 Geolocation & Issue Mapping
The system captures location data using GPS and
network-based location services. It employs the
Haversine formula to calculate distances and cluster
reports, ensuring accurate issue mapping and
identifying high-risk zones.
2.5 Image Processing & Optimization
Images are processed using JPEG compression and
bilinear interpolation to optimize storage and ensure
faster loading times without compromising quality.
This enhances user experience and system
performance.
This methodology ensures a secure, scalable, and
real-time solution for water issue reporting,
leveraging modern cloud-based technologies to
enhance user experience, optimize system
performance, and facilitate data-driven decision-
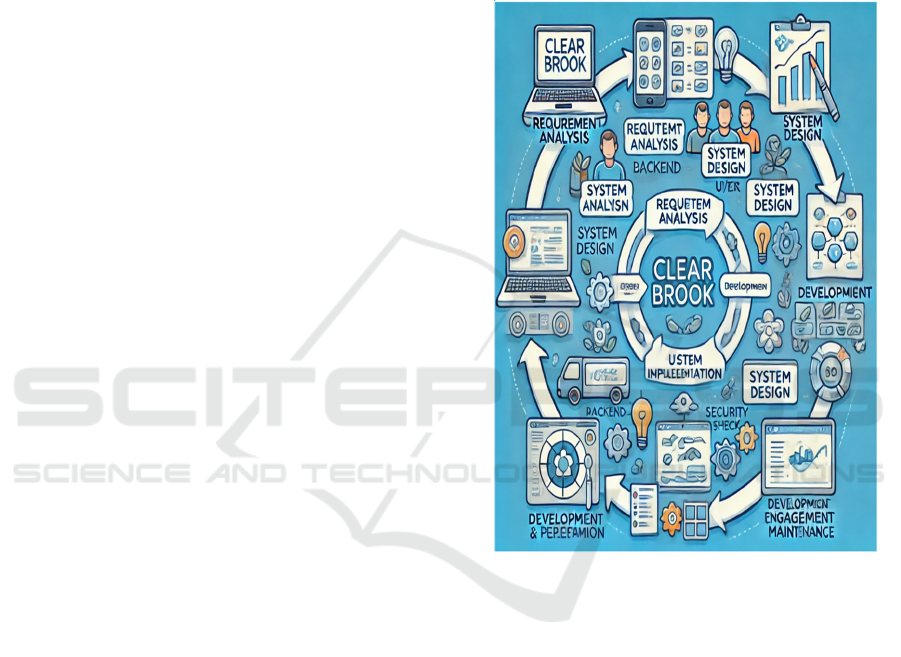
making. Methodology for proposed work Shown in
Figure 1.
Figure 1: Methodology for Proposed Work.
3 MODULES
3.1 User Management Module
The User Management Module ensures secure and
role-based access to the system. It allows citizens,
government authorities, and NGOs to register, log in,
and manage their profiles. Users can edit their profile
details such as name, email, and location preferences.
The system implements authentication methods like
email verification or OTP-based login to ensure
security. Different user roles define functionalities,
where citizens can submit reports, and authorities can
ICRDICCT‘25 2025 - INTERNATIONAL CONFERENCE ON RESEARCH AND DEVELOPMENT IN INFORMATION,
COMMUNICATION, AND COMPUTING TECHNOLOGIES
358
view, validate, and update issue statuses for proper
resolution.
3.2 Water Issue Reporting Module
The Water Issue Reporting Module enables users to
report water-related problems like leakage,
contamination, flooding, and scarcity. Reports
include text descriptions, severity levels, geolocation,
and images. The system automatically captures GPS
location or allows users to manually enter it. Users
can also attach images for better verification of the
reported problem. The collected data is stored in a
centralized database, where it undergoes validation
and processing before further action is taken.
3.3 Data Validation & Filtering
Module
The Data Validation & Filtering Module ensures that
only authentic and relevant reports are processed.
Natural Language Processing (NLP) techniques such
as TF-IDF and BERT analyze text descriptions and
detect spam or irrelevant content. Image verification
using Convolutional Neural Networks (CNNs) like
YOLO and OpenCV helps confirm whether uploaded
images match the reported issue. Additionally,
geolocation-based clustering (DBSCAN) detects
duplicate reports within the same area, preventing
unnecessary redundancy and improving accuracy.
3.4 Interactive Map & Visualization
Module
The Interactive Map & Visualization Module
provides a real-time view of reported water issues
using GIS-based mapping. The system displays
reports on an interactive map with color-coded
severity markers. Users can filter reports based on
issue type, severity, or location to analyze problem
patterns. Heatmaps help authorities and NGOs
identify high-risk zones, allowing them to allocate
resources efficiently. This module improves
transparency and helps visualize problem hotspots in
real time.
3.5 Notification & Alert Module
The Notification & Alert Module ensures that critical
water issues are addressed promptly by alerting
authorities, users, and other stakeholders. The system
uses a priority queue algorithm to classify reports
based on urgency and send push notifications, emails,
or SMS alerts. Users receive real-time updates on
their reported issues, while government agencies and
NGOs are notified to take necessary action. The
module also includes an emergency alert system for
major problems like flooding or severe
contamination.
3.6 Issue Resolution & Tracking
Module
The Issue Resolution & Tracking Module allows
authorities to update the status of reported problems
and track their resolution. Reports can be marked as
“Pending,” “In Progress,” or “Resolved”, ensuring
transparency. Users can track progress and provide
feedback once the issue is resolved. The module also
maintains a record of resolved issues, helping
stakeholders analyze response time, resolution
effectiveness, and service quality to improve future
interventions.
4 ARCHITECTURE
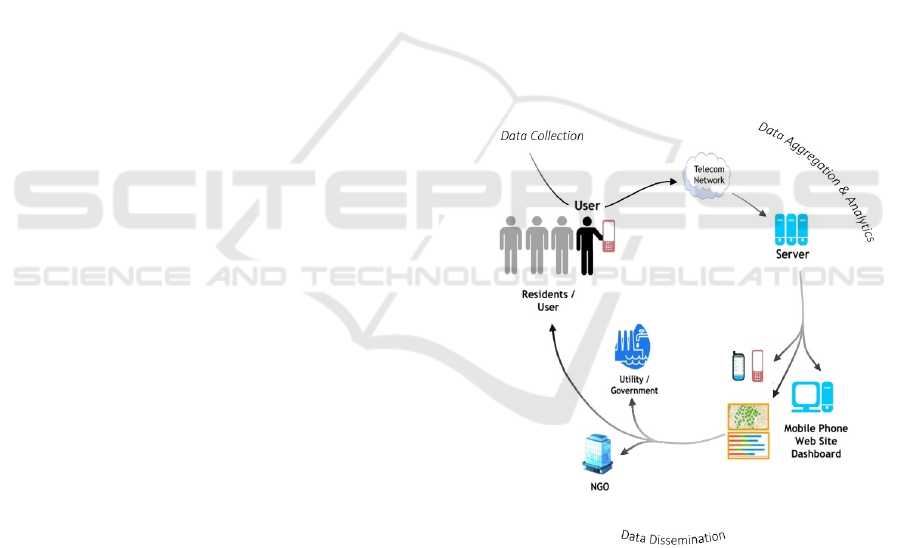
Figure 2: System Architecture.
This Figure 2 provides a structured framework for
efficiently handling water-related issues, ensuring
seamless communication between users, authorities,
and other stakeholders. It enables real-time data
collection, processing, analysis, and dissemination,
allowing for quick issue identification and resolution.
The architecture is designed with multiple layers,
each responsible for specific tasks such as data
collection, transmission, aggregation, analytics, and
Clear Brook: A Mobile App that Crowd Sources Water-Related Problems from Around a Community and Display Them on a Man
359
dissemination. These components work together to
streamline the reporting process and enhance
decision-making in water management.
4.1 Data Collection
This phase focuses on gathering information from
users regarding water-related issues such as leakage,
contamination, or inadequate supply.
Residents/Users: Individuals in a community
identify and report water-related issues using
mobile devices (smartphones or basic feature
phones).
Mobile Device Interaction: Users submit
reports through a dedicated mobile
application, SMS, or a web portal.
Telecom Network: The data is
transmitted through a telecom network
to ensure real-time reporting to the
server.
This stage ensures efficient and immediate issue
reporting, reducing delays in addressing water-related
problems.
4.2 Data Aggregation & Analytics
Once the data is collected, it is processed and
analysed to extract meaningful insights.
Server: The collected reports are sent to a
centralized server, which manages, stores, and
processes the data.
Data Processing: AI-based classification and
prioritization algorithms categorize reports
based on severity, location, and type of issue.
Data Analytics: Advanced analytics
techniques are applied to detect patterns,
trends, and high-priority areas for immediate
action.
This stage ensures efficient data organization,
making it accessible to decision-makers for effective
planning.
4.3 Data Dissemination
In this phase, the processed data is shared with
stakeholders who can take corrective actions.
Utility/Government Agencies: The
responsible authorities receive alerts and
notifications about reported water issues. They
deploy teams for repair and maintenance.
NGOs: Non-governmental organizations
working in water conservation and
management receive data to assist in
community projects.
Dashboard & Mobile Access: The analyzed
data is displayed on dashboards accessible via
mobile phones and computers. Users can track
reported issues, monitor resolution progress,
and stay informed about actions taken.
This phase ensures transparency, accountability,
and efficient problem-solving by involving multiple
stakeholders.
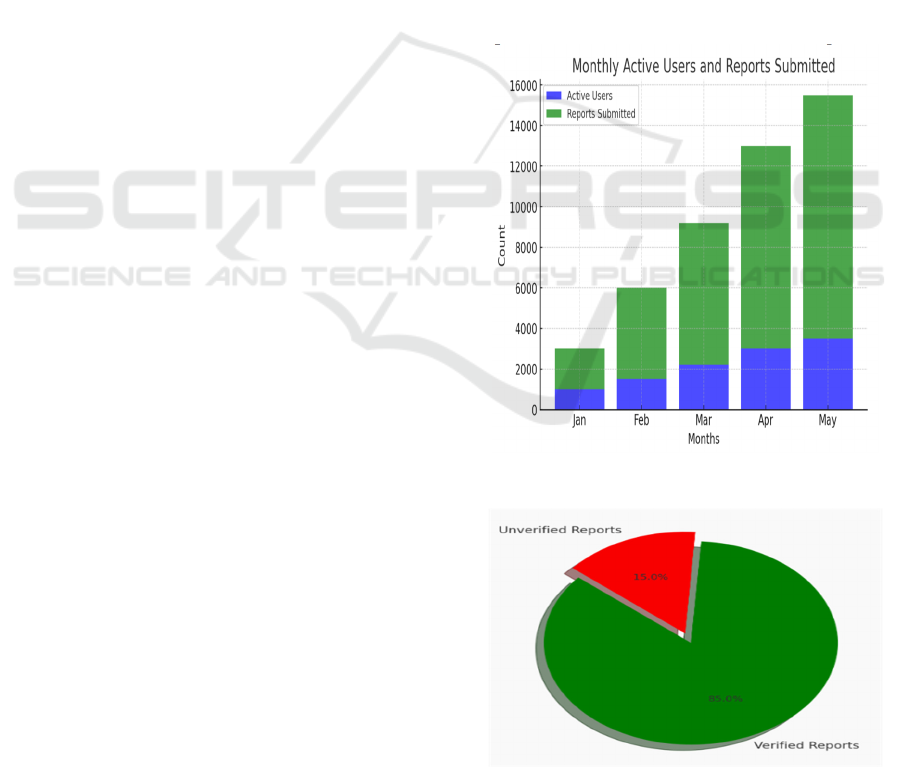
5 EXPERIMENTAL RESULTS
Figures 3 through 6 illustrate various aspects of the
system's performance and scope. Specifically, Figure
3 presents the Monthly Reports, Figure 4 displays the
Reports State, Figure 5 highlights the Range of Areas
Covered, and Figure 6 outlines the Future
Improvements envisioned for further development.
Figure 3: Monthly Reports.
Figure 4: Reports State.
ICRDICCT‘25 2025 - INTERNATIONAL CONFERENCE ON RESEARCH AND DEVELOPMENT IN INFORMATION,
COMMUNICATION, AND COMPUTING TECHNOLOGIES
360
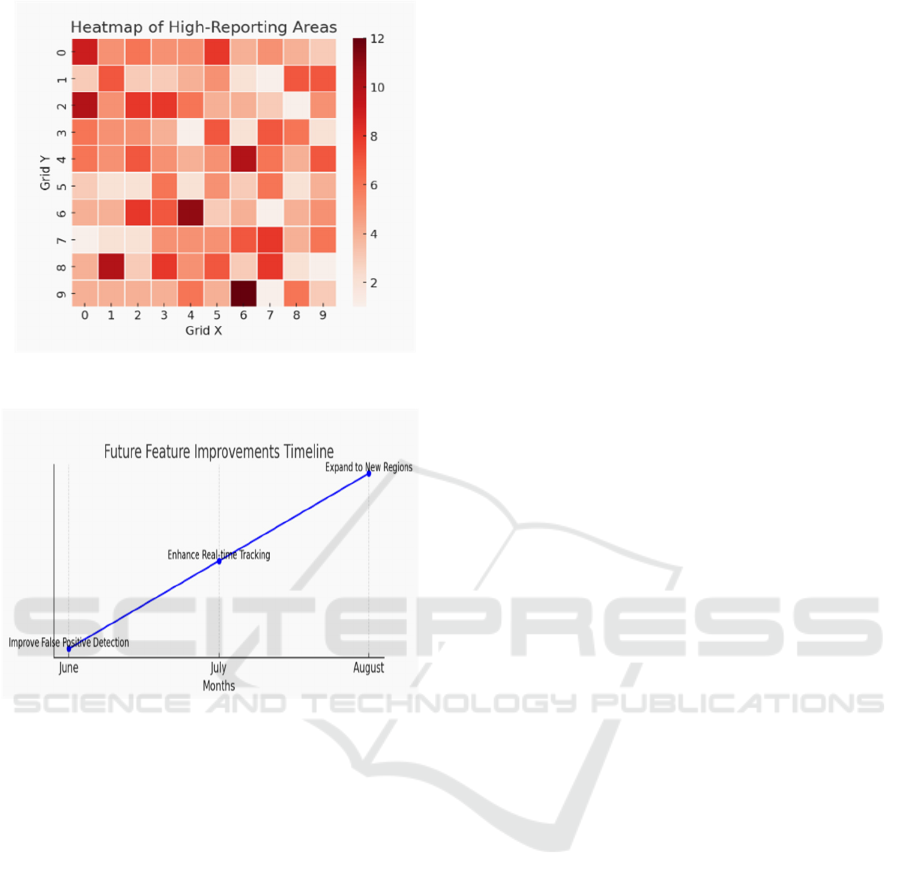
Figure 5: Range of Areas Covered.
Figure 6: Future Improvements.
6 CONCLUSIONS
In conclusion, this system provides a structured and
efficient approach to addressing water-related
challenges through real-time issue reporting,
validation, and resolution. By leveraging geolocation
services, AI-powered analytics, and seamless
communication channels, it enhances public
participation and ensures that authorities can take
timely action. The integration of automated alerts and
GIS-based mapping further improves transparency
and accountability, allowing for better resource
management and faster response times. Ultimately,
this system empowers communities and decision-
makers to work together in ensuring sustainable and
proactive water management.
REFERENCES
A. Kumar and S. Gupta, "Smart water management using
IoT and cloud computing," IEEE Internet of Things
Journal, vol. 8, no. 4, pp. 3120-3132, 2021.
J. M. Shepherd, "Flooding: Causes, consequences, and
solutions," IEEE Earthzine, vol. 14, no. 2, pp. 1-6,
2022.
M. P. Gomez and L. J. Brown, "GIS-based mapping and
visualization of water issues in urban areas,"
International Journal of Geoinformatics, vol. 18, no. 3,
pp. 55-68, 2022.
Mujawar, M., Manikandan, S., Kalbande, M. et al.
Optimizing connectivity: a novel AI approach to assess
transmission levels in optical networks. J Supercomput
(2024).]
N. Al-Ghamdi and K. S. Al-Hassan, "AI-driven early
warning systems for water leak detection," IEEE
Sensors Journal, vol. 19, no. 10, pp. 2015-2027, 2021.
P. Rajalakshmi, A. Shankar, and R. Balaji, "A
crowdsourced approach for monitoring urban water
crises using mobile applications," Proceedings of the
IEEE International Conference on Smart Cities and
Sustainable Solutions, pp. 112-117, 2022.
R. K. Mishra and B. N. Patil, "Geospatial analytics for
water crisis prediction using AI-based decision support
systems," IEEE Access, vol. 9, pp. 145678-145691,
2021.
S. Wang, Y. Li, and X. Chen, "Real-time water quality
monitoring using machine learning and IoT sensors,"
IEEE Transactions on Industrial Informatics, vol. 17,
no. 6, pp. 4201-4212, 2021.
S.Manikandan, E.Elakiya, K.C.Rajheshwari, &
K.Sivakumar, "Efficient energy consumption in hybrid
cloud environment using adaptive backtracking virtual
machine consolidation", Scientific Reports, (2024)
14:22869
Saradhi Thommandru V, Suma T, Odilya Teena AM,
Muthukrishnan A, Thamaraikannan P, Manikandan S.
Intelligent Optimization Framework for Future
Communication Networks using Machine Learning.
Data and Metadata [Internet]. 2024 Apr. 18 [cited 2024
Apr. 21]; 3:277.
Clear Brook: A Mobile App that Crowd Sources Water-Related Problems from Around a Community and Display Them on a Man
361
