
An Automated Crowd Management in Public Transport Using
Online Ticketing System
Krithikaa Venket V. S.
1
, S. Leelavathy
2
, S. Muthuselvan
1
, Rajes Kannan S.
1
and K. Rajakumari
3
1
Department of Information Technology, KCG College of Technology, KCG Nagar, Rajiv Gandhi Salai, Karapakkam,
Chennai – 600 097, Tamil Nadu, India
2
Department of Artificial Intelligence and Data Science, Panimalar Engineering College, Bangalore Trunk Road,
Varadharajapuram, Poonamallee, Chennai – 600 123, Tamil Nadu, India
3
Bharath Institute of Higher Education and Research, Chennai, Tamil Nadu, India
Keywords: Machine Learning, Overlapping Routes, ETA, Crowd Density Data Driven Decision Making, IR Sensor,
Passenger Counts, Route Demand.
Abstract: Due to the rapid increase in population, the usage of public transportation like local buses is increasing day
by day, especially in metropolitan cities, particularly in India, one densely populated country in the world.
Due to this, we are in need of proper crowd management in public transport, so we have developed automated
crowd management in public transport (MTC BUS) through an IR sensor integrated with an online ticket
booking system. Due to the unavailability of the estimated time of arrival (ETA) of the bus coming into the
bus stop for their destination, a high-demand route is congested with a high number of passengers when
compared with a low-demand route at a similar or slight variation of the ETA. This leads to improper usage
of public transport and an uneven distribution of crowd density. So, the crowd in the bus is estimated by fitting
an IR sensor in the door of the bus for calculating passenger count and classifying them into levels based on
crowd density, and the ETA is calculated based on the Machine learning algorithm. Decision-making on
allocating bus route numbers is based on ETA and demand for the buses on the selected route. All these
processes are connected with the online ticket booking system.
1 INTRODUCTION
Urban bus systems, an essential element of public
transportation, face many issues that detract from
passenger experience and system efficiency. One of
the most critical problems is over passenger
crowding, which affects comfort, safety and
operational efficiency. First, more crowded buses
lead to lower comfortability of passengers and also
potential safety concerns (Anju et al., 2022).
Crowding obstructs movement, blocks access to exit
doors, and raises the odds of accidents or injuries.
Second, the long ticket selling time at busy stops
greatly delays the bus time. But long queues of
passengers result in delayed departures, which in
turn reduces efficiency in all parts of the network
(Adithi S et al., 2022). Thirdly, increased congestion
and inefficient passenger flow due to uncontrolled
boarding. No separate queues or entry points, chaotic
boarding coupled with the passengers slowing down
the crowding process. Next, and more critically, the
conventional conductor-heavy ticketing systems,
especially in locations with high passenger volume,
are detrimental to operational efficiency. Fourthly,
boarding patterns are not coordinated (Adline Freeda
et al., 2016). Routes are often underutilized, as
passengers will board the next available bus. That
results in skewed demand across the routes some
buses are full while others sit a few seats empty,
compounding congestion on certain routes. All of
these challenges must be addressed in order to
improve the overall service and ridership of bus
systems. In this paper, we present a new
methodology to address as well as improve the public
transport journey for end-users (Ved Prakash Mishra
et al., 2019). Hence, ETA refers to the estimated time
of arrival of a vehicle to its destination.
V. S., K. V., Leelavathy, S., Muthuselvan, S., S., R. K. and Rajakumari, K.
An Automated Crowd Management in Public Transport Using Online Ticketing System.
DOI: 10.5220/0013926200004919
Paper published under CC license (CC BY-NC-ND 4.0)
In Proceedings of the 1st International Conference on Research and Development in Information, Communication, and Computing Technologies (ICRDICCT‘25 2025) - Volume 5, pages
259-265
ISBN: 978-989-758-777-1
Proceedings Copyright © 2026 by SCITEPRESS – Science and Technology Publications, Lda.
259

2 RESEARCH OBJECTIVES
2.1 Towards a Dynamic and Efficient
Bus System
Build, and train a highly accurate machine learning
model to predict bus ETAs for individual routes.
Integrate historic data from previous trips with live
traffic statistics, and route dependent factors like
conditions like weather, and flow of construction. 1-
Analyze the data for different aspects and categorize
the bus routes into either 1-5 demand levels based on
the analysis. In the topical identification phase,
relevant data, including passenger volume, peak hour
variations, geographical distribution, and others, must
be considered (Yu, B., Yang, Z., Yao, J., 2010).
Implement an algorithm that is capable of providing
real-time recommendations on the best routes to take
for passengers. Use predicted ETAs, route demand
categories, and, if available, passenger preferences, as
well as live bus locations. Optimize passenger wait
times and throughput by favoring routes with less
demand and lower ETAs Create a display for
passengers and onboard buses at bus stops that shows
this information to promote transparency and
informed decision making when planning travel (S.
Rajaprakash et al., 2020).
3 RELATED WORK
3.1 Machine Learning for ETA
Prediction
Deep learning models like LSTMs have shown
promise in predicting passenger boarding/exiting
patterns and improving ETA accuracy (Gandhi et al.,
2023). Ensemble methods combining different
models like Random Forests and SVMs can further
enhance accuracy (Liu, R., Li, S., Sun, L., Li, F., &
Sun, Z. 2017).
3.2 Demand-Based Route Allocation
Dynamic optimization algorithms considering real-
time demand and bus locations have achieved
significant reductions in passenger waiting times
(Zhang et al., 2021). Decentralized multi-agent
systems offer flexible route assignment based on local
information.
3.3 Crowd Density Sensing
Infrared sensors provide accurate passenger count
data within buses (S. Muthuselvan et al., 2015).
Computer vision algorithms using cameras can
estimate crowd density and passenger behavior for
real-time monitoring (Patil, S. A., and Soman, S. S.
2017).
4 METHODOLOGY
4.1 Data Collection and Processing
Historical Data: Collect historical data on bus speed,
distance, and Estimated Time of Arrival (ETA) for
various routes (Correia et al., 2014). Pre-process the
data to ensure its quality and consistency. Real-Time
Data: Implement a system to gather real- time speed
data using GPS sensors on buses. Integrate infrared
(IR) sensors at bus stops to count passengers entering
and exiting. Store the real-time speed and passenger
count data in a Firebase Real-time Database for
immediate access.
4.2 Machine Learning Model for ETA
Prediction
Train a machine learning model on historical data to
predict bus arrival ETAs based on real-time speed
information. Utilize simulated speed data during the
training process to mimic real-life GPS data behavior
(Meghana Sarode et al., 2020). Deploy the trained
model to continuously generate predicted ETAs for
each bus stop and update them in the Firebase
database.
4.3 Demand Category Classification
Define a Demand Category classification system for
routes based on the following:
Sequence of Bus Stops: Analyze the sequence of
total bus stops before the source stop and the overall
sequence within the route. Higher sequence numbers
indicate potentially higher passenger volumes.
Assign lower Demand Category values (e.g.,
Category 1) to routes with lower passenger volumes
and higher values (e.g., Category 5) to routes with
higher volumes.
ICRDICCT‘25 2025 - INTERNATIONAL CONFERENCE ON RESEARCH AND DEVELOPMENT IN INFORMATION,
COMMUNICATION, AND COMPUTING TECHNOLOGIES
260

4.4 Route Allocation Algorithm
• Develop an algorithm that considers the
following parameters when allocating routes
to buses:
• Demand Category: Prioritize routes with
lower Demand Category values to minimize
passenger crowding.
• Predicted ETA Difference: If multiple routes
have the same Demand Category, compare
predicted ETAs at the source stop (Mr.
Kruthik Gandhi H A et al., 2023).
• Select a route with a predicted ETA
difference below a pre-defined threshold
(e.g., 5-10 minutes) from the average
predicted ETA.
• Passenger Count: If there is a tie between the
demand category then use this passenger
count crowd level to decide if the best route
exists or there are no significant ETA
differences, consult the real-time passenger
count data.
• Allocate the route with a passenger count
below a specific threshold to distribute
passenger load across routes.
String crowd Level = "";
if (count >= 1 && count <= 10)
{
crowdLevel = "Seats Available";
}
else if (count >= 11 && count <= 20)
{
crowdLevel = "Less Crowded";
}
else if (count >= 21 && count<= 30)
{
crowdLevel = "Crowded";
}
else if (count >= 31 && count <= 40)
{
crowdLevel = "Highly Crowded";
}
else
{
crowdLevel = "Highly Dense
Crowded";
}
4.5 System Implementation
Integrate the data collection modules (GPS and IR
sensors) and the route allocation algorithm into a
central system using a Raspberry Pi Pico W or similar
microcomputer. Utilize the Firebase Real-time
Database to store and access the collected and
predicted data for real-time decision-making.
4.6 Evaluation and Testing
Evaluate the effectiveness of the system by
comparing passenger wait times, overcrowding
levels, and overall system efficiency before and after
implementation (Sri Sindhuja Selvanayaki P et al.,
2018). Conduct simulations and field tests to validate
the accuracy of the ETA prediction model and the
overall functionality of the route allocation algorithm.
Figure 1: Points Scored by the Different Bus Routes.
To achieve highly accurate passenger inflow and
outflow data, we propose a multi-sensor approach at
each bus door's entry/exit points. Infrared (IR)
sensors will be strategically positioned to ensure
unobstructed views and protection from potential
damage or external interference. Additionally, by
employing more than one or two sensors in a
combined configuration, we can significantly
enhance passenger detection accuracy. Figure 1
shows that the points scored by the different routes.
This redundancy will mitigate the limitations of
individual sensors and account for potential
occlusions caused by luggage, backpacks, or closely
following passengers. Data Collection: Continuously
collect real-time passenger count data from each
sensor and update under each route and bus stops in
firebase real time database, ensuring data points are
time stamped for accurate timing and
synchronization. Implement data quality checks to
identify and handle potential anomalies or sensor
malfunctions.
Algorithm for Crowd Level Classification:
Establish data-driven passenger count thresholds for
each crowd level, considering: Average passenger
capacity of buses in your system. Comfort and safety
considerations for passengers. Potential variations in
passenger size (e.g., luggage, standing vs. seated)
4.7 Widget for Ticket Booking App
Displaying the assigned route ID, predicted ETA, and
crowd level information (e.g., "Level 3: Crowded") in
a widget within the ticket booking app. This
An Automated Crowd Management in Public Transport Using Online Ticketing System
261
information helps passengers make informed
decisions about route selection and travel time.
4.8 E-Ticketing and Passenger Flow
Data Collection
To expedite boarding and gather accurate passenger
data, we will utilize e-tickets displayed on
smartphones or electronic devices. These e-tickets
will showcase a scannable barcode (e.g., QR code), a
clear Ticket ID, and validity information. Passengers
will present e-tickets for scanning or visual
verification at entry points. Validated tickets grant
access, while invalid one’s trigger alerts. The e-
ticketing system automatically captures passenger ID,
boarding time, and entry point for analysis and route
optimization. This system can be integrated with the
IR sensor-based passenger counting system to
enhance accuracy, validate data, and generate
comprehensive passenger flow reports. The below
table 1 and table 2 shows that the SRT Tools and
Tidel Park stoppings respectively.
5 RESULTS AND DISCUSSION
Table 1: Route Details with Their ETA for Tidel Park
Stopping.
Serial No Route ID
Bus
Sto
p
ETA
0
95
Tidel
Par
k
7 minutes
1
91
Tidel
Par
k
9 minutes
Table 2: Route Details with Their ETA for SRP Tools
Stopping.
Serial
No
Route
ID
Bus Stop ETA
0
102 S.R.P.Too
ls
12 minutes
1
570 S.R.P.Too
ls
10 minutes
2
19 S.R.P.Too
ls
14 minutes
3
95 S.R.P.Too
ls
9 minutes
Logic simulation of minimum ETA if the selected
source has more than one entry with ETA than give
least ETA routes id information and if there is tie or
it mean equal ETA in the database than return the
routeid information based on least value of category
entry among five routes collection than return than
only routeid information field in database if the
selected source has only one (Sharma D. et al.,2016).
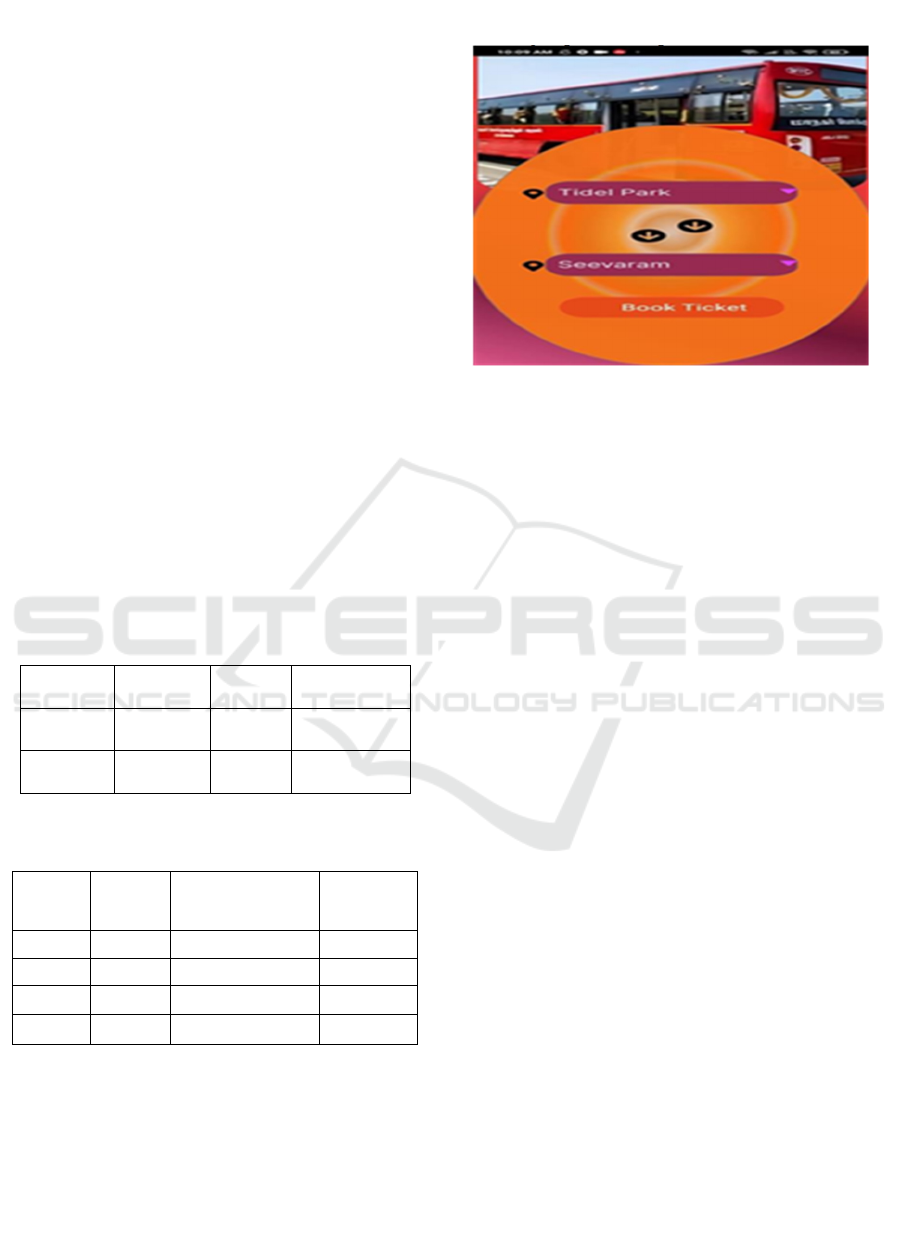
The below figure 2 shows that the journey ticket
booking in public transport.
Figure 2: Journey Ticket Booking in Public Transport.
Decision making of allocating route id for same
ETA for same source on different route id
Example 1:
Source = S.R.P.Tool, ETA"6"
category"1"
source"S.R.P.Tool" route 91 and
another ETA"6"
category"2"
source "S.R.P.Tool" rout95
In this same ETA which the allocation is based on
category which has least value as per logic it is
routeid91 has 1 which is least
Decision making of allocating route id for
difference in wide range of ETA for same source on
different route id
Example 2:
Source ="Kandhanchavadi" ETA"11"
Category"2" 95 routeid
source"Kandhanchavadi"
And another ETA"8"
Category"1" 91 routeid
source "Kandhanchavadi" a
nd
another ETA"58" Category"4" 570 routeid
source "Kandhanchavadi"
The allocation of route id is 91 which has least
ETA 3. Decision making of allocating route id for
selected source has only has single routeid
Example 3:
ICRDICCT‘25 2025 - INTERNATIONAL CONFERENCE ON RESEARCH AND DEVELOPMENT IN INFORMATION,
COMMUNICATION, AND COMPUTING TECHNOLOGIES
262
source=parrys ETA"1"
category "5"102 routeid
source “Parrys" allocated route id is
102
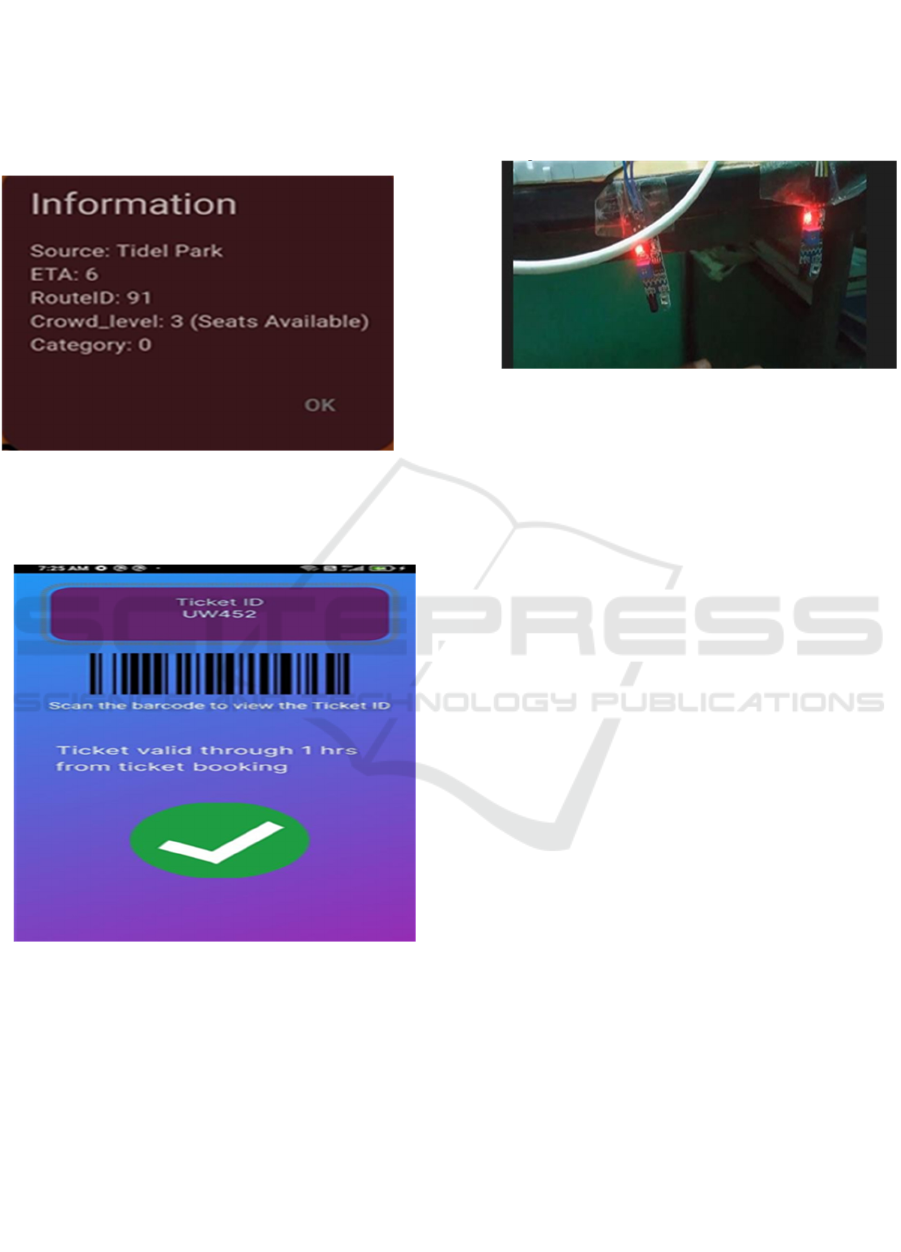
The output of widget displaying ETA, Route ID,
Crowd Level shows in the figure 3
Figure 3: Output for Identification of Crowd Level.
The E_Ticket Display with Ticket ID and Barcode is
shown in this figure 4.
Figure 4: E_Ticket Display with Ticket ID and Barcode.
Accurately classifying crowd density with sensor
data demands meticulous attention to detail. The type
and placement of sensors play a crucial role, with bi-
directional infrared detectors strategically positioned
at entry/exit points offering reliable passenger count
data. Robust algorithms trained on diverse datasets
further enhance accuracy and adaptability. Studies
showcase promising results, with some exceeding
90% accuracy in real-time estimation using sensors
and computer vision. Figure 5 gives the device
activation image.
Nonetheless, there are limitations that must be
addressed. Sensor readings can also suffer from noise
due to passenger behaviors, luggage sizes, and
movement patterns (D. Darsena et al., 2017).
Downtime due to external factors that can hinder the
sensor or disrupt data interpretation like obstacles,
lighting and environmental noise.
Figure 5: Device Activation.
The sensor data mainly shows the number of
passengers in the bus, but lacks information on their
behavior (standing vs. sitting). Additionally,
inaccurate classifications can result for certain
demographics or scenarios due to biases in training
data or algorithm design.
Nonetheless, it is important to note that sensor-
based crowd density classification could still be
extremely valuable if tailored intelligently (Lavanya
S et al., 2017). Following proper sensor selection and
arrangement, using powerful algorithms trained on
abundant and diverse data, and doing everything to
take into main consideration the impact of external
factors and limitations, this can turn out to be a strong
tool to manage public spaces and maximize
efficiency.
6 CONCLUSIONS
Increased convenience and reduced frustration:
Improved bus arrival time estimates (ETAs) allow
better planning and reducing waiting times at bus
stops, creating a better and more predictable travel
experience. Greater comfort and safety: details of
crowd numbers in real time allow passengers to board
less crowded buses, improving comfort and reducing
the risk of safety. Informed travel decisions: Access
to ETA, demand and crowd data allows passengers to
make decisions on which bus to take or a different
mobility option, optimizing their journey. Balanced
system and reduced overcrowding: Allocating routes
according to demand categories (1-5) can lead to a
more balanced system with passenger supply
matching routes capacity to improve efficiency and
An Automated Crowd Management in Public Transport Using Online Ticketing System
263

reduce crowding. IR sensor-based passenger counting
system is assisted with to improve the accuracy of the
system.
Optimized route-planning– Through real-time data,
operators can understand demand per route, thus
deploying buses themselves and efficiently
optimizing operational costs, as well as reducing
congestion. Better resource utilization: Real-time
passenger volume data allow operators to deploy only
those buses that are in demand, preventing empty or
overcrowded vehicles and effective resource
utilization.
Utilizing historical data and real-time data
analysis for strategic decisions (route expansion, fare
changes, and even improving infrastructure)
promotes a data-driven decision-making method of
public transportation management.
6.1 Additional Potential Results
Environmental benefits: Optimization of routes and
reduction of congestion can result in reduced fuel
consumption and lower emissions, therefore leading
to a cleaner environment. More members on the bus:
A more reliable, comfortable, data-driven bus can win
over newcomers, and encourage existing riders to
ride more often, promoting sustainable transport
choices. Increase the public perception: the machine-
centric system which utilize real-time information to
improve travel experience can enhance public’s view
about public transportation, provoking its more
extensive use.
6.2 Limitations
Although our selected model showed promising
results in predicting ETA (bus arrival time), we
believe there can be a better approach. Advancing to
more complex Models such as XGBoost or design
specialized Sequential models such as LSTMs, &
Extending the Data Set further back in time to include
weather patterns & special events are a few of the
ways in which we could hone in more accuracy and
address for corner cases. And while bi-directional
infrared sensors are good for reliable passenger
counts, they also have limitations such as possible
interference and lack of information about individual
behavior. Exploring other technologies, such as
computer vision with depth cameras or radar sensors,
may help create more complex datasets and help with
more nuanced crowd characterization, such as
separating standing from seated passengers. Such
deeper insights can facilitate dynamic capacity
modifications and further ensure enhanced resource
allocation. Our ongoing efforts towards increasing the
accuracy of our model and the most insightful ways
of data collection we can achieve will allow us to
further optimize the performance of our system so
we can provide an even more time- effective and
comfortable experience for end users and public
transport operators.
6.3 Future Work
Our work highlights the promise of real-time data and
automated systems in improving public
transportation experiences. However, continuous
development is crucial to maximize its impact. Here
are key areas for future exploration
6.4 Enhanced ETA Prediction
Advanced Models: Consider the benefits of
integrating XGBoost, LSTMs, or ensemble
approaches to provide a more resistant and precise
arrival time forecast, accommodating unusual cases
and intricate circumstances. Grow Data Sources:
Introduce more periods including climatic patterns,
exceptional events and real-time traffic conditions to
supply a fuller picture about possible delays in a
specific area make model further adaptability. Hyper
parameter tuning: Once the model has been chosen,
hyper parameters for the model should be optimized
and updated over time to maximize performance
against particular conditions within your system.
6.5 Advanced Crowd Characterization
More than a head count: They also can go beyond
just counting passengers by using alternative
technology, such as computer vision coupled with
depth cameras or radar sensors. This would help
collect richer data sets in terms of enhanced crowd
characterization, for example passenger movement
patterns, real-time availability of seats and even
standing vs seated passengers. Granular insight: Use
these richer data sets to develop a better
understanding of crowd behaviour in buses. This
data could also be leveraged to enable dynamic
adjustment with respect to capacity, where resources
are targeted toward specific areas or passengers are
informed via mobile how to avoid congestion and
utilize alternate routes for a smoother journey.
By tackling these constraints and following up on
these exciting future directions, we can further
improve and advance our proposed system. This
will ultimately lead to a more efficient, reliable,
comfortable public transportation experience for all.
ICRDICCT‘25 2025 - INTERNATIONAL CONFERENCE ON RESEARCH AND DEVELOPMENT IN INFORMATION,
COMMUNICATION, AND COMPUTING TECHNOLOGIES
264

REFERENCES
A. Anju, Barath. Maheshwaran, M. R, V. K and K. K. S R,
Sentimental Analysis for E-Commerce Website, 2022
10th International Conference on Emerging Trends in
Engineering and Technology - Signal and Information
Processing (ICETET-SIP- 22), Nagpur, India, 2022, pp.
1-4, doi: 10.1109/ICETET-SI2254415.2022.9791606.
Adithi S, Mahanth Sai M, Dhriti ruth Rajanna, Rekha.N, K
Rishika Ravi, Crowd Management Framework for
Departure Control in Bus Transport Service using
Image Processing, April 2022, Volume 8 Issue 11,
ISSN: 2349-6002 International Journal of Innovative
Research in Technology.
Adline Freeda, R., Sharmila, R.N (2016), A review of bulk
data dissemination protocols for reprogramming in
WSN, ICICES 2016,2016,7518937 International
conference on Information Communication and
Embedded Systems
Correia, A. I. C., Coelho, M. C., & da Silva, S.N. (2014).
Passenger Demand Management in Public Transport
Systems: A Review. Transportation Planning and
Technology, 37(1), 1-21.
D. Darsena et al., Enabling and Emerging Sensing
Technologies for Crowd Management in Public
Transportation Systems: A Review (2017),
Transportation Research Procedia, Volume 25.
Lavanya S. Rani and Gayathri Binu, Smart Information
System for Public Transportation Using IoT (2017),
International Journal of Advanced Research in
Computer Science and Software Engineering, Volume
7, Issue 3.
Li, W., Yang, M., & Liu, Y. (2020). Bus arrival time
prediction with ensemble learning methods.
Transportation Research Part C: Emerging
Technologies, 111, 87-100
Liu, R., Li, S., Sun, L., Li, F., & Sun, Z. (2017). A Multi-
Sensor Approach for Passenger Counting in Public
Buses. IEEE Transactions on Intelligent Transportation
Systems, 18(8), 2277-2288.
Meghana Sarode et al., Automated Crowd Management in
Bus Transport Service (2020), Journal of Intelligent
Transportation Systems, Volume 24, Issue 5.
Mr. Kruthik Gandhi H A, Mr. Jerrin Joy, Dr. Udayabalan
Balasingam, Mr. Manish G Automated Bus Crowd
Management (2023), International Journal for Research
in Engineering Application & Management (IJREAM)
Vol-08, Issue-10, Jan 2023.
Patil, S. A., and Soman, S. S. (2017). Machine Learning for
Intelligent Transportation Systems: A Survey. Artificial
Intelligence Review, 49(1), 105- 138.
Rajaprakash S, Jaishanker N, Chan Bagath Basha, S
Muhuselvan, Athira Jayan, Aswathi A.B, sebastian,
Ginu, RBJ20 Cryptography Algorithm for Securing Big
Data Communication Using Wireless Networks,
Lecture Notes in Networks and Systems, Volume 334,
Pages 499 - 5072022 5th World Conference on Smart
Trends in Systems, Security and Sustainability, WS4
2021Virtual, Online29 July 2021.
S. Muthuselvan, and SomaSundaram K, A survey of
sequence patterns in data mining techniques,
International Journal of Applied Engineering Research,
Volume 10, Issue 1, Pages 1807 - 1815, 2015.
S. Rajaprakash, C. Bagath Basha, S. Muthuselvan,
Jaisankar N, Ravi Pratap Singh, RBJ25 cryptography
algorithm for securing big data, Journal of Physics:
Conference Series, Volume 1706, Issue 122 December
2020.
Sharma D. et al., A Review on Technological Advanceme
nts in Crowd Management System (2016), Internation
al Journal of Computer Applications, Volume 136,
Issue 1.
Sri Sindhuja Selvanayaki P, Yuvaraj N, An Extensive
Survey on IoT Architecture & Machine Learning
Algorithms for Crowd Detection in Public
Transportation (2016), International Journal for
Scientific Research & Development, Vol. 6, Issue 01,
2018.
Ved Prakash Mishra, Amna Rafi Chaudhry, Kajal Shah
Surname, Model for Crowd Distribution in Public
Transport Buses, ISSN: 2278-3075, Volume-8, Issue-
7C2, May 2019 International Journal of Innovative
Technology and Exploring Engineering (IJITEE)
Yu, B., Yang, Z., Yao, J., 2010. Genetic algorithm for bus
frequency optimization. Journal of Transportation
Engineering 136, 576-583.
Zhang, S., Li, J., Yang, Y., & Wang, Y. (2021). An efficient
bus route optimization algorithm based on dynamic
programming. IEEE Transactions on Intelligent
Transportation Systems, 22(10), 6405- 6415.
Zhang, Y., Li, Z., Yang, L., Lv, Y., & Chen, X. (2018).
Real-Time Bus Arrival Time Prediction with Bus
Bunching Consideration. IEEE Transactions on
Intelligent Transportation Systems, 19(11), 3392- 3402.
An Automated Crowd Management in Public Transport Using Online Ticketing System
265
