
Explainable AI Models for Adult Autism Detection and
Interpretation
S. Amudha, Yashwanth Addakula and Vamsi Ravi
Department of Computational Intelligence, Faculty of Engineering and Technology, SRM Institute of Science and
Technology, Chennai, Tamil Nadu, India
Keywords: Autism, Explainable-AI, Decision Tree, Random Forest, SVM, Logistic Regression, KNN, Naïve Bayes,
SHAP, Lime.
Abstract: This research proposes the use of Explainable Artificial Intelligence (XAI) for detecting autism in adults
despite the difficulties faced in making a diagnosis of autism spectrum disorders (ASD) in this group of
individuals. Using a model that allows understanding the reasons for machine learning output, the study
utilizes a range of behavioral, cognitive, and even physiological markers to detect the feature of autism while
making sure the predictions made through the use of XAI, for example them being SHAP or LIME, are
straightforward and self-explanatory. Such a provision improves understanding of the results and the reasons
for making the diagnosis; which in turn fosters trust and facilitates interventions at the appropriate level and
time among the caregivers. An incorporation of cutting-edge technologies and XAI provides diagnosis with
precision and ease hence the process is not only multilevel but also clear. In conclusion, this model enhances
autism assessment and interventions for adults with ASD, laying the groundwork essential for the
compassionate and intelligent application of AI to medicine for the benefit of both healthcare professionals,
and those diagnosed with ASD.
1 INTRODUCTION
A lifetime neurodevelopmental disorder known as
autism spectrum disorder (ASD) has a substantial
impact on a person's capacity for social interaction,
communication and conduct patterns. Improving the
quality of life for people with ASD requires early
diagnosis and intervention. However, the subtlety and
complexity of the symptoms make diagnosing autism
in adults very difficult, frequently resulting in an
incorrect or underdiagnosed diagnosis.
This research addresses this critical gap by
pioneering an innovative approach to autism
detection in adults using Explainable Artificial
Intelligence (XAI). While machine learning models
have shown promise in diagnosing ASD, their
application in the clinical context has been limited by
the lack of interpretability. Understanding the
decisions made by these models is crucial for
clinicians, caregivers, and individuals themselves,
ensuring trust and facilitating informed decisions.
Explainable Artificial Intelligence (XAI)
applications for the diagnosis in adults has become
more sophisticated and has gained traction as research
continues to progress. Because adult ASD is
complicated and multidimensional, diagnosis and
detection of the disorder can be challenging. To
overcome these issues, a more sophisticated approach
that makes use of technological breakthroughs is
required.
To conclude, the use of explainable AI in adult
autism diagnosis represents a constructive pathway
towards improved accuracy and understanding in
medicine. Explainable AI refers to the ability of AI
models to generate intelligible nature of outputs that
provides insights into the reasoning process leading
to the discovery made by the models. Manual
evaluation of a wealth of behavioural, linguistic, and
cognitive data can help improve adult autism
diagnosis through explainable AI techniques.
Applications: Application areas are described below
in Figure 1 Explainable AI gives a multidimensional
approach in the field of autism detection. It draws on
various data sources, such as cognitive tests,
linguistic use, behavioural patterns, and physiological
markers. Recognizing the complexity of such data,
we can improve the accuracy of diagnostic
interpretation by employing machine learning models
Amudha, S., Addakula, Y. and Ravi, V.
Explainable AI Models for Adult Autism Detection and Interpretation.
DOI: 10.5220/0013925900004919
Paper published under CC license (CC BY-NC-ND 4.0)
In Proceedings of the 1st International Conference on Research and Development in Information, Communication, and Computing Technologies (ICRDICCT‘25 2025) - Volume 5, pages
243-258
ISBN: 978-989-758-777-1
Proceedings Copyright © 2026 by SCITEPRESS – Science and Technology Publications, Lda.
243

(i.e., models that learn from inputs to output a result)
trained on those data to show trends and variations
humans cannot see. Evaluate variety of datasets
when you apply explainable Ais for adult autism
diagnosis This can include unstructured data - text,
audio, and visual information - as well as organized
clinical data, allowing for a comprehensive analysis
of a person’s characteristics and conduct.
Moreover, computer vision further expands XAI
approaches to capture and analyze relevant non-
verbal cues such as body language and facial
expressions. XAI framework is shown in Figure 1.
This kind of analysis provides better evidence of
behavioural traits thanks to insights into emotional
responses to stimulus, sensitivity to sensory input,
and difficulties with social interaction.
Figure 1: Explainable AI Frameworks.
Leveraging XAI technology, we are building
interpretable and explainable models for autism risk
in adults. Our approach combines advanced
algorithms with human interpretation using a deep
and rich data set that spans personality characteristics,
health related factors, and medical history. By
making use of LIME (Local Interpretable Model
Independent Explanation) and SHAP (SHapley
Additive Explanation) on results, we can provide a
human readable explanation for each prediction,
providing specific features suggesting the diagnosis.
This work not only represents a significant step
forward in the detection of autism but also has huge
ramifications for healthcare practice by improving
diagnostic accuracy and transparency. AI tools that
are interpretable will enhance the ability of the
clinician and caregiver to accurately detect and
diagnose adults with autism in a timely manner
allowing them to develop interventions and
enhancements to improve their daily living. This
technique will not only transform the lives of people
with autism, but it is also a tremendous example of
the intersection of technology and healthcare - a
clean, smart approach to caring for autism that is
personal, caring and effective.
2 MOTIVATION
The subtlety of the signs and the complicated pathway
of the process leads to a substantial gap of adults
diagnosed with autism spectrum disorder, in spite of
improvement in understanding of autism spectrum
disorder. As a result, many people continue to be
undiagnosed or misdiagnosed, resulting in inadequate
support and intervention.
This lengthy issue can be addressed by
Explainable Artificial Intelligence (XAI). The
profound influence that autism can have on an
individual and their family's daily functionality serves
as the motivation for utilizing XAI techniques during
autism screening. By building an interpretable
machine learning model, we hope to offer not only
correct diagnoses, but also understandable
explanations for the diagnoses.
This project aims to provide you, the clinician,
caregiver, and individual themselves, with a tool that
will help demystify the autism diagnostic process
while providing you with an initial assessment of the
individual. Not only does XAI's transparency
engender trust in machine learning algorithms, it also
promotes greater insight into the disorder by all parties
involved.
In addition to this, this research is a part of a
bigger perspective to specifically merge future
technology with humanistic caring. With the goal of
improving the diagnostic process using XAI, we hope
to pave the way for a future where timely and tailored
treatment is provided to all individuals on the
spectrum, particularly adults.
3 LITERATURE SURVEY
In recent years, many research endeavors have been
carried out to understand the benefit of identifying
individuals with Autism as early as possible. In an
article by Raj et al. investigating the forecasting of
ASD using machine learning approaches the authors
used three publicly available non clinical databases in
ICRDICCT‘25 2025 - INTERNATIONAL CONFERENCE ON RESEARCH AND DEVELOPMENT IN INFORMATION,
COMMUNICATION, AND COMPUTING TECHNOLOGIES
244

their study. After looking into the results of applying
multiple machine learning techniques, it was revealed
that the utmost performing machine learning
technique, the Convolutional Neural Network (CNN),
was able to perform the most accurate prediction of
autism spectrum disorder in adults, children, and
adolescents at 99.53%, 98.30%, and 96.88% accuracy.
Hence, different modeling approaches, less time
consuming than conventional ones, suitable for
persons with ASD at any stage of development and
throughout their lives have been proposed by Omar et
al. . A hybrid method of Random Forest-CART
Classification and Regression Tree and Random
Forest-ID3 Iterative Dichotomiser-3 was tested on
AQ10 and 250 clinical databases. The accuracy in
prediction for children, adolescents and adults was
92.26%, 93.78% and 97.10%, respectively. Sadiq et
al., analyzed the acoustic records of thirty-three ASD
diagnosed children over several consultations of a
doctor with them. R2 performance measure in this
ablative study significantly improved due to their use
of speaker diarization patterns and LSTM networks.
Yet still it can be regarded as preliminary stage
since there is more to do to elaborate a plan
guaranteeing replicable and reliable outcomes for
utmost clarity and understanding. Crippa et al. used
Support Vector Machine (SVM) in the datasets
collected from 15 ASDs toddlers and 15 hyperactive
adolescents to assess how the upper limb movement
can assist in identifying ASD. Kinematic analysis
method was classified with 96.% accuracy.
According to Liu et al. Garside et al.studied machine
learning techniques. kNeighbors andSupport Vector
Machine achieved the best accuracy with 99.1% and
94.6% results for individuals and groups respectively.
Fadi Thabtah et al. proposed an ASD diagnostic
method using DSM5 and modified technology. Use
assessment tools to achieve one or more goals of ASD
screening. In this study, researchers present the
advantages and disadvantages of a machine learning
classification of ASD. The researchers used the
DSMIV rather than the DSM5 manual to illustrate the
problems with the use and consistency of existing
ASD diagnoses. Like B, A used a separate machine
learning method. Sharma, J. Meng, S. Puruswalkam,
E. Gowen (2017) et al.
Identify adults with autism through app. This
study aims to investigate important issues related to
kinematic properties and isolation settings. The
sample included 16 ASC participants with various
hand movements. In this case, 40 kinematic
parameters were extracted from 8 simulation
environments using machine learning. This study
demonstrates that using machine learning to analyze
highdimensional data and diagnose autism is possible
with some models. RIPPER’s requirements have the
following properties: “no choice”, Va (87.30%), CHI
(80.95%), IG (80.95%), social (84.13%), and CFS
(84.13%)., Vaishali R, Sasikala R, et al. proposed a
method for autism diagnosis. In this study, a crowd
intelligence based binary firefly feature selection
wrapper was tested using an ASD diagnostic dataset
containing 21 features, all from the UCI machine
learning library. Based on the hypothesis testing,
machine learning models can improve the
classification accuracy by using as few points as
possible. The study found that 10 out of 21 features
in the ASD data were sufficient to distinguish ASD
patients from those without using a singlepurpose
crowd intelligence based binary firefly feature
selection framework. The results obtained with this
approach prove the hypothesis by obtaining the best
feature subset with approximately the average
accuracy derived from the entire autism spectrum
disorder diagnostic dataset. The average accuracy
ranged from 92.12% to 97.95%.
In we solve the machine learning problem with a
two-step approach. First, we train a deep learning
model to identify infants’ behavioral outcomes in the
context of interactions with parents or therapists. We
report the following results for character
classification using two methods: image models and
character face models. Our smile accuracy reaches
70%, face recognition accuracy reaches 68%, object
detection accuracy reaches 67%, and voice accuracy
reaches 53%. Identification of autism spectrum
disorder (ASD) brains in the literature. This project
uses neural networks to identify individuals with
ASD and the general population. It uses a subtraction
technique to define ROIs. The task was rated as
accurate with 95% accuracy in identifying ASD
patients. This research paper focuses on the use of
machine learning algorithms to predict ASD and
understand the importance of early diagnosis for
effective intervention. Although autism spectrum
disorder (ASD) is often diagnosed in childhood, the
difficulty of diagnosis increases during adolescence
and adulthood, making diagnosis more difficult. In
this study, we analyze general information including
behavioral features and use vector machines, logistic
regression, random forests, XGBoost, and multilayer
perceptrons to develop predictive models. Evaluate
the models using key performance indicators through
rigorous training and validation of the datasets. The
results show how accurate the ASD prediction is and
highlight the potential of machine learning to aid in
early detection.
Explainable AI Models for Adult Autism Detection and Interpretation
245
This paper uses a convolutional neural network
[CNN] to classify facial images into two groups, ASD
images and normal images, which helps us identify
young children with ASD. The problem can be
quickly corrected before autism spectrum disorder
(ASD) is diagnosed and treated to improve the social
and behavioral problems of these children. This
research uses the dataset from the Kaggle website
with a training and testing ratio of 70:30. Finally, the
accuracy of the neural network-based model reached
91%, and the loss rate was determined as 0.53. We
researched and developed software for the treatment
of Romanian children with a family history of autism
spectrum disorder (ASD). We follow the Double
Diamond Model, which emphasizes the core
principles of Human-Centered Design (HCD)
software development by focusing on the unique
needs of end users. This includes creating prototypes,
wireframes, and interactive templates, exploring new
technologies, and incorporating input from ABA
practitioners.
We conducted a multi-level study in medical
facilities that included various targeted activities
targeting the social-emotional development of
children. We found many results that showed various
differences in mental health, such as different types
of autism, co-occurrence of ADHD, language skills
and age groups, and different populations. The main
findings are: 1) The severity of the ASD form does
not predict the outcome of the intervention, but the
combination of ADHD and LFA diagnosis may affect
smiling; Cooperation and less pressure, while the
emotions of nonverbal children with instructions are
increased; Make contact and eye contact with the
robot.
Bhavya
et.al., (2024) This study investigated
the benefits of robot-assisted cognitive training
(RACT) for children with autism. The increasing
prevalence of autism spectrum disorder (ASD) and its
impact on brain development still make new
approaches such as RACT useful. The research
approach is comprehensive and combines various
cognitive techniques with dynamic robotics. After the
intervention, both quantitative and qualitative
measures of intelligence improved significantly.
Autism Artificial Intelligence Performance Analysis (2023)
tried to evaluate the performance of the product using
different factors such as accuracy, precision, recall
and F1 score. Also, the analysis of the values is useful
for understanding the important factors contributing
to the decision-making process. The results of this
study contribute to the expansion of the use of
machine learning techniques for assessing the risk of
autism. These results provide promising tools for
early intervention and clinical intervention. The
results are preliminary but show the potential of VR
technology to be incorporated into autism treatment.
Se-WoongPark, Annie Cardinaux, Deena Crozier, Marta
Russo. (2024)
The aim of this study is to use the main features,
create a prediction algorithm using machine learning,
and find the best classifier that will provide results
closest to clinical results. The proposed method
focuses on the use of predictive tests to select
problematic features in the early detection of
diabetes.
4 DATASETS
ASD (autism spectrum disorder) can be diagnosed
and categorized in people using the traits and
attributes included in the "Autism Screening in
Adults" dataset. A summary of the dataset's columns
is provided below:
A1_Score through A10_Score: The scores for
each of the ten questions or statements pertaining to
autism screening are shown in these columns.
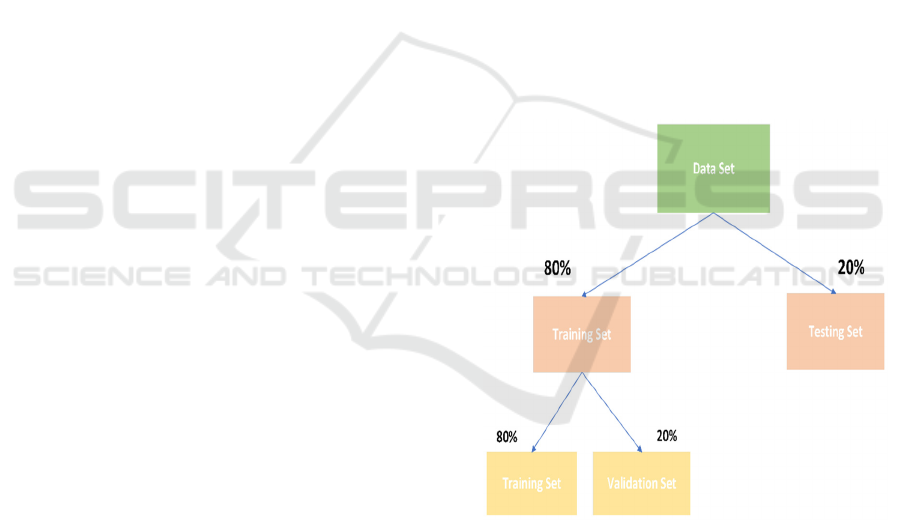
Figure 2: Dataset Split.
Figure 2 explains Dataset Split into Training,
Validation, and Testing Sets.
• Age: The person's actual age.
• Gender: The person's gender (for example,
"m" for male and "f" for female).
• Ethnicity: An individual's racial or ethnic
heritage.
• Jaundice: Denotes the presence of jaundice, a
deposit of bilirubin that causes a yellowish tint
to the skin and whites of the eyes.
ICRDICCT‘25 2025 - INTERNATIONAL CONFERENCE ON RESEARCH AND DEVELOPMENT IN INFORMATION,
COMMUNICATION, AND COMPUTING TECHNOLOGIES
246

• Autism: Denotes if the individual has ever
received an autism diagnosis.
• Country_of_res: The person's native.
• Previously_used: Indicates whether the user
has used the app to check their mental health
before
• Result: The total score (A1_Score to
A10_Score) derived from the responses to the
ten questions.
• Age_desc: An explanation of the person's age.
• Relation: Indicates the respondent's identity
(e.g., "Self" or other).
• Class/ASD: This indicates if the user was
classed as having autism ("1") or not ("0") by
the app.
• Table 1 indicates the AQ-10 Test Questions:
Table 1: Screening. ASD Screening Questions and their Descriptions.
Question Description
A1 Score I frequently sense tiny noises while many do not.
A2 score
When I read a story, it’s hard for me to describe the passion of the
characters.
A3 score When someone is speaking to me, I can "read through the lines" with ease.
A4 score In general, I focus more on the big picture than the specifics.
A5 score I'm able to sense when someone becomes disinterested in what I'm saying.
A6 score I find multitasking effortless.
A7 score
I can tell a lot about someone's thoughts and emotions simply by staring at
thei
r
face.
A8 score I can immediately return to what I was doing if there's an interruption.
A9 score I enjoy gathering data on many sorts of objects.
A10 score Determining the intentions of individuals is a challenge for me.
Table 2: Datasets Summary.
Sr. No Dataset Name Sources Attribute Type No. of Attributes
No of
Instances
1
ASD
Screening
Data for
Adolescen
t
UCI Machine
Learning Repository
Fadi Fayez Thabtah
(2017)
Categorical,
Continuous and binary
21 104
2
ASD
Screening
Data for
Adults
UCI Machine
Learning Repository
Fadi Fayez Thabtah
(2017)
Categorical,
Continuous and binary
21 704
3
ASD
Screening
Data for
Children
UCI Machine
Learning Repository
Fadi Fayez Thabtah
(2017)
Categorical,
Continuous and binary
21 292
Table 2 explains Summary of ASD Screening
Datasets and Their Attributes
5 DATA PREPROCESSING
The process of cleaning, formatting, and occasionally
even rearranging data before it is utilized is referred
as preprocessing. Unfortunately, this dataset contains
a significant number of invalid or missing records.
Furthermore, a few characteristics of particular
aspects must be modified. This has a significant
impact on the performance and predictive power of
almost all learning algorithms.
The data set has a significant number of missing
values. I make sure not to bias the data in any way
before I merely eliminate every row with missing
data. Stated differently, we must ensure that there is
no apparent association between the type of data and
the missing fields. If so, I would make an effort to go
back and complete that information. I remove missing
data from the rows since it appears to be dispersed
randomly. If we could have filled in the median
values for "NaN" rather of removing them, but that is
a little more difficult in this case because I have a
number of categorical columns that contain "NaN".
In order to guarantee that the data is clean,
appropriately organised, and prepared for use in
training machine learning models, the "Explainable
Explainable AI Models for Adult Autism Detection and Interpretation
247
AI Technique for Adult Autism Detection and
Interpretation" requires a number of critical
procedures in data preprocessing. The basic processes
for preparing data are as follows:
5.1 Data Collection
Acquire pertinent datasets about adult autism; these
may include behavioural observations, data from
neuroimaging, genetic information, medical history,
and other relevant characteristics.
5.2 Data Cleaning
Handle Missing or Null Values: Delete records,
perform column-wise removal when necessary, or
imputation (which substitutes statistical estimates for
missing values) as a means of handling null or
missing values.
Remove duplicates: If there are any duplicate
entries in the dataset, make sure to find and remove
them. Address inconsistencies: Identify
inconsistencies and fix them by standardising data
values and formats for the dataset as a whole.
5.3 Data Integration
When combining disparate datasets or sources, make
sure the resulting dataset is compatible and
consistent.
5.4 Feature Selection
Pick pertinent features that are crucial for identifying
autism. This could entail using statistical analysis,
domain expertise, or feature selection methods such
as information gain, correlation analysis, or model-
based feature importance.
5.5 Encoding Categorical Data
To make categorical data usable transform it into
numerical form using methods like one-hot encoding
or label encoding.
5.6 Feature Scaling
To get numerical features on a similar scale,
normalise or standardise them. One can use methods
such as Z-score normalisation or Min-Max scaling.
5.7 Handling Imbalanced Data (if
Applicable)
Take care of any class imbalance problems by using
methods such as Synthetic Minority Over-sampling
Technique or oversampling the minority class or
under sampling the majority class.
5.8 Data Splitting
Split the dataset into train, validation, and test sets to
train and evaluate the performance. Proportions such
as 70-15-15 or 80-10-10 are commonly employed for
training, validation, and testing.
5.9 Data Transformation
Add more transformations based on the needs of the
models being used and the characteristics of the data.
For example, sequence padding for textual data or
normalization of photographic data may be required.
5.10 Exploratory Data Analysis (EDA)
Use EDA to find out how the data are distributed, how
features are correlated, and whether any outliers
require extra attention. To guarantee that the data is
suitably prepared for training and validating models
for adult autism detection using explainable AI
techniques, each of these steps is essential.
Depending on the features and makeup of the
available dataset, the particular strategy may change.
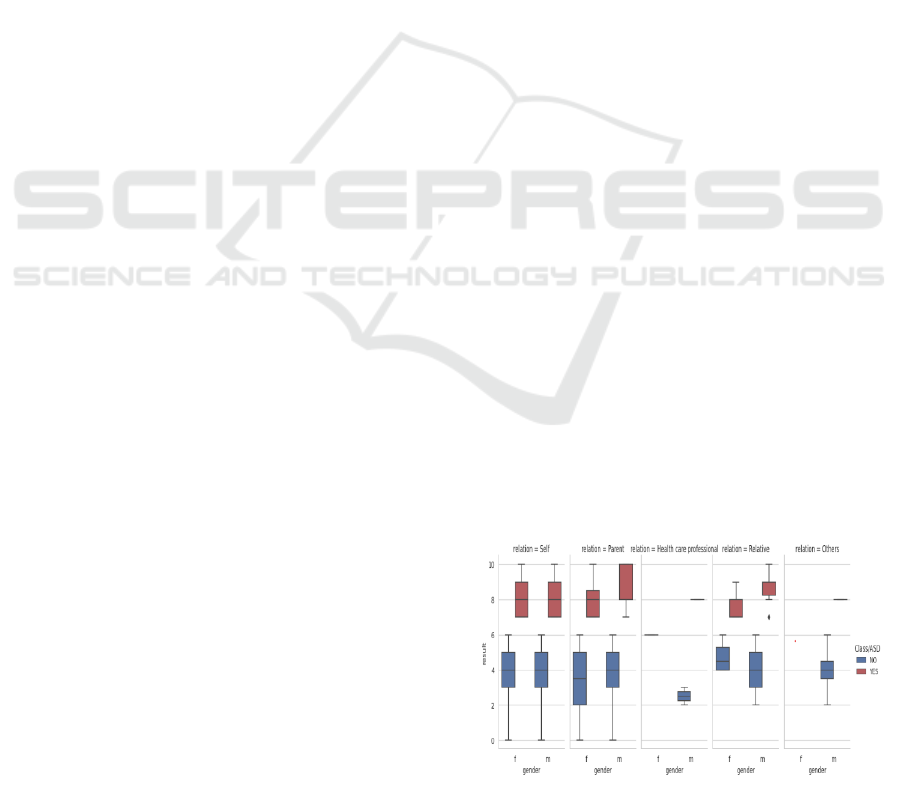
Figure 3 - Box plots illustrating the distribution of
the "result" variable across the categories of "gender,"
"Class/ASD," and "relation" will be displayed in the
final plot. The median, quartiles, and outliers of the
"result" variable for each category combination are
shown in the boxes. Separate columns are made for
each distinct value in the "relation" variable, and
color are used to distinguish between the "YES" and
"NO" categories of the "Class/ASD" variable.
Figure 3: Boxplots.
ICRDICCT‘25 2025 - INTERNATIONAL CONFERENCE ON RESEARCH AND DEVELOPMENT IN INFORMATION,
COMMUNICATION, AND COMPUTING TECHNOLOGIES
248
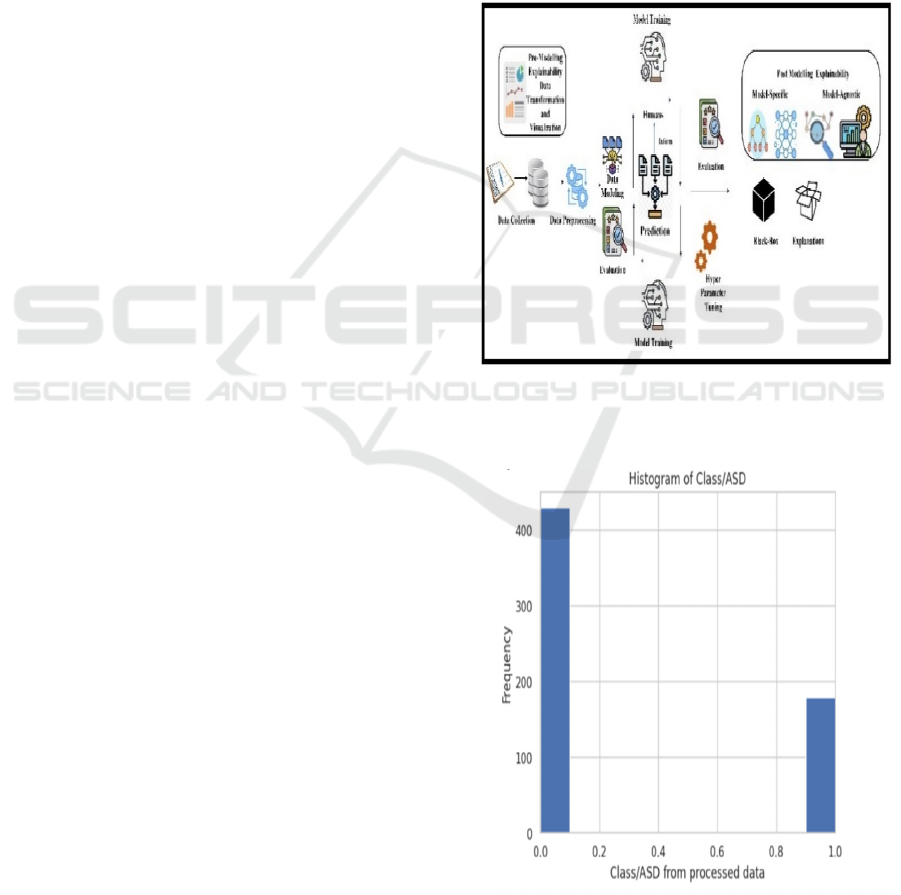
Figure 3 explains Box Plot of ASD Screening Results
by Gender and Relation Type.
6 PROPOSED METHODOLOGY
6.1 Data Collection and Pre-processing
The methodology will start with gathering
information from a variety of sources that are
pertinent to adult autism, such as medical records,
behavioural observations, neuroimaging, and genetic
markers. The gathered data will go through a detailed
preprocessing process that consists addressing
imbalanced data if it exists, integrating datasets,
removing duplicates, encoding categorical data,
scaling numerical features, and handling missing
values. The goal of preprocessing is to guarantee the
accuracy, consistency, and preparedness of data for
further analysis.
6.2 Feature Engineering and Selection
Following data cleansing, feature engineering and
selection will be a crucial stage. This entails
determining and picking the traits that are most
important for adult autism detection. Finding the most
important features will be made easier with the help
of statistical analysis, domain expertise, and feature
importance techniques. To enhance model
performance, transformations and derived features
might also be considered.
6.3 Selection of Machine Learning
Models
A range of models will be investigated, taking into
account both sophisticated deep learning
architectures and conventional machine learning
algorithms. The suitability of several algorithms for
detecting adult ASDs will be assessed, including
Naive Bayes, random forests, logistic regression,
KNN (K-Nearest Neighbour), support vector
machines, neural networks, and more. The models
selected will give priority to interpretability while
maintaining accuracy.
6.4 Applying Explainable AI
Techniques
Explainable AI techniques will be added to the
chosen models. These could be Shapley Additive
Explanations (SHAP), Local Interpretable Model-
agnostic Explanations (LIME), attention
mechanisms, decision rules, or other interpretable
techniques designed specifically for the identification
of ASD in adults.
6.5 Model Training and Validation
Using a portion of the pre-processed data, the selected
models will be trained and validated through the
integration of explainable AI techniques.
Performance metrics, interpretability metrics, and the
model's capacity to produce intelligible and useful
insights will all be closely monitored.
Figure 4: Proposed Architecture.
Figure 4: Explains the proposed architecture of the
study.
Figure 5: Histogram of class/ASD.
Explainable AI Models for Adult Autism Detection and Interpretation
249
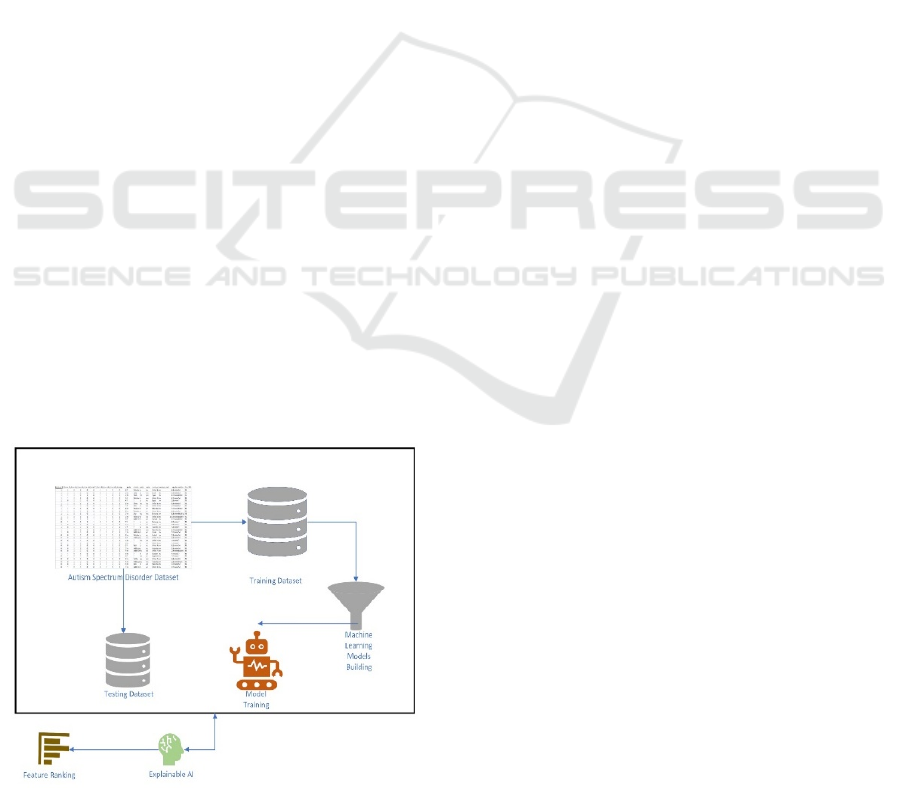
Figure 5 explains Histogram of ASD Class
Distribution in Processed Data.
6.6 Evaluation of Interpretability
A thorough analysis of the model's interpretability
will be carried out. In order to guarantee that the AI
models can produce results that are understandable
and unambiguous for healthcare professionals and
other stakeholders involved in the diagnosis of adult
ASD, this evaluation will take into account visual
explanations, feature importance, and model
explanations.
6.7 Validation and Ethical
Considerations
The suggested methodology will be examined to
make sure it complies with all legal requirements and
is fair and transparent. To make sure the model
complies with the ethical norms and guidelines of
responsible AI, it will be verified against them.
6.8 Testing and Fine-Tuning
A different dataset that was not used for training or
validation will be used to test the developed models.
Testing outcomes and user feedback will be used to
inform optimisation and fine-tuning.
6.9 Integration of Case Studies
Through the incorporation of case studies involving
real adult ASD diagnoses, the methodology will be
validated and improved. This real-world application
will enable the methodology to be improved and
evaluated for efficacy in real-world situations.
Figure 6: ML Pipeline.
The objective of this suggested approach is to
create explainable AI models for adult autism
detection, guaranteeing predictability and
explainability in decision-making for medical
professionals and other stakeholders involved in the
diagnosis and interpretation of ASD.
Figure 6 explains Machine Learning Pipeline for
Autism Spectrum Disorder Prediction.
6.10 Decision Trees
Decision trees are popular and easy-to-use machine
learning techniques for applications involving
retrieval and classification. They work by assigning a
label or value to each region that makes the site
unique. In a tree model, features are represented by
nodes, decision rules by branches, and values by
leaves.
Here is a summary and explanation of decision trees
6.10.1 Decision Tree Organization
Nodes:
• Root Node:The first node at the top of the
tree (called the root node) represents the
entire data set.
• Internal Nodes: Nodes that represent
features and decision rules but are not the
root node are called internal nodes.
• Leaf Nodes: Terminal nodes that indicate
the result, such as a numerical value in
regression or a class label in classification.
6.10.2 How Decision Tree works
• Feature Selection: The optimal characteristic
for dividing the data into different classes or
values is chosen by the algorithm. It
accomplishes this by analysing different
splitting criteria (e.g., mean squared error
reduction for regression, or Gini impurity or
information gain for classification).
• Splitting: The dataset is split into subgroups
according to the values of each selected
feature. Recursively, this procedure
generates branches and nodes until a halting
condition is satisfied, like reaching a
maximum tree depth or the point at which
more splits don't yield much more
information.
• Prediction: Upon adding a new data point to
the tree, it moves along its branches
according to the feature values until it
ICRDICCT‘25 2025 - INTERNATIONAL CONFERENCE ON RESEARCH AND DEVELOPMENT IN INFORMATION,
COMMUNICATION, AND COMPUTING TECHNOLOGIES
250

reaches a leaf node, which presents the
anticipated result.
6.10.3 Equations Used in Decision Trees
Gini Impurity (for Classification): Gini impurity
measures the impurity or the randomness of a dataset.
For a node with multiple classes, the Gini impurity is
calculated as:
𝐺𝑎𝑖𝑛
(
𝑆
)
=1−
∑
(𝑝
)
(1)
Where:
• S is the dataset at a particular location.
• C is the number of classes.
• 𝑝
is the probability of class i in the node.
Information Gain (for Classification):
Information gain helps to decide which feature to split
on. It measures the decrease in entropy or impurity
after data is separated from certain features. Entropy
is given by
𝐸𝑛𝑡𝑜𝑝𝑦
(
𝑆
)
=−
∑
𝑝
log
𝑝
(2)
• S is the dataset located at a specific node.
• C is the number of classes.
• 𝑝
is the probability of class i in the node.
Mean Squared Error (for Regression):
For regression tasks, Decision Trees often use mean
squared error (MSE) as criterion to make decisions
about feature splits. The mean squared error for a
node is calculated as:
𝑀𝑆𝐸 =
∑
(𝑦
−𝑦
)
(3)
Where:
• The node's sample count is denoted by N.
• For the ith sample, the target value is y_(i).
• The mean goal value for each sample in the node is
denoted by y_ (1).
6.11 Random Forest
During training, Random Forest creates many
decision trees as part of its ensemble learning process,
and it outputs the class or mean forecast of each tree.
It is applied to jobs involving both regression and
classification.
The main idea behind random forests is to add
randomness to the modeling process to create
different types of decision trees, which are then
combined to increase accuracy and reduce overfitting.
6.11.1 Complete Information Regarding
Random Forest
• Bootstrapping (Bagging): Using a technique
called bootstrapping, Random Forest creates
many subsets of the original dataset using random
replacement sampling.
• Various decision trees are trained using these
subsets.
• Random feature selection: A random set of
featuresis selected from each decision tree to
select the bestclassifier. By introducing variation,
this approach makes sure that no two trees are
constructed using the same collection of features.
• Combining Predictions: After all the decision
trees are built, Random Forest uses the average of
each tree's predictions for regression tasks and
majority vote to aggregate the predictions for
classification tasks.
6.11.2 Metrics Used in Random Forest
Random forests are collection of decision trees. Since
the building block of a random forest is a
collection of specific trees, the essential equations or
principles involved are the same as those found in
decision trees.
• Gini Impurity or Information Gain (for
Classification): To determine which split in each
tree is the best, Random Forest can apply the Gini
impurity and Information Gain formulas used in
decision trees.
• Mean Squared Error (for Regression): Each tree
in a Random Forest uses the same Mean Squared
Error (MSE) formula that is used in decision
trees for regression problems.
• Aggregation: The most frequent class prediction,
or mode, the result of each tree is selected as the
final prediction for classification. The final
output of the regression is the average of all
prediction trees.
6.11.3 Random Forest Training Process
Random Sampling: A random sample of the data is
drawn with replacement for every tree that needs to
be constructed in the forest (bootstrapping).
Feature_ Randomness: At each point in the tree, only
a random subset of features is considered for
classification. Hence, trees cannot be related.
Growing Trees: Using the splitting criteria (Gini
impurity, Information Gain, or MSE), trees are built
using the chosen subset of data and features.
Explainable AI Models for Adult Autism Detection and Interpretation
251

Combining Predictions: Combining the predicted
outcomes from each source gives the final prediction
from each tree after all trees have been trained.
6.11.4 Advantages of Random Forest
• High Accuracy: The ensemble of diverse trees
in Random Forest typically yields high
accuracy.
• Reduced Overfitting: Overfitting can be
avoided by adding randomness to the feature
selection process as well as the data.
• Effectively Handles Missing Values: It has the
ability to handle missing values.
• Estimation of Feature Importance: Random
Forest is capable of estimating the significance
of features in a given classification or
regression task.
• The count of trees, the highest tree depth, and
the quantity of elements to consider at
• at each split are just a few of the parameters
that can be used to modify the flexible
Random Forest algorithm. This adaptability
makes it possible to regulate the model's
performance and complexity.
6.12 Support Vector Machine
Support vector machine (SVM) is a powerful
machine learning technique that can be used to solve
regression and classification problems. The main goal
of classification is to determine the hyperplane that
best divides the points into separate classes and to
ensure the separation of the classes.
6.12.1 Key Concepts of Support Vector
Machines
• Hyperplane: The decision boundary dividing
classes in the feature space is referred to as the
"hyperplane" in support vector machines
(SVM). This is a line in two dimensions; it is
a plane or higher-dimensional construct in
higher dimensions.
• Support Vectors: These data points are crucial
for determining the decision boundary
because they are closest to the hyperplane. It
has a direct effect on the orientation and
position of the points.
• Margin: The margin is the space, or distance,
that separates the support vectors from the
hyperplane. Finding the hyperplane that
maximizes this margin is the aim of SVM.
• Kernel Trick: SVM can effectively handle
non-linear data and make it linearly separable.
Sigmoid, Gaussian RBF, polynomial, and
linear functions are examples of common
kernel functions.
6.12.2 Comprehensive Details Regarding
SVM
• Maximizing Margin:
Support vector machines (SVMs) aim to find
planes that minimize dispersion and maximize
margin. It selects the hyperplane that best
divides data points into groups to maximize
the distance (leaf) between the hyperplane and
the closest points.
• Cost Function (C):
In SVM, the balance between reducing
classification error and increasing margin is
represented by the cost parameter (C). While a
lower C value increases the margin but may
result in misclassified points, a higher C value
permits a smaller margin but fewer
classification errors.
• Kernel Trick:
The kernel process allows the data to be
passed to the next level. The estimates from
each source are combined to create the final
estimate. The SVM processes the unallocated
data. At higher altitudes, this change helps find
grid hyperplane
• Mathematical Formulation:
𝑚𝑖𝑛
,
|
|
𝑤
|
|
(4)
This equation minimizes the magnitude of the
weight vector w to maximize the margin between
classes in a Support Vector Machine (SVM).
Subject to: 𝑦
(𝑤 × 𝑥
+𝑏)≥1
Where:
W is the weight vector.
B is the bias term.
𝑥
represents the input feature vectors.
∅ is the mapping function.
𝑦
represents the class label.
6.12.3 SVM’S Advantages
• SVM benefits include its effectiveness in
high-dimensional spaces.
• Because of the kernel trick for handling non-
linear data, it is versatile.
• The regularization parameter aids in
preventing overfitting.
ICRDICCT‘25 2025 - INTERNATIONAL CONFERENCE ON RESEARCH AND DEVELOPMENT IN INFORMATION,
COMMUNICATION, AND COMPUTING TECHNOLOGIES
252

• Able to perform both regression and
classification tasks.
6.12.4 SVM's limitations
• Computationally demanding.
• Difficulty in choosing the right kernel.
• sensitive to regularization parameter and
kernel selection.
6.13 K-Nearest Neighbors (KNN)
Knearest neighbor (KNN) algorithm is a simple and
easy to understand supervised machine learning
technique suitable for regression and data
classification. It predicts the result by averaging the
values of the "K” nearest neighbors in training or by
classifying new data as a majority of the "K" nearest
neighbors.
6.13.1 Key Concepts of KNN
• Lazy learning algorithm: For example, KNN
is an example of model learning. It stores
training data in its memory and makes
predictions based on neighbors while taking
measurements.
• K-Value: The 'K' in KNN denotes quantity of
closest neighbours that will be considered for
prediction-making. Selecting this
hyperparameter is a prerequisite to running the
algorithm.
• Distance Metrics: The Minkowski distance,
Manhattan distance, Euclidean distance, and
other common distance metrics are used to
determine how close two data points are to one
another.
• Decision_Rule: In task distribution, KNN uses
the majority vote of the "K" nearest neighbors
to determine the list. It calculates the average
of the 'K' nearest neighbour values in
regression issues.
6.13.2 Detailed Information about KNN
• Prediction Process:
According to the selected distance metric, it
chooses the 'K' closest neighbors or data
points. The algorithm selects the class label for
classification based on how frequently the 'K'
neighbors share that label. It determines the
average value of 'K' Nearest Neighbors for
regression.
• Choosing the Value of K:
The choice of the 'K' value has a huge impact
on the algorithm's performance. smaller 'K'
values could result in overfitting, while larger
values could smooth the decision boundary
and cause underfitting. The problem
characteristics and dataset are the determining
factors in selecting 'K'. Cross-validation and
other optimization techniques can be used to
find it.
• Distance Metrics:
Depending on the type of data, several
distance measures can be applied. Manhattan
distance may be preferred for categorical
variables, but Euclidean distance is frequently
used for continuous variables.
• Curse of Dimensionality:
The curse of dimensionality may affect KNN
sensitively. Because of the increased sparsity
of high-dimensional spaces, the nearest
neighbors might not accurately represent the
data points.
6.13.3 Benefits of KNN
• Easy to comprehend and put into practice.
• doesn't assume anything regarding the
distribution of the underlying data.
• Effective in situations where there is an
irregular or non-linear decision boundary.
6.13.4 Limitations of KNN
• Computationally expensive because it needs
to calculate the distances for each prediction
and stores the complete training dataset.
• The distance metric and the selection of 'K'
may have an impact on performance.
• Sensitive to noisy data and outliers.
6.14 Gaussian Naive Bayes
(GaussianNB)
For classification tasks, the probabilistic machine
learning algorithm Gaussian Naive Bayes
(GaussianNB) is employed. Gaussian Naive Bayes
can perform well despite its seemingly naive
assumption of feature independence, especially when
working with continuous data.
6.14.1 Key Concepts of Gaussian Naive
Bayes
• Bayesian naive classifier: It's a probabilistic
classifier that determines the likelihood of a class
Explainable AI Models for Adult Autism Detection and Interpretation
253

given specific features using the Bayes theorem.
Given the class, the "naive" assumption is that
features are independent of one another.
• Gaussian Distribution (Normal Distribution):
This presumption states that, when represented in
a continuous space, the features of each class will
resemble a bell-shaped Gaussian distribution.
• Conditional Independence: Gaussian Naive Bayes
makes the assumption that, given the class, The
value of a particular property is independent of the
value of any other property. Detailed Information
about Gaussian Naive Bayes:
Bayes Theorem:
𝑝(𝐶 𝑋) =
𝑋
𝐶
()
()
(5)
This equation is used to calculate the probability of a
class C given data X.
• P(C|X) is the probability of class c given the
features x.
• P(X|C) is the likelihood of observing features
x given class c.
• P(C) is the prior probability of class c.
• P(X) is the evidence, which is the same for all
classes and can be disregarded for
classification.
• Model Training:
Gaussian Naive Bayes uses the training
dataset to estimate the mean and variance of
each feature for each class (assuming a
Gaussian distribution).
• Model Prediction:
Gaussian Naive Bayes uses the Gaussian
probability density function to calculate the
sample's likelihood of belonging to each class
in order to predict the class of a new sample.
To determine the likelihood that the sample
belongs to a class, the prior probability of each
class is multiplied by the probabilities of the
features given the class (derived from the
Gaussian distribution). The predicted class is
given as the one with the highest likelihood.
• Handling Continuous Data:
Gaussian Naive Bayes, which assumes that
each feature within each class follows a
Gaussian distribution, is appropriate for
continuous data.
6.14.2 Advantages of Gaussian Naive Bayes
Straightforward and simple to use.
It is computationally efficient and performs well with
small datasets. Performs admirably in a complex
scenario, particularly sentiment analysis, text
classification.
6.14.3 Limitations of Gaussian Naive Bayes
We can have trouble with data that doesn't match the
assumption of a Gaussian distribution.
May requires cautious handling of outliers or missing
values during preprocessing in order to function
properly.
In situations where the independence assumption
holds reasonably well and computational efficiency is
crucial, such as spam filtering and document
categorization, Gaussian Naive Bayes is frequently
utilized in text classification tasks.
6.15 Logistic Regression
Among the most widely used statistical techniques in
binary classification is logistic regression, which is
used when the output variable is categorical and
represents two classes. Logistic regression is applied
to classification tasks instead of regression tasks. It
describes the relationship between a categorical
dependent variable and one or more variables by
calculating the probability of a particular outcome.
6.15.1 Key Concepts of Logistic Regression
Sigmoid Function:
Logistic function, also known as sigmoid function,
logistic regression model uses logistic function to
transform input data into probability score between 0
and 1. The equation of Sigmoid equation is expressed
as
𝜎
(
𝑧
)
=
(6)
The Sigmoid function performs the role of an
activation function in machine learning which is used
to add non-linearity in a machine learning model.
Decision Boundary:
The threshold probability is usually equal to 0.5
and is used by logistic regression to create a decision
boundary. If the estimate is greater than the threshold,
the model is placed in a positive class, if not, it is
placed in the negative class.
7 EXPERIMENTAL RESULTS
Explainable AI:
"Explainable AI" (XAI) seeks to address the
understanding and trust gap that exists between the
intrinsic complexity of sophisticated machine
ICRDICCT‘25 2025 - INTERNATIONAL CONFERENCE ON RESEARCH AND DEVELOPMENT IN INFORMATION,
COMMUNICATION, AND COMPUTING TECHNOLOGIES
254
learning models and the needs of humans. There are
several different XAI methodologies, including as
interpretable models, model-agnostic approaches,
and feature importance. Model-agnostic approaches
assess models without regard to their internal
workings in order to yield insights, while feature
importance techniques identify features or inputs that
have a major impact on model predictions. For
industries where AI decision-making must be trusted
and interpreted, such as healthcare, banking, and law,
XAI is essential.
Table 3: Comparison of Machine Learning Algorithms.
MODEL
DECISIO
N TREE
RANDOM
FOREST
SVM KNN
NAIVE
BAYES
LOGISTIC
REGRESSION
LDA
ACCURACY 1.00 0.99 1.00 0.94 0.88 0.99 0.93
PRECISION 1.00 1.00 1.00 1.00 0.88 0.98 0.95
RECALL 1.00 1.00 1.00 1.00 0.89 0.99 0.97
F1-SCORE 1.00 1.00 1.00 1.00 0.89 0.98 0.96
F-BETA SCORE 1.00 0.99 1.00 0.99 0.83 0.96 0.91
AUC SCORE 1.00 1.0 1.00 0.93 0.94 1.0 0.98
Table 3 Compares the performance of various
models. Within Explainable AI, there are various
approaches that each approach interpretability from a
different angle:
7.1 Feature Importance Methods
a. Permutation Feature Importance:
The fundamental concept is to shuffle one feature at
a time and track how the model performs differently.
The decline in performance highlights the
significance of the feature. Although the calculation
isn't straightforward, it does measure the change in
performance.
b. Gini Importance (decision trees):
Gini importance quantifies the overall reduction in
node impurity brought about by splits around a
certain feature in decision trees. The formula uses the
Gini index for computations.
𝐼𝑚𝑝𝑜𝑟𝑡𝑎𝑛𝑐𝑒
(
𝑋
)
=
∑
(𝑙𝑜𝑠𝑠𝑋
−𝑙𝑜𝑠𝑠
(
𝑋
)
)
(7)
This equation computes the feature importance
(Importance) of a specific feature (𝑋
) by permuting
its values across the dataset. It measures the change
in the model's loss (error) before and after the
permutation of feature 𝑋
, averaged over the dataset
(N instances).
7.2 LIME (Local Interpretable Model-
agnostic Explanation)
Black-box models can have local interpretability
provided by the LIME approach. By estimating the
behavior of a complex model around a particular
prediction or instance, it produces explanations.
It functions by encircling the relevant instance in a
straightforward, understandable model. It modifies
the input data and tracks how the predictions change
to understand the model's local behavior.
LIME helps determine which features are important
for a given prediction by generating a local linear
approximation, which helps make the conclusion
made by the model more comprehensible to humans.
𝑓
(
𝑥
)
=𝑎𝑟𝑔𝑚𝑖𝑛
∈
𝐿𝑓,𝑔,𝜋
+𝜔(𝑔)
(8)
This equation is used in LIME to generate a
simpler, local approximation of a complex model's
behavior, providing explanations for individual
predictions that are easier to understand for humans.
In LIME, an interpretable model (g) is fitted to the
data around a specific instance (𝑥
). The equation
represents the optimization problem where L is the
loss function, 𝜋
represents the proximity measure
to 𝑥
, and 𝜔(g) is a regularization term on g.
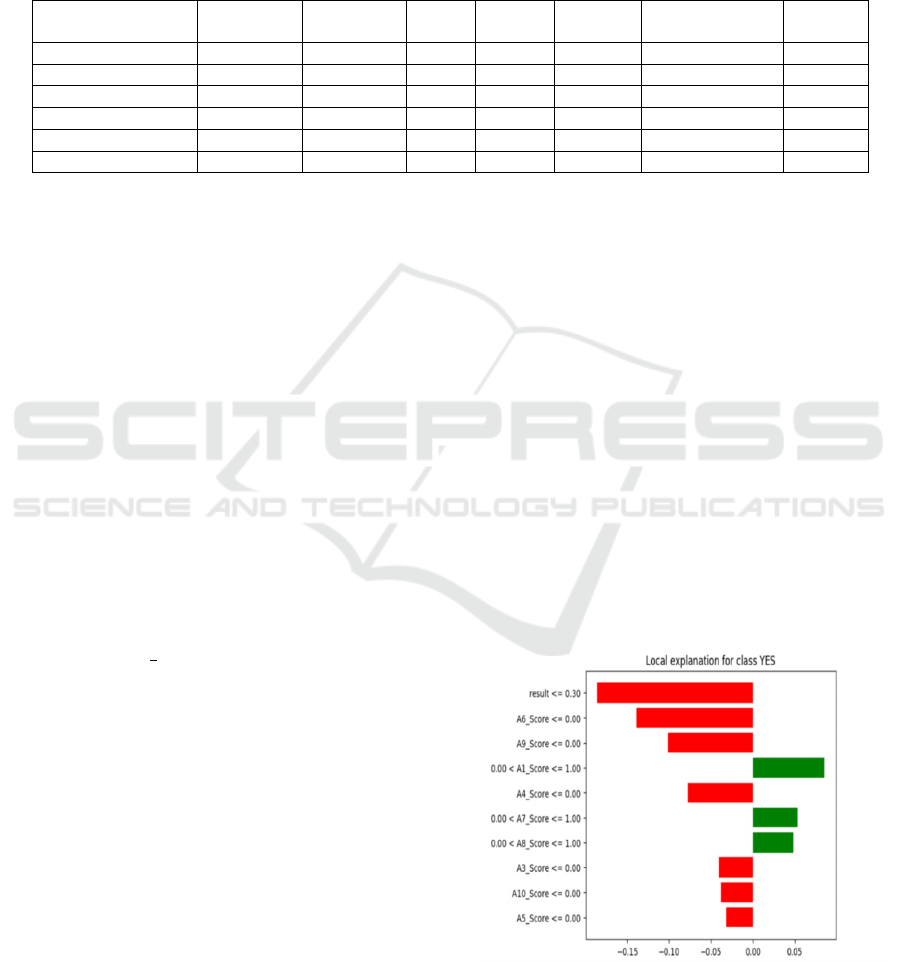
Figure 7 explains SHAP Analysis for Class YES
- Feature Contributions.
Figure 7: SHAP Analysis.
Explainable AI Models for Adult Autism Detection and Interpretation
255
7.3 SHAP (SHapley Additive
explanations)
In order to assign an important value to each
characteristic in a forecast, SHAP is based on
cooperative game theory and the Shapley value.
By assigning several attributes to the prediction
outcome, it offers a unifying framework for
interpreting the output of any machine learning
model.
∅
=
∑
|
|
!
(
|
|
)
!
!
,,…
\
𝑓
(
𝑆𝑈
𝑖
)
−𝑓(𝑆)
(9)
The equation computes the average marginal
contribution of feature i across all subsets of features.
The Shapley value (∅
) for a particular feature (2)
within a model with p features is calculated by
considering all possible subsets (S) excluding feature
i. In comparison to the average forecast, SHAP values
show the effect of adding a specific feature to the
model prediction. It takes feature interactions into
consideration, providing a more thorough
understanding of the significance of characteristics in
predictions.
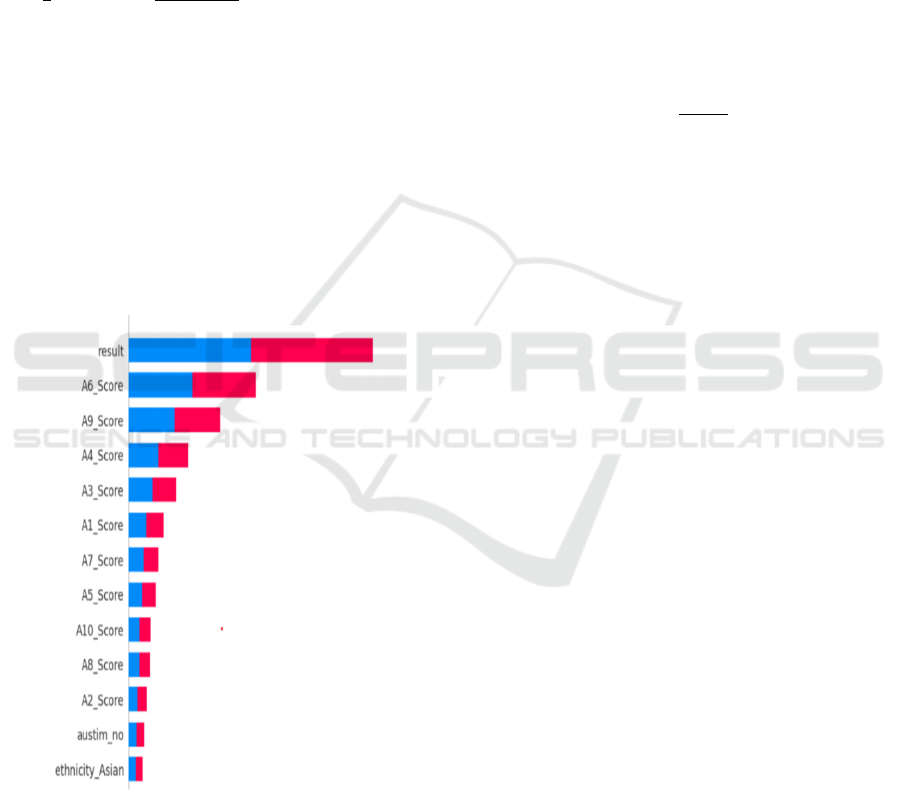
Figure 8: explains Feature Importance
Ranking for Autism Prediction Model.
Figure 8: Feature Contribution.
7.4 Model-Specific Explanations
Some models are interpretable by nature, like rule-
based systems, decision trees, and linear regression.
Naturally, these models shed light on how they make
decisions.
7.5 Counterfactual Explanations
By changing input variables and tracking how the
model's output changes, this approach offers alternate
possibilities. It aids users in comprehending what
modifications could result in various results.
7.6 Attention Mechanisms
Frequently seen in deep learning models, attention
mechanisms indicate the specific portions of the input
that the algorithm concentrates on during the
prediction process. They offer perceptions into the
characteristics or components that are essential for a
given choice.
𝐴𝑡𝑡𝑒𝑛𝑡𝑖𝑜𝑛
(
)
=
∑
(10)
In neural networks employing attention
mechanisms, the equation computes the attention
weight for a specific input 𝑥
among n inputs. To
normalize, the softmax function is utilized and obtain
the attention weight by exponentiating each input
value and dividing by the sum of exponentiated
values.
7.7 Rule-based Explanations
Creating rules that imitate how sophisticated models
make decisions aids in the creation of explanations
that are understandable to humans.
7.8 Anomaly Detection and Outlier
Analysis
Determining anomalies and outliers can help explain
the behaviour of the model by illuminating how it
responds to unexpected or uncommon data. The
model's characteristics, the interpretability required,
and the context all influence the approach choice.
8 CONCLUSIONS
After performing predictive analysis on an Autism
Adult Dataset using various machine learning models
and subsequently applying Explainable AI techniques
for feature importance. The Conclusion is as follows
When several machine learning models were
applied to the Autism Adult Dataset, including
Decision Trees, Random Forest, K-Nearest
Neighbours (KNN), Naive Bayes, Logistic
Regression, and Support Vector Machine (SVM),
different results were obtained in terms of predicting
ICRDICCT‘25 2025 - INTERNATIONAL CONFERENCE ON RESEARCH AND DEVELOPMENT IN INFORMATION,
COMMUNICATION, AND COMPUTING TECHNOLOGIES
256

whether or not an individual has Autism Spectrum
Disorder (ASD). The models were evaluated and
contrasted according to their F1 scores, accuracy,
precision, and recall.
Following a thorough assessment, it was found
that, when it came to predicting ASD in adults using
the provided dataset, Random Forest performed better
than other models. Based on a comparative analysis
of the model evaluation metrics, the Random Forest
showed the most consistent and reliable performance.
However, Explainable AI approaches were used
to ascertain feature importance within the chosen
model in order to obtain a deeper understanding of the
aspects leading to the detection of ASD. The
Explainable AI technique showed that certain
qualities, like the A6-score, were more important in
predicting ASD in adults. Examples of these
attributes include SHAP (SHapley Additive
exPlanations) and LIME (Local Interpretable Model)
values or feature importance from Random Forest.
Figure 9: Feature Contributions.
Figure 9 Feature contributions (labeled as A1, A2,
A3, etc.) showing their influence on the model's
prediction, with the highest scores (like A3, A5)
indicating a strong contribution to the prediction. This
Feature importance insights not only helps to
understand the model's predictive power but also
identifies the particular qualities or signs that have a
significant impact on adult diagnosis of ASD.
In conclusion, the Random Forest showed better
predictive abilities in diagnosing ASD in adults based
on the comparative analysis of several machine
learning models. Moreover, using Explainable AI to
determine feature importance illuminated the critical
factors influencing the diagnosis, offering researchers
and clinicians insightful knowledge about the traits
linked to adult ASD.
REFERENCES
S. Raj and S. Masood, “Analysis and detection of autism
spectrum disorder using machine learning techniques,”
Procedia Computer Science, vol. 167, pp. 994–1004,
2020.
K. S. Omar, P. Mondal, N. S. Khan, M. R. K. Rizvi and M.
N. Islam, “A machine learning approach to predict
autism spectrum disorder,” in 2019 Int. Conf. on
Electrical, Computer and Communication Engineering
(ECCECox's Bazar, Bangladesh, pp. 1–6, 2019.
S. Sadiq, M. Castellanos, J. Moffitt, M. Shyu, L. Perry et
al., “Deep learning based multimedia data mining for
autism spectrum disorder (ASD) diagnosis.” in 2019
IEEE Int. Conf. on Data Mining Workshops
(ICDMWBeijing, China, pp. 847–854, 2019.
A. Crippa, C. Salvatore, P. Perego, S. Forti, M. Nobile et
al., “Use of machine learning to identify children with
autism and their motor abnormalities,” Journal of
Autism and Developmental Disorders, vol. 45, no. 7,
pp. 2146–2156, 2015.
W. Liu, M. Li and L. Yi, “Identifying children with autism
spectrum disorder based on their face processing
abnormality: A machine learning framework,” Autism
Research, vol. 9, no. 8, pp. 888–898, 2016.
K. D. Cantin-Garside, Z. Kong, S. W. White, L. Antezana,
S. Kim et al., “Detecting and classifying self-injurious
behavior in autism spectrum disorder using machine
learning techniques,” Journal of Autism and
Developmental Disorders, vol. 50, no. 11, pp. 4039–
4052, 2020.
Fadi Thabtah. (2017). “Autism spectrum disorder
screening: machine learning adaptation and DSM-5
fulfillment.” In Proceedings of the 1st International
Conference on Medical and Health Informatics, pp. 1-
6. ACM.
Baihua Li, Arjun Sharma, James Meng, Senthil
Purushwalkam, and Emma Gowen. (2017) “Applying
machine learning to identify autistic adults using
imitation: An exploratory study.” PloS one, 12(8):
e0182652.
J. A. Kosmicki, V. Sochat, M. Duda, and D. P. Wall.
(2015) “Searching for a minimal set of behaviors for
autism detection through feature selection-based
machine learning.“ Translational psychiatry, 5(2):
e514.
Vaishali, R., and R. Sasikala. "A machine learning based
approach to classify Autism with optimum behaviour
sets. (2018) " International Journal of Engineering &
Technology 7(4): 18.
Fadi Fayez Thabtah (2017), “Autistic Spectrum Disorder
Screening Data for Adult”.,
https://archive.ics.uci.edu/ml/machine-
learningdatabases/00426/.
Explainable AI Models for Adult Autism Detection and Interpretation
257

Fadi Fayez Thabtah (2017), “Autistic Spectrum Disorder
Screening Data for children,”
https://archive.ics.uci.edu/ml/machine-
learningdatabases/00419/
Fadi Fayez Thabtah (2017), “Autistic Spectrum Disorder
Screening Data for Adolescent”,
https://archive.ics.uci.edu/ml/machine-
learningdatabases/00420/
H. S. Nogay and H. Adeli, “Machine learning (ML) for the
diagnosis of autism spectrum disorder (ASD) using
brain imaging:,” Reviews in the Neurosciences, vol. 31,
no. 8, pp. 825–841, 20
Kadhm, M. S., Ghindawi, I. W., & Mhawi, D. E. (2018).
An accurate diabetes prediction system based on K-
means clustering and proposed classification approach.
International Journal of Applied Engineering
Research, 13(6), 4038-4041.
Sneha, N., & Gangil, T. (2019). Analysis of diabetes
mellitus for early prediction using optimal features
selection. Journal of Big data, 6(1), 1-19.
Se-WoongPark, Annie Cardinaux, Deena Crozier, Marta
Russo.(2024)
“Interceptive abilities in autism spectrum disorder:
Comparing naturalistic and virtual visuomotor tasks”.
Wiley Online Library.
Abeer AI-Nafjan, Hana Alarifi, Neehal Almuways.
“Artificial Virtual Reality Simulation Design for
Children on Autism SpectrumDisorder”. IEEE 2023
Conference in Computer Science, Computer
Engineering,& Applied Computing(CSCE).
ML Based Approach to Detect Autism Spectrum
Disorder(ASD). B. Kamala, K S Mahanaga Pooja, S
Varsha, K Sivapriya. 2021 4
th
International Conference
on Computing and Communications
Technologies(ICCCT), IEEE.
The contribution of Machine Learning and Eye-tracking
technology in Autism Spectrum Disorder research: A
Review Study. Konstantinos-Filippos Kollias,
Christine K, Syriopoulou-Delli. 2021 10
th
International
Conference on Modern Circuits and Systems
Technologies(MOCAST), IEEE.
Employing Machine Learning with LightGBM
Classification to Evaluate Autism Probability. Khushi
Mittal, Kanwarpartap Singh Gill, Deepak Upadhyay.
2024 ICICET, IEEE.
Prediction of Autism Spectrum Disorder using Convolution
Neural Network. Sankar Ganesh Karuppasamy, Divya
Muralitharan, Sheela Gowr. 2022 ICOEI, IEEE.
Utilizing Machine Learning and employing the XGBosst
Classification Technique for evaluating the likelihood
of Autism Spectrum Disorder. Kanwarpartap Singh
Gill, Kapil Rajput, Vijay Singh. 2024 INCET, IEEE.
Prediction of Autism Spectrum Disorder in Children using
Face Recognition. Sanjeev Ram Arumugam, R
Balakrishna, Rashmita Khilar, Oswalt Manoj. 2021
ICOSEC, IEEE.
Autism Assistant: A Platform for Autism Home-Based
Therapeutic Intervention. Mihaela Chistol, Cristina
Turcu, Mirela Danubianu. 2023 Journal Article, IEEE.
Individual Differences of Children with Autism in Robot-
assisted Autism Therapy. Anara Sandygulova, Aida
Amirova, Zhansaule Telisheva, Aida Zhanatkyzy. 2022
17
th
ACM/IEEE International Conference on HRI.
Robot-Assisted Cognitive Training for Children with
Autism Insights and Outcomes. Rumi Iqbal Does, V.
Nivedita, Salla Venkata Subba Reddy, D Little Femlin
Jana. 2023 ICECA, IEEE.
Utilization of Naïve Bayes Classifier for Autism Risk
Assessment Using ML. Bhavya, Deepak Upadhyay,
Sarishma Dangi. 2024 INOCON, IEEE.
Autism Artificial Intelligence Performance Analysis: Five
Years of Operation. 2023, ICALT, IEEE.
ICRDICCT‘25 2025 - INTERNATIONAL CONFERENCE ON RESEARCH AND DEVELOPMENT IN INFORMATION,
COMMUNICATION, AND COMPUTING TECHNOLOGIES
258
