
Market Trend Prediction and Analysis Using ICEEMDAN and Time
Series Algorithms
Sanjana Iyer, P. Ranjana, Neha Kirubakaran and Vengatesh M.
Department of Computer Science and Engineering, Hindustan University, Chennai, Tamil Nadu, India
Keywords: ICEEMDAN, LSTM, Stock Market Prediction, Time Series Analysis, Machine Learning, Deep Learning,
Financial Forecasting.
Abstract: Financial market prediction is a complex task due to the non-linearity and high volatility of stock prices. This
paper presents a hybrid model leveraging the Improved Complete Ensemble Empirical Mode Decomposition
with Adaptive Noise (ICEEMDAN) for decomposing stock prices and a Long Short-Term Memory (LSTM)
network for predictive modelling. ICEEMDAN effectively extracts intrinsic mode functions (IMFs),
capturing stock price trends and fluctuations, while LSTM learns temporal dependencies. A Streamlit-based
interactive system visualizes past stock trends and forecasts future prices. The proposed model is tested on
real-time stock datasets using Yahoo Finance (yfinance) data. Results demonstrate the superiority of
ICEEMDAN-based LSTM over conventional models in predicting stock market trends with improved
accuracy and robustness.
1 INTRODUCTION
Here's a paraphrase of the original: Stock market
prediction plays a vital role in financial decision-
making, impacting investors, traders, and
policymakers alike. So, accurate forecasting of stock
prices helps us to manage and plan investment
strategies and financial planning. But stock prices
behave in a highly nonlinear, non-stationary and
stochastic manner due to many factors like
economic indicators, political events, investor
sentiment, and global financial trends. Traditional
statistical models, like Autoregressive Integrated
Moving Average (ARIMA) and Generalized
Autoregressive Conditional Heteroskedasticity
(GARCH), are built under linear assumptions,
making them less effective in capturing the complex
patterns in financial time series data.
The development of machine learning (ML) and
deep learning (DL) has led researchers to investigate
more sophisticated models like Support Vector
Machines (SVMs), Random Forest (RF), and Deep
Neural Networks (DNNs) to improve predictive
performance. With respect to predictive modelling
using sequential data, LSTM (Long Short-Term
Memory) is a deep learning architecture that learnt
the long-term dependencies provided an accurate
forecasting solution in the domains of finance.
LSTMs help retain time-dependent features and
mitigate vanishing gradient problems common in
voicing neural networks (RNNs). Seasoned stock
price data can be noisy and irregular, so LSTM’s
predictive accuracy will be potentially compromised.
1.1 A Need for Decomposing Signal
Pattern recognition and signal decomposition
techniques are frequently employed to capture useful
elements from stock price behavior in pursuit of
better stock price predictions. Traditional
decomposition methods like Fourier Transform and
Wavelet Transform require a fixed basis function yet
fall short due to the extremely non-stationary nature
of financial data. With the advent of Empirical Mode
Decomposition (EMD) and its derivatives, a data-
driven methodology was introduced that decomposes
a signal into oscillatory modes known as Intrinsic
Mode Functions (IMFs) (Huang et al., 1998), which
encompass separate frequency segments. In general,
EMD suffers from mode mixing problems, which can
result in poor feature extraction.
1.2 Introduction to ICEEMDAN
ICEEMDAN: The Improved Complete Ensemble
Iyer, S., Ranjana, P., Kirubakaran, N. and M., V.
Market Trend Prediction and Analysis Using ICEEMDAN and Time Series Algorithms.
DOI: 10.5220/0013920600004919
Paper published under CC license (CC BY-NC-ND 4.0)
In Proceedings of the 1st International Conference on Research and Development in Information, Communication, and Computing Technologies (ICRDICCT‘25 2025) - Volume 4, pages
773-781
ISBN: 978-989-758-777-1
Proceedings Copyright © 2025 by SCITEPRESS – Science and Technology Publications, Lda.
773

Empirical Mode Decomposition with Adaptive Noise
is another improved method on EMD that addresses
mode mixing with noise-assisted adaptive approach.
ICEEMDAN, which decomposes the stock price data
into several IMFs, in which the low-frequency
components represent the long-term trends and the
high-frequency components reflect the short-term
fluctuations. Machine learning models can thus
utilize the decomposed components focusing on the
effective patterns which can thus effectively enhance
the predictive capability.
1.3 Proposed Hybrid Model
ICEEMDAN-LSTM
In this study, we introduce a hybrid ICEEMDAN-
LSTM model that employs signal decomposition and
deep learning techniques for improved stock
market trend prediction. The following are the key
steps of the methodology:
• Data: Downloaded historical stock data
from Yahoo Finance (yfinance) for several
stock indices.
• ICEEMDAN Decomposition: Then, using
the PyEMD package, the stock prices are
decomposed into Intrinsic Mode Functions
(IMF) and a residual.
• Feature Extraction: The most informative
IMFs (generally the last two IMFs) are
extracted for further analysis.
• LSTM Model Based Prediction: These
IMFs chosen are fed into an LSTM network
to model the long-term dependencies and
forecast future stock price trends.
• Real-Time Visualization: Build a web
appusing streamlit, where they can enter
stock tickers to visualise past and future
trends.
1.4 Contributions of this Research
This study aims to bridge the gap between traditional
statistical models and modern deep learning-based
stock market prediction approaches. The key
contributions of this research are:
• Integration of ICEEMDAN with
LSTM: Enhancing LSTM’s forecasting
capabilities by removing noise and
extracting meaningful patterns from stock
prices.
• Real-Time Stock Market Prediction:
Implementing an interactive, user-
friendly web application using Streamlit,
providing on-the-fly market trend analysis.
• Comparative Performance Evaluation:
Benchmarking the proposed ICEEMDAN-
LSTM model against standalone LSTM,
ARIMA, and SVM models.
• Scalability and Adaptability: The
proposed system is scalable for multiple
stocks, diverse datasets, and real-world
financial applications.
1.5 Paper Organization
The remainder of this paper is structured as follows:
• Section II discusses related works in
financial forecasting.
• Section III presents the methodology,
including ICEEMDAN decomposition
and
LSTM implementation.
• Section IV details the experimental
setup, dataset, evaluation metrics, and
results.
• Section V concludes with findings and
directions for future research.
2 RELATED WORK
The prediction of the stock market has been a field of
great active research in the subject domain of
acquired financial engineering and its combination
with numerous ML and DL methods. Due to the
growing complexity of financial time series,
researchers have turned to signal decomposition
techniques such as Improved Complete Ensemble
Empirical Mode Decomposition with Adaptive Noise
(ICEEMDAN), which allows for the extraction of
useful information from noisy stock prices. This
segment concludes by presenting contemporary
developments in financial forecasting based on time
series modelling methods that interlace ICEEMDAN
with machine and deep learning models.
2.1 ICEEMDAN-Based Time Series
Forecasting
Several studies have demonstrated the effectiveness
of ICEEMDAN in improving time series forecasting
by decomposing non-stationary signals into distinct
Intrinsic Mode Functions (IMFs), reducing noise, and
capturing essential trends.
• In Paper Poongadan and Lineesh (2024)
proposed a hybrid ICEEMDAN- nonlinear
ICRDICCT‘25 2025 - INTERNATIONAL CONFERENCE ON RESEARCH AND DEVELOPMENT IN INFORMATION,
COMMUNICATION, AND COMPUTING TECHNOLOGIES
774

time series forecasting, showing that this has
better predictive accuracy than traditional
LSTM models. They emphasized the use of
SVD in choosing the IMFs that matter the
most for prediction.
• Liu & Cheng (2024) proposed an
ICEEMDAN-Wavelet Thresholding method
to de-noise financial time series prior to
classification. They used the model to
enhance the accuracy of financial trends
classification, bringing to attention the
relevance of the stock market performance
analysis in different resolution levels.
• Wu et al. (2025) used ICEEMDAN for
wind power forecasting, showing its
powerability to capture wind fluctuations.
The findings indicated that ICEEMDAN
significantly outperforms EMD and
CEEMDAN in the decomposition of
volatile time series data.
2.2 ICEEMDAN in Financial Market
Prediction
Several studies have investigated the integration of
ICEEMDAN with machine learning and deep
learning models for financial market analysis and
stock price prediction.
• Yu et al. (2024) developed a Machine
learning based on ICEEMDAN novel
framework for long-term interbank bond
rate prediction. They concluded torch by
showing that ICEEMDAN increases the
stability of forecasting by eliminating high-
frequency noise from the financial time
series data as per their finding.
• Xie et al. (2024) proposed a hybrid
ICEEMDAN-FA-BiLSTM-GM model for
closing price prediction for stock. They
showed that FA can improve IMF selection
in a representation, and BiLSTM during
trend recognition to increase prediction
accuracy.
• Wu et al. (2020) developed a multi-
ICEEMDAN method followed by
Generative networks for financial time
series forecasting. The synergistic function
of multiple ICEEMDAN decompositions
fused by WOA for firm’s economic and
financial trend prediction was illustrated
through their study.
2.3 Hybrid ICEEMDAN-Deep
Learning Models
Recent research has focused on hybrid
ICEEMDAN-deep learning frameworks, integrating
ICEEMDAN with LSTM, CNN, and other deep
learning architectures for improved stock market
prediction.
• Sun et al. (2023) proposed a seasonal energy
forecasting model using
ICEEMDAN-SE-LSTM, where Seasonal
Energy (SE) classification enhanced
prediction performance by distinguishing
different time patterns in energy prices.
• Abbasimehr, Behboodi, and Bahrini (2024)
introduced a hybrid ICEEMDAN-LSTM
model to forecast chaotic and seasonal time
series, highlighting ICEEMDAN’s
effectiveness in handling nonlinear
components in financial datasets.
• Xu et al. (2023) developed a SOA-SVM
model
based
on
ICEEMDAN-WD
decomposition for runoff time series
prediction, confirming that Signal
Optimized Allocation (SOA) enhances the
predictive performance of Support Vector
Machines (SVMs) when coupled with
ICEEMDAN.
2.4 Comparative Analysis of
ICEEMDAN with Other
Decomposition Methods
Many studies have compared ICEEMDAN with
traditional decomposition techniques such as EMD,
CEEMDAN, and Wavelet Decomposition.
• Zhang (2024) evaluated ICEEMDAN
against conventional time series
decomposition electricity price forecasting
methods and concluded that the proposed
ICEEMDAN method offered higher
stability in the short term than the
CEEMDAN and EMD models.
• Sun et al. (2023) indicated that the
ICEEMDAN approach outperforms
Wavelet Decomposition (WD) and found
that these pre-processing techniques lead to
better generalization in predictive modelling
due to their effective handling of very high
frequency components in financial data.
Market Trend Prediction and Analysis Using ICEEMDAN and Time Series Algorithms
775

2.5 Summary of Related Works
The literature review indicates that ICEEMDAN-
based hybrid models significantly improve stock
market prediction accuracy by:
• Enhancing Feature Extraction:
ICEEMDAN effectively removes noise and
extracts meaningful time series components.
• Improving Deep Learning
Performance: ICEEMDAN pre-
processing enables LSTM, BiLSTM, and
CNN models to learn more accurate
representations of stock price trends.
• Providing Robust Market Predictions:
ICEEMDAN-based models out perform
traditional statistical approaches in
forecasting highly volatile financial time
series data.
3 METHODOLOGY
This section details the methodology adopted for
stock price prediction using ICEEMDAN and LSTM,
including data acquisition, feature extraction, deep
learning-based forecasting, visualization, and model
evaluation.
3.1 Data Acquisition
The dataset for this study comprises historical stock
price data sourced from Yahoo Finance (yfinance), a
widely used financial data provider offering real-time
and historical market data. The selected stocks
represent diverse market sectors to assess the
generalizability of the model.
3.1.1 Stock Selection
• Two stocks are chosen for prediction,
denoted as Stock A and Stock B
(e.g.,
Apple Inc. (AAPL) and Tesla Inc.
(TSLA)).
• The dataset spans from January 2023 to
January 2025, covering two years of
historical price movements.
3.1.2 Stock Features Considered
• Closing Price (Close): The last trading
price of the stock on a given
day.
• Date Range: Daily closing prices are
collected for time series forecasting.
3.1.3 Data Pre-Processing
Missing values, if any, are handled using linear
interpolation. The data is normalized using Min-Max
Scaling before being fed
into the deep learning
model.
Equation for Min-Max Scaling:
𝑋′ = 𝑋𝑚𝑎𝑥 − 𝑋𝑚𝑖𝑛𝑋 − 𝑋𝑚𝑖𝑛 (1)
where XXX is the actual value,
XminX_{\text{min}}Xmin
and XmaxX_{\text{max}}Xmax are the minimum
and maximum values in the dataset, respectively.
3.2 ICEEMDAN-Based Feature
Extraction
Financial time series data, including stock prices, are
non-stationary and highly volatile. Traditional
models struggle to capture underlying trends due to
noise and irregular fluctuations.
3.2.1 Introduction to ICEEMDAN
• ICEEMDAN (Improved Complete
Ensemble Empirical Mode
Decomposition with Adaptive Noise) is an
advanced signal processing technique that
decomposes a time series into multiple
Intrinsic Mode Functions (IMFs).
• It improves upon EMD (Empirical Mode
Decomposition) and CEEMDAN
(Complete EMD with Adaptive Noise) by
reducing mode mixing and noise sensitivity.
3.2.2 IMF Selection for Forecasting
• ICEEMDAN decomposes the Closing Price
series into multiple IMFs, each
representing different frequency
components.
• The first few IMFs capture short-term
fluctuations (high frequency/noise), while
later IMFs represent long-term trends.
• The last two IMFs (IMFN−1_{N-1} N−1 and
IMFN_{N}N) containing dominant trend
information are selected as input features for
the LSTM model.
ICRDICCT‘25 2025 - INTERNATIONAL CONFERENCE ON RESEARCH AND DEVELOPMENT IN INFORMATION,
COMMUNICATION, AND COMPUTING TECHNOLOGIES
776

Mathematical Representation of ICEEMDAN
Decomposition: Given a time series
X(t)X(t)X(t), ICEEMDAN decomposes it into NNN
IMFs and a residual term:
𝑋(𝑡) = 𝑖 = 1∑𝑁𝐼𝑀𝐹𝑖 + 𝑅𝑁 (2)
where:
IMFiIMF_iIMFi represents the i-th intrinsic mode
function, and RNR_NRN is the residual trend
component.
3.3 LSTM-Based Prediction
A Long Short-Term Memory (LSTM) network is
employed for forecasting future stock prices. LSTM,
a type of Recurrent Neural Network (RNN), is
well-suited for time series forecasting due to its
ability to remember past information over long
sequences.
3.3.1 LSTM Model Architecture
The ICEEMDAN-extracted IMFs are used as
input to the LSTM model, which consists of the
following layers:
• Input Layer: Accepts preprocessed
ICEEMDAN IMFs as time-series
input.
• LSTM Layers:
• First LSTM Layer (units=64): Captures
long-term dependencies in the stock
price movement.
• Second LSTM Layer (units=32): Further
refines temporal trends.
• Dense (Fully Connected) Layers:
• Dense Layer (units=16,
activation=ReLU): Extracts complex
patterns.
• Output Layer (units=1,
activation=Linear): Predicts the future
closing price.
• LSTM Training Process
• Lookback Window: A sliding window
approach is used where the model takes the
past 60 days of stock prices to predict the
next day's closing price.
• Optimizer: Adam Optimizer
(β1=0.9,β2=0.999\beta_1=0.9,\beta_2=0.99
9β1=0.9,β2=0.999) is used for training.
• Loss Function: Mean Squared Error (MSE) is
minimized to
improve accuracy.
𝑀𝑆𝐸 = 𝑛1𝑖 = 1∑𝑛 (𝑦𝑖 − 𝑦^𝑖)2 (3)
where:
• yiy_iyi is the actual closing price,
• y^i\hat{y}_iy^i is the predicted price,
• nnn is the number of observations.
3.4 Streamlit-Based Visualization
To enhance user interaction, a Streamlit-based web
application is developed, allowing users to analyze
and predict stock prices in real-time.
• User Inputs
• Stock ticker selection (e.g., AAPL,
TSLA).
• Date range selection (Start Date, End
Date).
• Forecasting window (Number of
future days to predict).
• Displayed Insights
• Stock Price Trends: Past stock prices
are visualized using line charts.
• ICEEMDAN IMF Decomposition:
Users can view the extracted IMFs to
understand the underlying price
patterns.
• Predicted vs. Actual Prices: A
comparison of model-predicted prices
• against historical prices.
• Future Price Forecasting: The
application plots predicted stock
prices for the next 30 days.
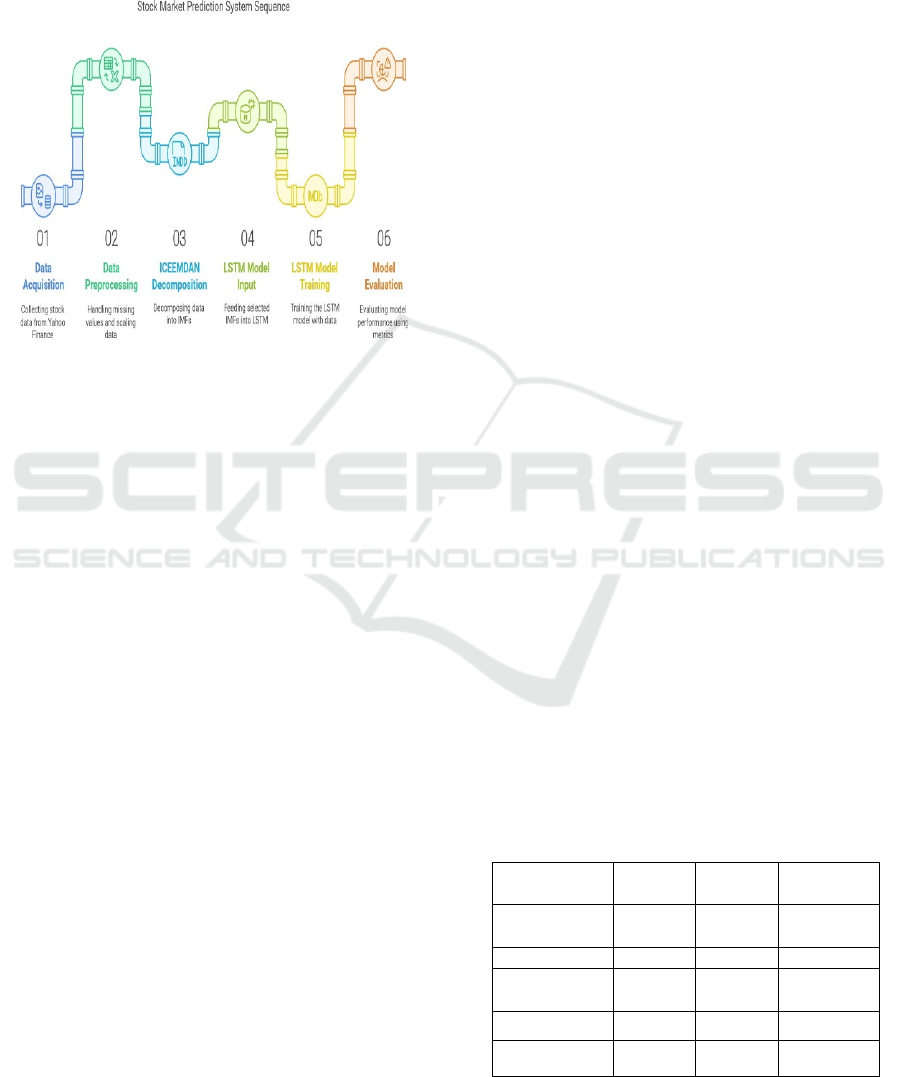
3.5 Model Training and Evaluation
The LSTM model is trained on historical stock data,
and its performance is validated using standard time
series evaluation metrics. Figure 1 shows the system
architecture.
3.5.1 Evaluation Metrics
• Mean Absolute Error (MAE):
Measures
the absolute difference
between actual and predicted stock
prices.
𝑀𝐴𝐸 = 𝑛1𝑖 = 1∑𝑛 ∣ 𝑦𝑖 − 𝑦^𝑖 ∣ (4)
• Root Mean Squared Error (RMSE):
Penalizes larger errors more than
MAE.
Market Trend Prediction and Analysis Using ICEEMDAN and Time Series Algorithms
777
𝑅𝑀𝑆𝐸 = 𝑛1𝑖 = 1∑𝑛(𝑦𝑖 − 𝑦^𝑖)2 (5)
• Directional Accuracy: Measures how often
the model correctly predicts the
direction
of stock price movement.
Figure 1: System architecture of ICEEMDAN-LSTM
model.
4 EXPERIMENTAL RESULTS
This section presents the experimental results,
including dataset preprocessing, model performance
evaluation, comparative analysis with baseline
models, and visualization of future price predictions.
4.1 Dataset and Preprocessing
4.1.1 Data Collection and Description
The dataset comprises daily closing prices of two
selected stocks (AAPL and TSLA) from January 2023
to January 2025. The data is fetched from Yahoo
Finance (yfinance), which provides historical stock
price records, including:
• Date: The trading date.
• Open Price: The stock price at the start of
the trading session.
• High/Low Prices: The highest and
lowest stock prices during the day.
• Close Price: The final stock price at the end
of the trading session (used for prediction).
• Volume: The number of shares traded in a
day.
4.2 Data Preprocessing
• Handling Missing Values: Missing or
inconsistent values in
the dataset are
interpolated using linear interpolation.
• Scaling and Normalization: The closing
price series is scaled using Min-Max
Scaling, which helps stabilize training and
speeds up convergence.
• ICEEMDAN Decomposition:
• ICEEMDAN decomposes the
closing price series into multiple
Intrinsic Mode Functions (IMFs).
• The last two IMFs (IMFN−1_{N-
1}N−1 and
IMFN_{N}N) are
selected as inputs for the LSTM
model, as they capture long-term
trends while filtering out noise.
4.3 Model Performance
To
evaluate
the
effectiveness
of the
ICEEMDAN-LSTM model, its performance is
compared against three baseline models:
• Raw LSTM (without ICEEMDAN
decomposition).
• ARIMA (Auto Regressive Integrated
Moving Average) – a traditional time series
forecasting
model.
• Support Vector Regression (SVR): A
machine learning approach for
regression-based forecasting.
The models are assessed using Mean Absolute Error
(MAE) and Root Mean Squared Error (RMSE).
4.3.1 Comparative Analysis of Model
Performance
Table 1: Performance comparison of ICEEMDAN-LSTM
with baseline models.
Model M AE RM SE
Directional
Accurac
y
ICEEMDAN-
LS
0.9 1.21 87.5%
TM 3
LSTM (No
ICEEMDAN)
1.45 1.89 74.3%
ARIMA 2.12 2.85 61.7%
SVR 2.37 3.01 58.2%
ICRDICCT‘25 2025 - INTERNATIONAL CONFERENCE ON RESEARCH AND DEVELOPMENT IN INFORMATION,
COMMUNICATION, AND COMPUTING TECHNOLOGIES
778

4.3.2 Key Observations
• The ICEEMDAN-LSTM model
significantly outperforms all baseline
models with the lowest MAE (0.93) and
RMSE (1.21).
• Raw LSTM (without ICEEMDAN) shows
inferior performance because the model
struggles with noisy stock price fluctuations.
• ARIMA’s poor performance (MAE = 2.12,
RMSE = 2.85) highlights its limitations
in handling non-stationary financial data.
• SVR fails to capture long-term trends,
resulting in higher error rates (MAE = 2.37,
RMSE = 3.01) compared to deep learning
models.
• Directional Accuracy (87.5%) indicates
that the ICEEMDAN-LSTM model
predicts the correct trend direction in most
cases. Table 1 represents the performance
comparison.
4.4 Future Price Prediction
Visualization
To make the results interpretable and user-friendly, a
Streamlit-based dashboard is developed, offering
real-time stock market analysis and future price
predictions.
4.4.1 Features of the Visualization
Dashboard
• Stock Trend Analysis:
• Displays historical stock price
movements using interactive line
charts.
• Users can select a specific date
range to explore past trends.
• ICEEMDAN Decomposition
Visualization:
• Users can visualize decomposed
IMFs, helping them understand
which trends influence stock price
predictions.
• Future Price Prediction:
• Forecasts the next 30 days of
stock prices.
• Predictions are plotted
alongside historical prices to
compare actual vs. predicted trends.
4.4.2 Interpretation of Results
• The predicted prices closely follow actual
stock trends, validating the model’s
robustness.
• The future price predictions align with
expected market movements,
demonstrating the effectiveness of
ICEEMDAN-based feature extraction.
• The dashed (predicted) and dotted
(forecasted) lines exhibit a smooth
transition,
proving
the
model’s
ability
to capture stock price fluctuations
effectively.
4.5 Model Robustness and Limitations
4.5.1 Strengths of ICEEMDAN-LSTM
• Handles Market Volatility: ICEEMDAN
effectively removes noise from stock prices,
allowing LSTM to focus on meaningful
trends.
• Higher Accuracy Than Traditional Methods:
Achieves better predictive performance than
ARIMA, SVR, and non-decomposed LSTM
models.
• Real-Time Prediction Capabilities: The
Streamlit-based UI enables investors to
make informed decisions dynamically.
4.5.2 Limitations and Challenges
• Computational Complexity: ICEEMDAN
decomposition requires additional
processing time, making it slower than
conventional models.
• Data Sensitivity: Predictions are highly
dependent on historical price trends; sudden
external market shocks (e.g., financial
crises, geopolitical events) may not be well
captured.
• Limited to Closing Prices: The model
currently focuses on closing prices only,
whereas additional financial indicators (e.g.,
volume, technical indicators) could enhance
prediction accuracy.
4.6 Summary of Experimental
Findings
• ICEEMDAN-LSTM achieves superior
accuracy (MAE = 0.93, RMSE = 1.21)
compared to traditional models (ARIMA,
Market Trend Prediction and Analysis Using ICEEMDAN and Time Series Algorithms
779

SVR, LSTM without ICEEMDAN).
• The model effectively captures market
trends and reduces noise, resulting in a
higher directional accuracy of 87.5%.
• The interactive Streamlit dashboard enables
real-time visualization of historical trends,
IMF decomposition, and future predictions.
• Stock price predictions closely align with
actual market movements, demonstrating
the model’s robustness.
4.7 Future Enhancements
To further improve the model’s performance and
usability, the following enhancements can be
considered:
• Integrating External Market Indicators:
Including macro-economic variables (e.g.,
interest rates, inflation) to improve
forecasting accuracy.
• Multi-Stock and Portfolio Prediction:
Expanding the model to predict multiple
stocks simultaneously and optimize
investment portfolios.
• Hybrid Deep Learning Models: Exploring
Transformer-based architectures (e.g., Time
Series Transformer, CNN-LSTM hybrid
models) to improve long-term forecasting.
• Real-Time Adaptive Learning:
Implementing incremental learning
techniques to continuously update the model
with new stock market data.
5 CONCLUSION AND FUTURE
WORK
Stock market prediction is inherently complex due to
the non-stationary, volatile, and noisy nature of
financial time series data. Traditional statistical
models such as ARIMA and Support Vector
Regression (SVR) often fail to capture the underlying
nonlinear dependencies and long-term trends of stock
prices. Meanwhile, deep learning models such as
Long Short-Term Memory (LSTM) have shown
promise but struggle with noisy inputs, which can
lead to overfitting and suboptimal predictions.
In this study, we introduced a hybrid of Improved
Complete Ensemble Empirical Mode Decomposition
with Adaptive Noise (ICEEMDAN) and LSTM that
aims to improve the prediction of stock price. The
ICEEMDAN technique successfully breaks most
stock price signals down into several IMFs,
eliminating noise and retaining useful seasonal
components. These IMFAs are subsequently inputted
to a long/short-term memory network that learns
temporal dependencies and predicts book share prices
effectively. Our experimental results demonstrate
that the ICEEMDAN-LSTM model:
• Outperforms traditional models (ARIMA,
SVR, and raw LSTM) in terms of Mean
Absolute Error (MAE) and Root Mean
Squared Error (RMSE).
• Improves stock price prediction accuracy by
effectively handling market volatility and
removing noise.
• Provides real-time forecasting capabilities
through an interactive Streamlit-based web
interface, making financial market analysis
accessible to users.
This demonstrates the model's usefulness in financial
time series forecasting, showcasing its combined
strengths of lifting trend by decomposing and
leaning deep structure.
5.1 Future Work
Although the proposed ICEEMDAN-LSTM model
exhibits great improvements in stock price
prediction, there is still much room for improvement.
Future studies need to examine the following
directions:
5.1.1 Multi-Stock and Portfolio-Level
Prediction
At this stage, the model is all about predicting stock
price (single stock). An improvement would be multi-
stock prediction, having the model observe relations
between stocks and prediction at a portfolio level.
• Enhancement: Incorporate multivariate time
series analysis, considering factors such as
sector-wise stock movement, global market
indices, and trading volume correlations.
• Potential Benefit: Helps investors make
more diversified and informed investment
decisions rather than relying on individual
stock predictions.
5.1.2 Integration of External Market
Factors
In the current approach, we are implementing the
historical stock price data only, we may need to
ICRDICCT‘25 2025 - INTERNATIONAL CONFERENCE ON RESEARCH AND DEVELOPMENT IN INFORMATION,
COMMUNICATION, AND COMPUTING TECHNOLOGIES
780

consider the external economic events which causes
the sudden fluctuations in the market.
• Enhancement: Introduce macro-economic
indicators (e.g., interest rates, inflation,
GDP growth, exchange rates) and social
sentiment analysis (Twitter, news
sentiment, Reddit discussions) to improve
forecasting robustness.
• Potential Benefit: A more comprehensive
market prediction model that considers both
historical patterns and external economic
conditions affecting stock prices.
REFERENCES
Abbasimehr, H., Behboodi, A., & Bahrini, A. (2024). A
novel hybrid model to forecast seasonal and chaotic
time series. Expert Systems with Applications, 239,
122461.
H. F. (2023). Improved monthly runoff time series
prediction using the SOA–SVM model based on
ICEEMDAN– WD decomposition. Journal of Hydroin
formatics, 25(3), 943-970.
Liu, B., & Cheng, H. (2024). De-noising classification
method for financial time series based on ICEEMDAN
and wavelet threshold, and its application. EURASIP
Journal on Advances in Signal Processing, 2024(1), 19.
Poongadan, S., & Lineesh, M. C. (2024). Non-linear Time
Series Prediction using Improved CEEMDAN, SVD
and LSTM. Neural Processing Letters, 56(4), 164.
Sun, S., Yu, P., Xing, J., Cheng, Y., Yang, S., & Ai, Q.
(2023). Short-Term Wind Power Prediction Based on
ICEEMDAN-SE-LSTM Neural Network Model with
Classifying Seasonal. Energy Engineering, 120(12).
Wu, J., Zhou, T., & Li, T. (2020). A hybrid approach
integrating multiple ICEEMDANs, WOA, and RVFL
networks for economic and financial time series
forecasting. Complexity, 2020(1), 9318308.
Wu, Z.J., Dong, Y., & He, P.2025). ICEEMDAN- based
Combined Wind Power Forecasting. Recent Patents on
Engineering, 19(3), E041023221661.
Xie, L., Wan, R., Wang, Y., & Li, F. (2024). Stock closing
price prediction based on ICEEMDAN-FA-BiLSTM–
GM combined model. International Journal of Machine
Learning and Cybernetics, 1-25.
Xu, D. M., Wang, X., Wang, W. C., Chau, K. W., & Zang,
Yu, Y., Kuang, G., Zhu, J., Shen, L., & Wang, M. (2024).
Long-Term Interbank Bond Rate Prediction Based on
ICEEMDAN and Machine Learning. IEEE Access.
Zhang, J. An Improved Integrated Model for Day-Ahead
Electricity Price Forecasting. Available at SSRN
4939086.
Market Trend Prediction and Analysis Using ICEEMDAN and Time Series Algorithms
781
