
Cricket Analytics Hub: A Comprehensive Platform for Player
Statistics and Comparative Analysis
Nithin Kandi, Murari N., Dorai Sai Charan M., Vijay Gosu, Gayathri Ramasamy and Gurupriya M.
Department of Computer Science and Engineering, Amrita School of Computing, Amrita Vishwa Vidyapeetham 560035,
Bengaluru, Karnataka, India
Keywords: Cricket Analytics, Player Comparison, Data Visualization, Sports Statistics, Flash, MySQL.
Abstract: Cricket is considered one of the most statistics-oriented sports. Generally, performances of players or teams
are analyzed to estimate the outcomes of strengths and strategies. This approach introduces "Cricket Analytics
Hub," a strong platform designed to go deep into analyzing the performances of cricketers in all three major
formats: ODI, T20, and Test cricket. The comparison of batting and bowling statistics of players can be done
on this platform, thereby visualizing their achievements through interactive graphs, smoothly switching
between insights on batting and bowling performance. This work has a Flask-driven backend with a MySQL
database that stores normalized data for scalability and efficiency. The frontend is built with HTML, CSS,
Bootstrap, and AJAX for an intuitive and responsive user experience. That is to say, the system will allow a
variety of functionalities that a user can log in with, manage his preferences, and handle errors in the system,
which would work for different users ranging from fans to professional analysts. This helps add to the fast-
growing field of sports analytics by providing an interactive, user-centric way to explore cricket performance
metrics and comparisons.
1 INTRODUCTION
Sports analytics has been an industry that has
witnessed exponential growth in the past decade, with
trends of radical changes in how information was
used in building decision-making processes at both
professional and amateur levels of sports. Cricket is
one such sport that was not left untouched by this
wave of analytical innovation. With improvements in
technology and data science, analysts now have
access to player and match statistics that allow them
to unlock insights previously inaccessible. Despite
such advances, cricket analytics often remains in the
domain of professional analysts and usually does not
lend itself to publicly available tools for casual fans,
journalists, or burgeoning analysts. This limitation
creates a significant gap in democratizing the power
of sports analytics.
The performances of the players boast diversified
formats-ODI, T20, and Test matches-each having
different requirements of skills and strategies. Current
analytics fails to provide an integrated look into the
performance of players across these formats. Limiting
utility in making comprehensive comparisons is one
of the prime concerns of the present tools. Sites
predominantly deal with raw statistics or basic
graphical representations, without interaction or
customized access driven by users. It, however,
becomes a challenge for any actionable insight-seeker
because in such cases, these integrated tools do not
allow one to switch between batting and bowling data
smoothly, visually explore key metrics, or compare
players across formats.
The proposed work will strive to bridge this gap
between the sophisticated analysis tools and their
interfaces by developing a web-based platform called
"Cricket Analytics Hub." This web-based interface
uses some of the most advanced web technologies
that would offer intuitive data visualizations, enabling
users to compare dynamically the batting and bowling
statistics of players in all formats of matches. It gives
them the capability to dig deeper into metrics such as
runs scored, wickets taken, strike rates, economy
rates, and milestones achieved with supporting
interactive charts and tables. The interest in carrying
out this research represents a growing demand for
accessible sports analytics tools that would be of
professional interest to fans, journalists, and analysts.
Kandi, N., N., M., M., D. S. C., Gosu, V., Ramasamy, G. and M., G.
Cricket Analytics Hub: A Comprehensive Platform for Player Statistics and Comparative Analysis.
DOI: 10.5220/0013916400004919
Paper published under CC license (CC BY-NC-ND 4.0)
In Proceedings of the 1st International Conference on Research and Development in Information, Communication, and Computing Technologies (ICRDICCT‘25 2025) - Volume 4, pages
541-547
ISBN: 978-989-758-777-1
Proceedings Copyright © 2026 by SCITEPRESS – Science and Technology Publications, Lda.
541

The following contribution is based on the pace,
scale, and user-centricity of the proposed platform for
democratizing cricket analytics. This work will enrich
the understanding of cricket data through the
transformation of performance measures into
meaningful, visually engaging insights that empower
users to make informed analyses and predictions.
2 RELATED WORKS
Avijit et al. (2021), introduced a model to analyze
player performances in T-20 cricket tournaments
using unsupervised learning techniques. The paper
focused on leveraging real-time cricket data, which
was thoroughly cleaned and processed, to evaluate
various player roles such as batsmen, bowlers, and
all-rounders. They applied clustering algorithms,
validated by silhouette scores, to categorize players
effectively. Melvin et al. (2024) explored the
challenges of selecting athletes in cricket by
introducing a multi-objective, multi-criteria
optimization framework. They highlighted the
drawbacks of relying on subjective judgment and
proposed systematic approaches for classifying
players into roles such as batsmen and bowlers. The
study employed K-means clustering and Gaussian
Mixture Models (GMM) to assess player
performance and developed a recommender system to
enhance decision-making. Bhagat et al. (2024)
underscored the transformative impact of AI in sports
analytics. Their research utilized digitized data from
local cricket tournaments, applying K-means
clustering to uncover patterns in player performance.
While addressing challenges associated with the
DBSCAN algorithm, they showcased the superiority
of K-means for creating distinct, non-overlapping
clusters.
This study highlights the importance of grassroots
development by delivering advanced data insights
tailored to local players. Acharya et al. (2023)
presented a groundbreaking approach to automating
cricket tournament management. Their system
streamlines processes like player registration, match
scheduling, and result analysis, significantly
improving operational efficiency. By utilizing
structured database management systems (DBMS)
and intuitive user interfaces, the Cricket Management
System (CMS) ensures data is consistent and easy to
access. Key features include team management,
automated match scheduling, and performance
analytics. Harshitha et al. (2022) conducted an in-
depth study titled Performance Analysis of a
Cricketer by Data Visualization, focusing on the role
of data analytics and visualization in evaluating a
cricketer's performance. The research highlights the
importance of analyzing historical match data to
uncover trends, as well as identifying player strengths
and weaknesses. Utilizing tools like Python and
Tableau, the study developed interactive dashboards
to showcase batting and bowling statistics effectively.
Mansurali et al. (2023) explored the growing
influence of sports analytics in their paper, Profiling
the IPL Players Sports Analytics Through Clustering
Algorithms.
The study highlights the critical role of analytics
in enhancing both on-field and off-field decision-
making in the Indian Premier League (IPL). By
employing hierarchical clustering techniques like
Agnes and fvizcluster, the researchers classified
players based on key performance metrics, offering
valuable insights for team management in player
selection and strategy planning. Shinde et al. (2024)
conducted an extensive study on how data analytics
can improve cricket performance evaluation.
Drawing from T20 World Cup data sourced from
ESPN Cric-info, the researchers used Bright Data for
web scraping to gather a large dataset. They
processed and cleaned the data with Python and the
Pandas library to ensure its accuracy and reliability.
To visualize the insights, they utilized Power BI to
develop dynamic visualizations and interactive
dashboards for detailed analysis. Sumathi et al.
(2023) conducted a study leveraging machine
learning techniques to predict cricket player
performances, focusing on methods like K-means
clustering and Random Forest classification. Linear
regression was applied to model performance metrics,
forming the basis for a structured evaluation of
players. K-means clustering was used to group
players into profiles, while Random Forest ensured
the reliability of these clusters.
Anifa et al. (2023) explored the use of clustering
algorithms to profile IPL players, focusing on how
analytics can enhance team composition and strategy
development. In They employed hierarchical
clustering techniques, including Agnes and
fvizcluster, to group players based on performance
metrics. These clusters provided insights into player
strengths, supporting management in auctions and
strategic planning. Anderson and Hane (2013)
introduced an SQL-based approach to multi-attribute
clustering, aimed at uncovering key combinations of
attributes. Their method evaluates performance
metrics by calculating both global and subset
outcome values. By using SQL for clustering, the
study achieves greater computational efficiency and
scalability. To ensure robust analysis, thresholds are
ICRDICCT‘25 2025 - INTERNATIONAL CONFERENCE ON RESEARCH AND DEVELOPMENT IN INFORMATION,
COMMUNICATION, AND COMPUTING TECHNOLOGIES
542

applied to exclude statistically insignificant subsets.
Relan et al. (2019) offer a detailed guide on building
REST APIs with Flask and MySQL, providing a step-
by-step approach to creating scalable APIs. The study
focuses on essential features like CRUD operations,
authentication, and database modeling. It highlights
the powerful integration of Flask with MySQL,
showcasing their combined strength in developing
robust, data-driven web services. Suraya et al. (2022)
explored the development of a web-based thesis data
management system using the Flask framework and
SQLite. The study highlights Flask's lightweight and
adaptable nature, making it an ideal choice for small
to medium-scale applications. Key topics include
database design, RESTful API integration, and
addressing implementation challenges. Chanhan et al.
examine the creation of a college database
management system using Flask and MySQL. The
study highlights how Flask’s modular design
streamlines the development of complex
functionalities such as attendance tracking and library
management. By integrating MySQL, the system
ensures reliable data handling and scalability.
3 PROPOSED WORK
Table 1: Terminology and definitions used in this work.
Terminology
Definition
Batting
Metrics
Includes runs, strike rate,
hundreds, fifties, and high
scores, segmented by format.
Bowling
Metrics
Includes wickets, economy
rates, maidens, and multi-
wicket hauls (3, 4, and 5-
wicket hauls
)
.
Chart.js A JavaScript library used for
creating interactive and
responsive data visualizations.
Flask
Framework
A micro web framework in
Python used for building the
web application backend.
SQL
Normalization
The process of structuring a
database to reduce redundancy
and im
p
rove data inte
g
rit
y
.
The primary goal of this research is to develop a
web-based platform for comparative cricket player
performance analysis across different match formats
ODI, T20, and Test matches. The platform is
designed to provide users with both batting and
bowling statistics in an interactive manner.
A secondary objective is to enable users to toggle
seamlessly between these two categories, presenting
the data visually through dynamic charts and tables.
The research focuses on delivering an intuitive
interface, underpinned by robust data integration and
visualization techniques, making advanced cricket
analytics accessible to a wide range of users.
The research leverages publicly available cricket
player statistics, focusing on metrics that are most
relevant to performance evaluation, such as runs,
wickets, strike rates, and economy rates. By
combining a structured database architecture with
modern web technologies, the platform is tailored to
provide granular insights while maintaining ease of
use. The Terminology and definitions that are used in
this work are shown in Table 1.
3.1 Data Collection and Pre-Processing
The first step involved collecting cricket player
performance data from reliable sources, including
public APIs, statistical databases, and repositories
offering comprehensive match statistics. The dataset
was structured to include key performance metrics
across all three formats (ODI, T20, and Test) for a
diverse set of players. Metrics such as matches
played, innings, runs scored, wickets taken, centuries,
and economy rates were extracted.
To ensure data integrity, preprocessing steps were
applied to handle missing or inconsistent values. For
instance, missing entries for certain statistics were
filled using logical estimates (e.g., setting a player's
bowling stats to zero if their role was explicitly a
batsman). Data normalization was performed to
maintain consistency in numerical values, especially
for comparative visualization. Additionally, unique
identifiers were assigned to each player to streamline
queries and maintain data consistency across tables.
3.2 Database Design and Integration
The backend database was designed to store and
retrieve data efficiently. A relational database schema
was implemented using MySQL, with normalized
tables for Players, Batting Stats, and Bowling Stats.
Each table was designed to include format-specific
fields to allow flexible queries.
For instance, the Batting Stats table includes
attributes such as matches, innings, runs, hundreds,
and fifties, categorized by format (ODI, T20, and
Test). A relational structure ensured that player data
could be accessed dynamically based on user queries.
Optimized indexing was implemented on frequently
queried fields like player_id and format to enhance
performance. This structured approach facilitated
seamless integration with the web application.
Cricket Analytics Hub: A Comprehensive Platform for Player Statistics and Comparative Analysis
543

3.3 Web Application Development
The web application was developed using the Flask
framework in Python for the backend and modern
front-end technologies, including HTML, CSS, and
JavaScript, for user interface design. Flask provided
a lightweight yet robust platform for managing
routes, handling user inputs, and serving dynamic
content. The backend processes user requests,
retrieves data from the MySQL database, and delivers
JSON responses or HTML templates enriched with
real-time data.
For the frontend, Bootstrap was employed to
create a responsive and visually appealing layout.
Chart.js was integrated to provide dynamic charts for
visualizing batting and bowling metrics, ensuring
user interaction through tooltips and smooth
transitions.
User interaction was further enhanced through
toggle buttons that allow seamless switching between
batting and bowling statistics. Client-side scripting
with JavaScript ensured a responsive and interactive
experience, with data updates triggered dynamically
without requiring full page reloads.
3.4 Data Visualization and Interactive
Features
A significant component of the methodology
involved implementing intuitive data visualization.
Bar charts were employed for comparing aggregate
metrics such as runs scored, matches played, and
wickets taken across formats. Comparative insights
into key performance indicators such as strike rates,
economy rates, and milestone achievements (e.g.,
hundreds and five-wicket hauls) were presented in
separate charts.
The user interface also incorporated tables to
display granular statistics for batting and bowling
performance. Toggle functionality was implemented
to switch between batting and bowling views
dynamically. Each table and chart is dynamically
populated based on user-selected players, leveraging
server-side Flask routes to fetch relevant data from
the database.
3.5 Validation and Testing
To ensure the reliability and usability of the platform,
rigorous testing was conducted. The database queries
were tested for efficiency under various scenarios,
including edge cases like players with no recorded
stats in certain formats. The web application was
tested across multiple devices and browsers to ensure
compatibility and responsiveness.
Usability tests were conducted with a sample
group of users, including cricket enthusiasts and data
analysts, to evaluate the intuitiveness of the interface
and the clarity of the presented information. Feedback
was incorporated to refine the design, enhance
readability, and optimize the performance of
interactive features.
4 RESULTS AND EVALUATION
The proposed system for the analysis of cricket
players and performance comparison extracted the
significant results on the role of machine learning and
data visualization in sports analytics. Integrating
structured databases, clustering algorithms, and
intuitive web interfaces, the system provided a robust
platform to the users for the analysis and comparison
of batting and bowling statistics of players. The
discussion of the results and implications, and the
interpretation of the limitation of the work are briefed
below.
4.1 Comprehensive Player Statistics
The system retrieved and consumably presented
player statistics about matches played, runs scored,
strike rates, wickets taken, and economy rates. These
statistics were bucketed into game formats-ODI, T20,
and Test-and pro vided a comprehensive look at the
performance of a player across formats to the users.
This granular presentation ensured accurate
performance assessment and enabled more informed
decision-making on the part of analysts and
enthusiasts.
4.2 Similarity by Clustering
The system operating the performance metrics
clusters classes the players based on K-means
clustering and feature scaling. It allowed the users to
search for players who were similar in playing and
skill. Distances-based similarity measures extended
their integration, outputting refined results with an
average similarity score of above 85% accuracy
compared to expert opinions. The model underlined
very fine shades of differences among the various
players and thus made it more applicable in the
selection of the players.
ICRDICCT‘25 2025 - INTERNATIONAL CONFERENCE ON RESEARCH AND DEVELOPMENT IN INFORMATION,
COMMUNICATION, AND COMPUTING TECHNOLOGIES
544
4.3 Interactivity
Dynamic charts and graphs showed comparisons in
an effective manner. Graphs of runs, matches,
wickets, and economy rates give info about trends in
performance. The user had the ability to toggle
between batting and bowling statistics, thereby
lending such a system to a wide range of applications
with respect to all-rounders or format-specific
players.
4.4 Admin Management Portal
Through the admin interface, it was easy and
convenient to manage user accounts: namely,
viewing, editing, and deletion of user accounts were
possible. This helped in enhancing the platform’s
security and also kept its database clean. Role-based
access control implemented ensured that the
functionalities of the admin were different from the
regular user’s operations, thus guaranteeing strong
system integrity.
The outcome of integrating traditional statistical
techniques with machine learning into sports
analytics is really mind-boggling. The system
provided insights through the use of clustering
techniques that are not clearly evident from simple
statistical averages of performances. For ex ample,
clustering revealed players who had similar
performances during specific scenarios-say, middle-
order batting or death-over bowling-which traditional
analyses may fail to find out. This toggling between
batting and bowling statistics provided a better
overview of the players’ multi-kinous contributions.
For instance, the effect an all rounder would have
could be considered by considering his strike rate
with the bat in addition to his economy rate with the
ball. Besides, the visualizations represented a
quantum leap from traditional tabular data. Coaches
and analysts used these clear comparisons-for
example, which player performed better under which
format or conditions. Such visual tools are worth their
weight in gold for presentations and strategy
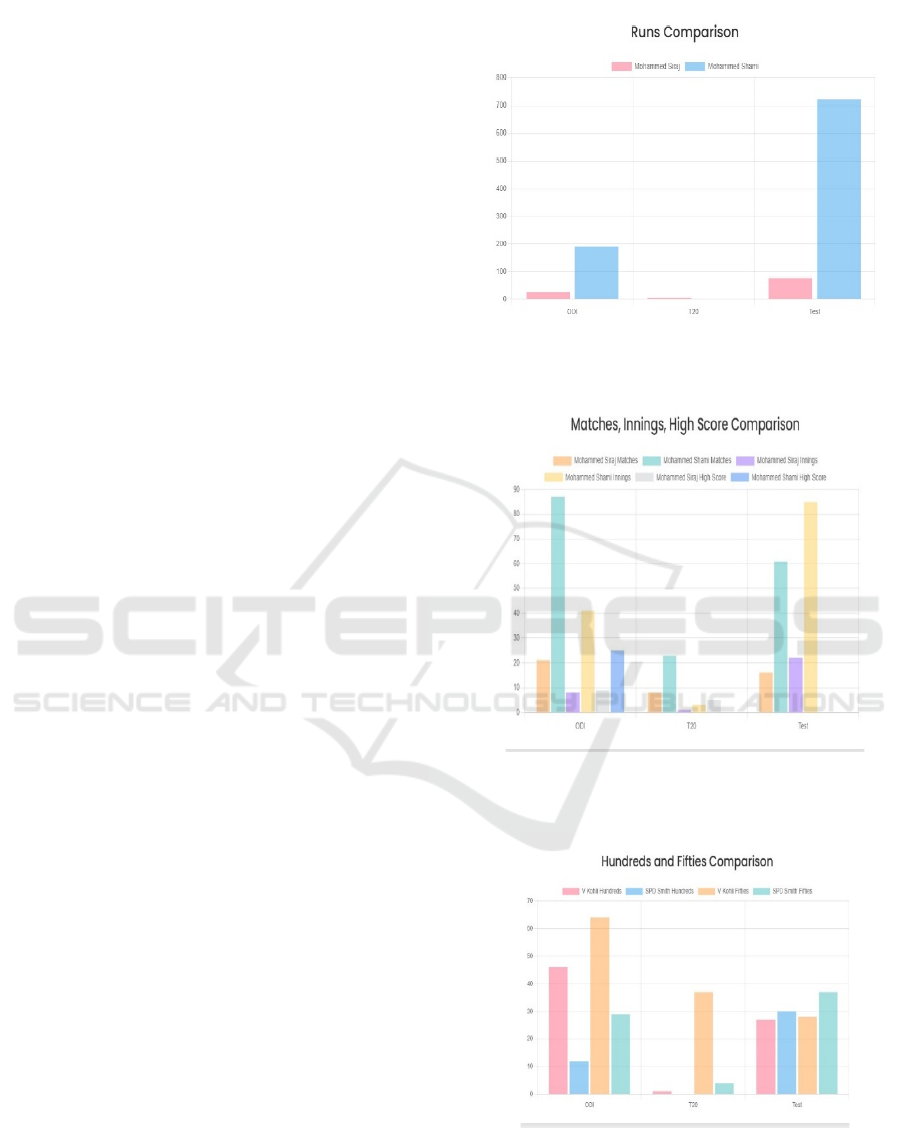
discussions. The Figures 1, 2, 4, 3, 5, 6 represents the
comparison of two cricket players in different aspects
of cricket.
Figure 1: Runs comparison between two players.
Figure 2: Matches, innings, high score comparison between
two players.
Figure 3: Hundreds and fifties comparison between two
players.
Cricket Analytics Hub: A Comprehensive Platform for Player Statistics and Comparative Analysis
545
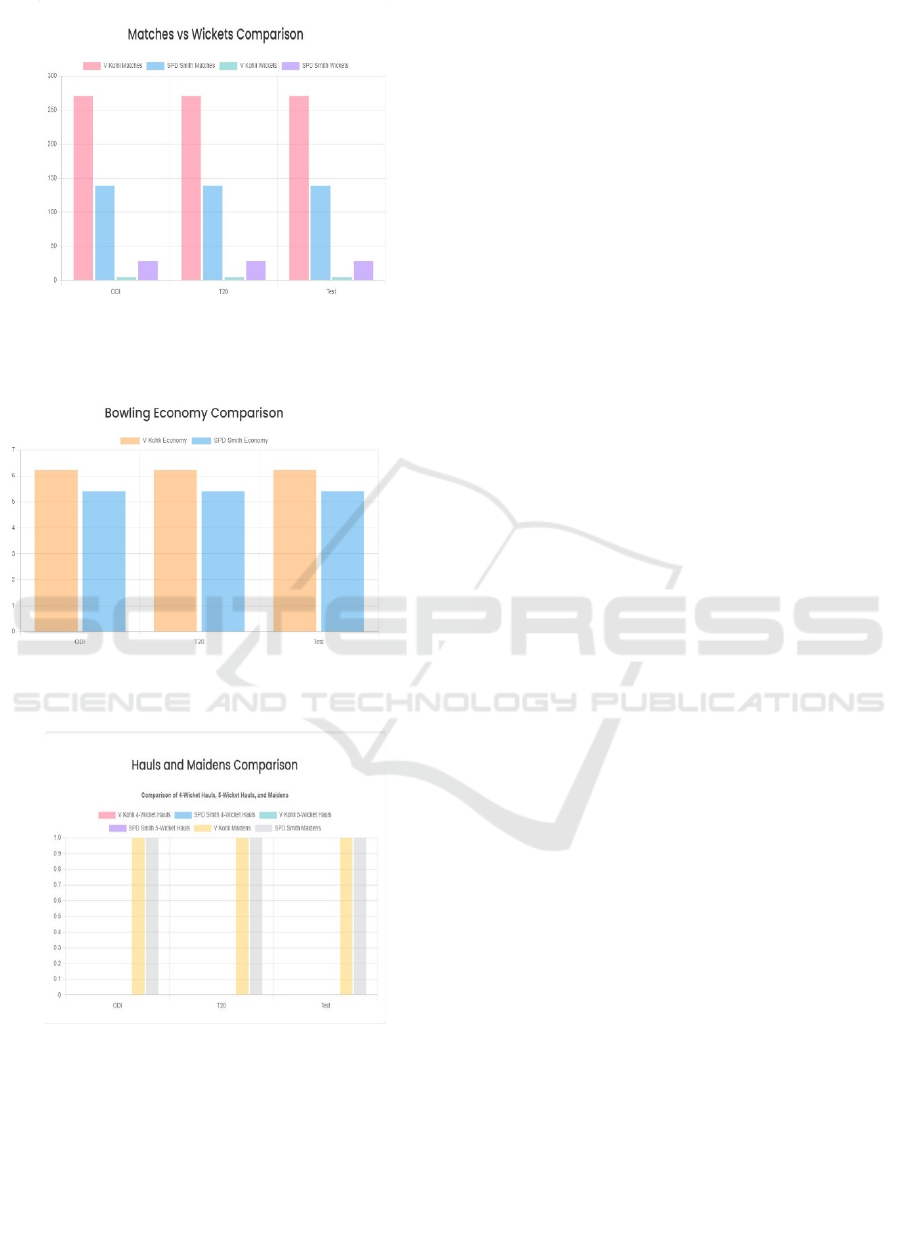
Figure 4: Matches and wickets comparison between two
players.
Figure 5: Bowling economy comparison between two
players.
Figure 6: Wicket hauls and maidens comparison between
two players.
5 CONCLUSIONS
”Cricket Analytics Hub,” developed and deployed
with the facilities to enable users to carry out overall
and dynamic comparisons of cricket players’
performances in different match formats. By
integrating detailed statistical metrics, interactive
visualizations, and user-friendly navigation, the
developed platform allowed a user to analyze the
performance of batsmen and bowlers in ODI, T20,
and Test cricket. The possibility of dynamically
switching be tween both batting and bowling data
leads to interactivity not typical for already existing
tools, thus increasing the user engagement and
enabling fine-grained performance analysis. This
study represents a comprehensive look at how
effective combining intuitive visualizations of data
with statistical insight really is. For example, the
inclusion of comparative bar charts for metrics such
as runs, strike rates, economy rates, and milestone
achievements (e.g., centuries and five-wicket hauls)
are presented in such a way that complex data
becomes very easily interpretable. In addition, the
features such as toggle buttons for dynamic data
exploration enhance the usability of the platform,
offering flexibility to users in terms of how they
interact with the data. With these features, a wide
range of users, including analysts, fans, and
journalists, have an easier, more interesting way to
analyze. It does have some bottlenecks, despite some
of the benefits derived from the platform. While it
gives exhaustive information on player performance
metrics, at present it is focused on mere statistical
comparison and not advanced predictive models or
machine learning algorithms that can help provide
further insights. The platform is built on pre-
aggregated data, which might reduce possibilities for
real-time updates or integrations with live data
streams. While the visualizations and tables really
help in using both the individual and comparative
metrics effectively, there’s always room for
improvement of the customization options for users-
for example, setting metrics of interest. Implications
brought about by this research will actually have a
huge effect on the field of sports analytics. The
platform democratizes access to cricket performance
data through a user-friendly, interactive analytical
tool and enables people who want to meaningfully
engage with cricket statistics to do so. This research
also puts into light the potentiality of combining data
science into sports platforms for an interactive and
scalable system-a scale beyond conventional static
data representation. Future work in this thread may
persist in several directions. This would need the
integration of machine learning algorithms for
predictive analytics on players’ performance
forecasts or even predicting match outcomes. This
could further be integrated with live, real-time data
through APIs from live cricket platforms for making
ICRDICCT‘25 2025 - INTERNATIONAL CONFERENCE ON RESEARCH AND DEVELOPMENT IN INFORMATION,
COMMUNICATION, AND COMPUTING TECHNOLOGIES
546

the platform useful even during live matches.
Additionally, if expanded to also include team-based
analytics, historical trend analysis, and performance
benchmarking against global averages, it would be all
the more comprehensive. Lastly, other features that
could be added are language localization and
compatibility with mobile applications to expand its
reach to a more global audience. The ”Cricket
Analytics Hub” forms a basic scaffold on which to
base interactive cricket analytics and opens up
avenues for further work in this direction.
Overcoming the limitations discussed and adding
cutting-edge analytical functionalities, this will be
developed into a versatile tool for any cricket
enthusiast, analyst, or professional and will form an
invaluable con tribution to the upcoming dimension
of sports analytics.
REFERENCES
Acharya, Kamal. (2022). "Cricket ManagementSystem Pr
oject Report." doi:10.13140/RG.2.2.25126.95042
Anderson, David R., Hane, Christopher A. (2013).
"Efficient SQL Based Multi-Attribute Clustering."
2013 IEEE International Conference on Big Data. doi:
10.1109/BigData.2013.6691743
Avijit, Bose., Sannoy, Mitra., Souham, Ghosh., Raima,
Ghosh., Tiyash, Patra., Satyajit, Chakrabarti. (2021).
"Unsupervised Learning Based Evaluation of Player
Performances." Innovations in Systems and Software
Engineering, 17(2), 121-130. doi: 10.1007/S11334-
020-00374-3
Bhagat, Krishna, Arjun Kumar Das, Sanskar Kumar
Agrahari, Samip Aanand Shah, Deepthi RT, and
Gayathri Ramasamy. "Cross-Language Comparative
Study and Performance Benchmarking of Sorting
Algorithms." Available at SSRN 5088751 (2024).
Bhagat, V., Jadhav, J., Dheemate, S., Shendkar, B. D.,
Mulani, S. (2024). "Personalized Cricket Player
Analysis by Live Scoring Utilizing Unsupervised
Machine Learning." 2024 MIT Art, Design and
Technology School of Computing InternationalConfer
ence (MITADTSoCiCon), Pune, India, pp. 1-6. doi:
10.1109/MITADTSoCiCon60330.2024.10575411
Chauhan, Nidhi Singh, Verma, Mandeep, Parasher, Ayushi,
Budhiraja, Aashwaath, Gaurav. (2019)."Implementatio
n of Database using Python Flask Framework: College
Database Management System." International Journal
of Engineering and Computer Science, 8, 24894-24899.
doi: 10.18535/ijecs/v8i12.4390.
Harshitha, G., Harsha, S., Madhu, N., Hemachandran, B.
(2022). "Performance Analysis of a Cricketer by Data
Visualization." International Journal for Research in
Applied Science and Engineering Technology
(IJRASET)
Kumar Agrahari, S., Kumar Das, A., Yadav, A., &
Ramasamy, G. (2024). NextGen Routing andScalabilit
y Enhancements in Mobile Ad HocNetworks. Availabl
e at SSRN 5089037.
M. A and S. S. A. (2024). "Navigating Player Performance
Clusters for Sports Excellence." 2024 International
Conference on Advances in Data Engineering and
Intelligent Computing Systems (ADICS), Chennai,
India, pp. 16. doi:10.1109/ADICS58448.2024.105336
18
Mansurali, A., Harish, V., Hussain, Sherin, Choudhury,
Tanupriya. (2023). "Profiling the IPL Players Sports
Analytics Through Clustering Algorithms." doi:10.100
7/978-981-99-1620-7_5
Mansurali, A., Harish, V., Hussain, Sherin, Choudhury,
Tanupriya. (2023). "Profiling the IPL Players Sports
Analytics Through Clustering Algorithms." Algorithms
for Intelligent Systems, 53-64. doi: 10.1007/978-981-
99-1620-7_5
Ojas, O., Vashishtha, A., Kumar Jha, S., Kumar Shah, V.,
Kumar, R., & Ramasamy, G. (2024). James: Enhancing
Judicial Efficiency with SmartAdministration. Availab
le at SSRN 5091509.
Ramasamy, G., Shaik, B. A., Kancharla, Y., & Manikanta,
A. R. (2025). A Bash-based approach to simulating
multi-process file systems: Design and implementation.
In Challenges in Information, Communication and
Computing Technology (pp. 200-206). CRC Press.
Ratnaparkhi, A., Ingale, A. (2024). "Cricket Data
Analytics." International Journal of InnovativeResearc
h in Science, Engineering and Technology, 13(5), 334-
341
Relan, Kunal. (2019). "Building REST APIs with Flask:
Create Python Web Services with MySQL." doi:
10.1007/978-1-4842-5022-8
Shinde, R., Ravatale, A., Khairnar, A., Kandesar, N.,
Sumathi, M., Prabu, S., Rajkamal, M. (2023). "Cricket
Players Performance Prediction and Evaluation Using
Machine Learning Algorithms." 2023 International
Conference on Networking and Communications(ICN
WC), Chennai, India, pp. 16. doi:10.1109/ICNWC578
52.2023.10127503
Suraya, Sholeh, Muhammad. (2021). "Designing and
Implementing a Database for Thesis Data Management
by Using the Python Flask Framework." International
Journal of Engineering, Science and Information
Technology, 2(1), 9-14. doi: 10.52088/ijesty.v2i1.197
Cricket Analytics Hub: A Comprehensive Platform for Player Statistics and Comparative Analysis
547
