
AI‑Based Fraud Detection System for Financial Transactions
P. Muntaj Begum, G. Lilly, K. Madhavi, B. Sabeena and S. Likhitha
Department of Computer Science and Engineering, Ravindra College of Engineering for Women, Kurnool, Andhra
Pradesh, India
Keywords: Fraud Detection, Anomaly Detection, Machine Learning, Artificial Intelligence, Financial Fraud, Credit Card
Fraud, Real‑Time Analytics, Cybersecurity, Fraud Prevention.
Abstract: In the rapidly evolving digital financial ecosystem, fraud detection remains a critical challenge due to the
increasing sophistication of fraudulent activities. This paper introduces Fraud Guard, an AI-based system
created to detect and prevent deceptive financial transactions. using machine learning techniques. The system
leverages Random Forest, Decision Tree, and Logistic Regression to analyze credit card transaction data,
ensuring high precision and recall in fraud detection. Advanced feature engineering, anomaly detection, and
external data sources like IP geolocation enhance its effectiveness. To solve key challenges, including
imbalanced datasets, real-time detection, and adaptive learning, the system integrates data analytics, artificial
intelligence, and deep learning to identify suspicious patterns while minimizing false positives. Fraud Guard
continuously evolves to detect emerging fraud trends, ensuring robust and scalable fraud prevention. By
implementing this AI-powered approach, financial institutions can enhance transaction security, safeguard
customer funds, and mitigate financial fraud risks, including Various types of fraud, including credit card
fraud, insurance fraud, securities fraud, insider trading, and money laundering.
1 INTRODUCTION
The banking sector has undergone significant
transformation since the introduction of Internet
banking in 1996 by Citibank and Wells Fargo Bank in
the United States (K. Yak, D. Tudeal 2011). This
innovation marked the beginning of online credit card
transactions, which have grown exponentially over
the past decade. The rise of e-commerce, online
payment systems, remote work, digital banking,
and social networking platforms has revolutionized
how individuals conduct financial activities (S.
Madan et al. 2021). However, this shift has also
created opportunities for fraudsters to exploit
vulnerabilities in online payment systems, leading
to an increase in fraudulent activities targeting
digital transactions (F.C. Yann 2018).
Advancements in digital technologies have
reshaped how people handle money, transitioning
from traditional physical payment methods to digital
platforms (V. Nath 2020). This transformation has
enabled economies to enhance productivity and
maintain competitive advantages through
technological integration (T. Pencarelli 2019).
Internet banking and online credit card transactions
now offer unparalleled convenience, allowing users to
manage their finances from home or office. A credit
card, as defined by (S.B.E. Raj 2011), is a plastic card
embedded with personal information issued by
financial institutions to facilitate global purchases
Credit card fraud happens when someone uses
another person’s card details without permission to
get money or property, either physically or digitally.
Such fraudulent activities often result in significant
financial losses, exacerbated by the ease of
committing fraud in online environments where
physical possession of the card is unnecessary (S.B.E.
Raj 2011).
The Bank of Ghana (BoG reported a staggering
548.0% year-on-year increase in credit card fraud
losses, rising from GH¢ 1.26 million ($250,000) in
2019 to 2020, with the amount increased to GH¢ 8.20
million (approximately $1.46 million) (V. Nath
2020). Fraud incidents span various payment
channels, with digital transactions experiencing the
highest growth. Checks, deposits, P2P transfers, wire
transactions, ACH transfers, online payments, bill
payments, card usage, and ATM operations (S.
Madan et al. 2021). Fraudsters use advanced methods
like VPN tunnels with Anchor-free software or fake
Begum, P. M., Lilly, G., Madhavi, K., Sabeena, B. and Likhitha, S.
AI-Based Fraud Detection System for Financial Transactions.
DOI: 10.5220/0013914200004919
Paper published under CC license (CC BY-NC-ND 4.0)
In Proceedings of the 1st International Conference on Research and Development in Information, Communication, and Computing Technologies (ICRDICCT‘25 2025) - Volume 4, pages
421-428
ISBN: 978-989-758-777-1
Proceedings Copyright © 2026 by SCITEPRESS – Science and Technology Publications, Lda.
421

identities, making detection and capture difficult
(F.C. Yann 2018).
To tackle these challenges, compliance and risk
management systems now use AI and machine
learning for fraud detection (S. Madan et al. 2021).
"Techniques like Decision Trees, Logistic
Regression, Random Forests, AdaBoost, XGBoost,
SVM, and LightGBM are effective for classification
and prediction in credit card fraud detection (T.
Pencarelli 2019). Supervised machine learning
models excel at identifying fraudulent transactions,
showing high performance for this task (S.B.E. Raj
2011).
This study compares XG-Boost, Logistic
Regression, and Random Forest to classify and
predict legitimate or fraudulent transactions. The
structure of the paper is as follows: Section 2 offers
an overview of relevant literature, Section 3 describes
the dataset, experimental configuration, and methods
employed, Section 4 showcases the analysis
outcomes are presented, followed by Section 5, which
explores the findings' implications, and Section 6,
which concludes with suggestions derived from the
study’s conclusions
2 LITERATURE REVIEW
Logistic regression is a statistical method employed
to predict binary outcomes. Unlike other methods,
explanatory variables do not necessitate to adhere to
a Normal Distribution or display low correlation
(B.G. Tabachnick et al. 1996). In logistic regression,
the outcome variable is qualitative, while explanatory
variables can be numerical or categorical. This
method has been widely adopted by researchers to
identify financial bankruptcies.
Decision trees are non-linear classification
methods that split a dataset into progressively finer
segments based on explanatory variables. At every
stage of the tree, the algorithm identifies the variable
that demonstrates the strongest relationship with the
target outcome, as determined by a specific criterion
(J.A. Michael et al. 1997). Being nonparametric,
decision trees do not assume any data distribution,
which allows them to be adaptable for managing both
numerical and categorical data structures. although,
decision trees are prone to overfitting when applied to
the entire dataset, which can lead to poor
generalization. Despite this limitation, they have
practical applications, such as spam email filtering
and identifying individuals at risk for certain diseases
within medical research.
Random forests, introduced by (L. Breiman, et al.
2001), enhance the bagging technique by introducing
additional randomness during tree construction.
While traditional decision trees select the best split
among all variables, random forests randomly select
a subset of variables at each node and choose the best
predictor from this subset. The final prediction is
determined by averaging the outputs produced by all
the trees. A random forest package in R facilitates the
implementation of these models (Liaw, M. Wiener
2002). One advantage of random forests is their ability
to measure the importance for each feature with
respect to the training dataset. Although, they might
show a bias toward Features having multiple levels
when handling categorical variables.
The Random forests identify applications in
various fields, including analyzing intricate
biological data within bioinformatics and performing
video segmentation and image classification for pixel
analysis.
The categories of credit card fraud identified by (O.
Citation 2009) include bankruptcy fraud, counterfeit
fraud, application fraud, and behavioral fraud.
Depending on the type of fraud encountered, banks
and credit card companies can design and implement
tailored preventive measures. To detect fraudulent
transactions across jurisdictions, Machine Learning
like Logistic Regression, Naive Bayes, Random
Forest, K-Nearest Neighbors, Gradient Boosting,
Support Vector Machines, and Neural Networks,
have been employed (A. Aditi et al. 2022). Using a
method based on feature importance to identify the
most significant features, Gradient Boosting achieved
an accuracy of 95.9%, outperforming other
algorithms.
A hybrid machine learning model combining
AdaBoost and majority voting strategies was
developed by (K. Randhawa et al. 2018) for credit
card fraud detection. Noise levels of 10 percent and
30 percent were introduced within the hybrid models
in order to test robustness. The majority voting
Method scored 0.942 under 30% noise, proving its
effectiveness in noisy environments. Similarly, (L.
Guanjun, et al. 2018) proposed two types of random
forests to model typical and abnormal transaction
behaviors. These models were tested on data from a
Chinese e- commerce company. Random forests
performed well on small datasets, but imbalanced
data reduced their effectiveness on larger ones (F.C.
Yann 2018).
In another study, (K. Ayorind) examined practical
methods to identify credit card scams, a significant
threat to financial organizations. The machine
learning algorithms were trained with under sampling
and oversampling. The Random Forest, XGBoost,
ICRDICCT‘25 2025 - INTERNATIONAL CONFERENCE ON RESEARCH AND DEVELOPMENT IN INFORMATION,
COMMUNICATION, AND COMPUTING TECHNOLOGIES
422
and Decision Tree performed best, with AUC values
of 1.00, 0.99, and 0.99, respectively.
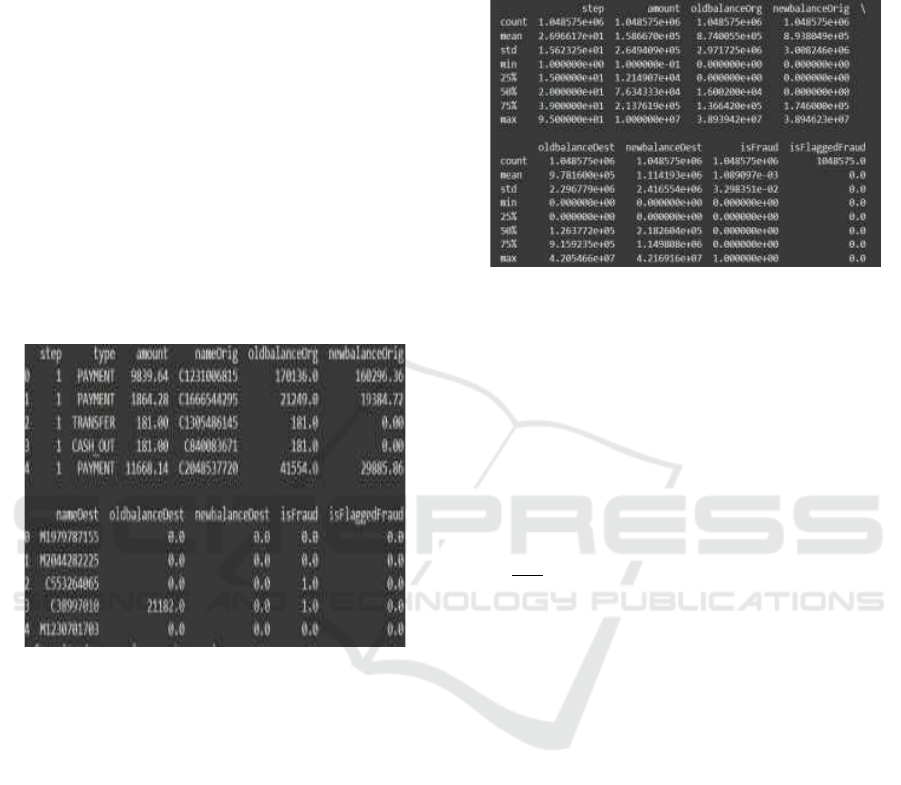
2.1 Data and Module Data
The dataset contains 6,354,739 rows of simulated
online
payment transactions, featuring attributes like
transaction type (CASH_IN, CASH_OUT,
etc.),
amount, account balances, and fraud labels (is Fraud),
with a highly imbalanced distribution of fraudulent
activities. It includes temporal information (step) and
detailed sender/recipient balance changes, enabling
the analysis of transaction patterns and anomalies
indicative of fraud. This dataset is ideal for training
machine learning models to classify legitimate versus
fraudulent transactions while addressing challenges
like class imbalance and feature engineering. Figure
1 represents the information of the dataset.
Figure 1: Information of the dataset.
2.2 Data Pre-Processing
During pre-processing, the Kaggle dataset was
refined and organized to remove null values for a
complete Evaluation. A clean dataset may be created
by transforming raw data via data pre-processing. To
put it another way, it is not fair to evaluate data that
has not been processed when it is collected from
several sources. Dataset adjustments done before
feeding the algorithm are known as pre-processing.
The key pre-processing steps are as follows:
• Missing and Null Values: Managing null
values is an essential part of data preparation.
Imputation and removal techniques are used
to handle missing data properly. This
ensures the honesty and quality of the dataset
before performing analysis or modeling
activities in research processes.
• Encoding Categorical Variables:
Typically, a collection of predetermined
categories is used to describe a variable's
possible values. Figure 2 shows the basic
statistics for the numeric variables.
Figure 2: Basic statistics for the numeric variables.
2.3 Data Scaling
Scaling is important for removing the noise of the
data. In this, data scaling is processed using a standard
scalar. Standard scalar makes use of z-score
normalization so that all values are converted to a
specific range. A widely used method for data
standardization is the Z-score normalization (Equ.1),
which can be defined as:
Z=
(
(1)
2.4 Data Balancing
A class imbalance issue occurs when there is an
excessive amount of data from one class about other
classes in a dataset. The majority of datasets used in
real-world applications have this kind of class
distribution, where several labels for one class are
much higher than several labels for another. The most
common methods for addressing the issue of class
imbalance may be broadly grouped into three types:
sampling/resampling, ensemble learning, and cost-
sensitive learning.
2.4.1 Feature Extraction
Feature extraction involves sorting all data into
categories after extracting the most important and
relevant information (FRAUD Kayode Ayorinde
2021). Collecting all important data or minimizing its
loss is of the utmost importance when dealing with a
big dataset. Feature extraction is a useful tool for
managing crucial data from large raw datasets and
lowering the incidence of data loss (V. Bolón-Canedo
AI-Based Fraud Detection System for Financial Transactions
423

et al. 2014). Several issues arise from a huge dataset.
Overfitting to training data occurs, and the model's
performance drops. It also uses a lot of memory and
runs slowly on processing resources. This is why
feature extraction is so useful; it uses the original
dataset to extract all the nonredundant values.
2.5 Models
2.5.1 Random Forest (RF)
The Random Forest Classifier was applied to detect
fraudulent transactions by constructing multiple
decision trees and aggregating their predictions. The
prediction function of Random Forest is given by:
𝑃
(
𝑌=1
|
𝑋
)
=
∑
ℎ
(𝑋) (2)
where ℎ
𝑡(𝑥)
represents the prediction from the
𝑡
𝑡ℎ
decision
tree, and T represents the total count of
decision trees within the forest. Each tree was trained
on a random subset of data using bootstrap sampling,
reducing overfitting and improving generalization.
The entropy criterion was used for splitting nodes,
ensuring optimal decision boundaries. The model's
performance was evaluated using the ROC- AUC
score, with separate calculations for the training and
validation datasets. A confusion matrix was plotted to
assess classification results, showing correct and
incorrect fraud predictions.
2.5.2 Logistic Regression (LR)
The Logistic Regression model was trained to
classify transactions as fraudulent or non-fraudulent.
The function is Defined as:
P
(
Y=1
∣
X
)
=
(
…
)
(3)
where P(Y=1∣X) represents the probability of
fraud, 𝛽
0
is the intercept, and 𝛽
1
, 𝛽
2,……
, 𝛽
𝑛
are the
coefficients for input features. 𝑋
1
, 𝑋
2
, … … . , 𝑋
𝑛
.The
model was evaluated using the
ROC- AUC score,
which measures the ability to distinguish fraudulent
from non-fraudulent transactions. The training ROC-
AUC score assessed model fit, while the validation
score showed performance on unseen data. The
confusion matrix further visualized the model's
classification performance, identifying correct and
incorrect fraud predictions.
2.5.3 XGBOOST Classifier
The XGBoost Classifier was trained on the dataset to
detect fraudulent transactions, and its performance
was evaluated using the ROC-AUC score. The
model. achieved a high ROC- AUC score, calculated
using the formula:
ROC − AUC =
∑∑
1(S
∈
∈
>S
) (4)
(4)
where 𝑁
0
and 𝑁
1
are the numbers of negative and
positive samples, and 𝑠
𝑖
and 𝑠
𝑗
are the predicted scores
for positive
and negative instances, respectively. The
XGBoost model's training ROC-AUC score was
significantly high, indicating excellent discrimination
between fraudulent and non-fraudulent transactions.
The confusion matrix showed the model’s accuracy
in classifying transactions, with few false positives
and negatives.
3 MODEL EVALUATION
An important aspect of developing a model is
evaluating it. Finding the optimal model to describe
our data and gauging the model's future performance
are both aided by this.
a) Confusion Matrix
The confusion matrix compares the actual classes
with the projected classes and displays the results in
tabular form. It shows how many samples were taken
from each quadrant. The model's projected True
Negatives, False Negatives,
3.1 Precision
Precision, also called positive predictive value, is the
ratio of true positives to all positive predictions.
𝑃𝑟𝑒𝑐𝑖𝑠𝑖𝑜𝑛 =
(5)
3.2 Recall
Equation 7 shows how to compute it by splitting a
proper positive number by the total number of
samples, which is a positive number.
𝑅𝑒𝑐𝑎𝑙𝑙 =
(6)
3.3 F1-Score
As shown, precision is determined by dividing the
total number of positive outcomes that were achieved
by the total number of positive results that were
predicted by the classifier.
ICRDICCT‘25 2025 - INTERNATIONAL CONFERENCE ON RESEARCH AND DEVELOPMENT IN INFORMATION,
COMMUNICATION, AND COMPUTING TECHNOLOGIES
424

𝐹1−𝑆𝑐𝑜𝑟𝑒=
∗∗
(7)
True Positives, and False Positives may be better
understood
with this information. This helps in
determining the model's accuracy in the classification
task. Figure 3 represented below is a confusion
matrix.
Figure 3: Confusion matrix.
• True Positive (TP): The number of
correctly detected with Np denoting an
amount of data at node Np and |Ni| denoting
an amount of data at node Ni, the data with
the 𝑗
𝑡ℎ
label as a percentage of the total data
at node Np is represented by Pj, and the
inequality 0 ≤ I ≤ c. indicates several positive
records are shown by TP.
• False Positive (FP): The FP proportion
represents the count of samples incorrectly
labeled as positive True Negative (TN): TN
displays the quantity of accurately identified
negative records. False Negative (FN): FN
refers to the count of positive samples
wrongly labeled as negative.
3.4 Accuracy
The main performance assessment parameter is
accuracy, which calculates a proportion of accurate
predictions to all of a classifier's predictions. may be
used to present it.
𝐴𝑐𝑐𝑢𝑟𝑎𝑐𝑦 =
(8)
4 RESULT ANALYSIS AND
DISCUSSION
A comparative analysis of fraud identification and the
prevention of financial transactions based on machine
learning approaches is provided in this section. The
analysis conducted four evaluation metrics, which
were performed: F1-Score, Accuracy, Precision, and
Recall. Some DL models were used. The table below
shows the comparison of different machines.
4.1 Exploratory Data Analysis
To better understand a data set's structure, trends, and
linkages, data scientists must first do exploratory data
analysis, often known as EDA. Exploratory Data
Analysis (EDA) empowers data scientists to reveal
the essential characteristics of data, pinpoint outliers,
analyze the distribution of features, andmercury is the
closest planet to sunM identify missing values. A key
advantage of EDA is its ability to improve the
performance and reliability of predictive models.
Figure 4 shows the visualization of data is provided
below.
Figure 4: Co-relation matrix of the dataset.
Figure 5: Count plot for label.
The bar chart represents the count of different
transaction categories. The x-axis indicates the
transaction categories, and the y-axis indicates the
count of every type. Below is the description of the
data figure 5 shown in the chart:
PAYMENT: Approximately 350,000 transactions.
TRANSFER: Around 90,000 transactions.
CASH_OUT: The highest, with more than 370,000
transactions.
DEBIT: The least, with a very small count. CASH_IN:
About 200,000 transactions.
This visualization shows that CASH_OUT and
PAYMENT transactions are the most frequent, while
AI-Based Fraud Detection System for Financial Transactions
425
DEBIT transactions are the least common.
4.2 Experiment Results
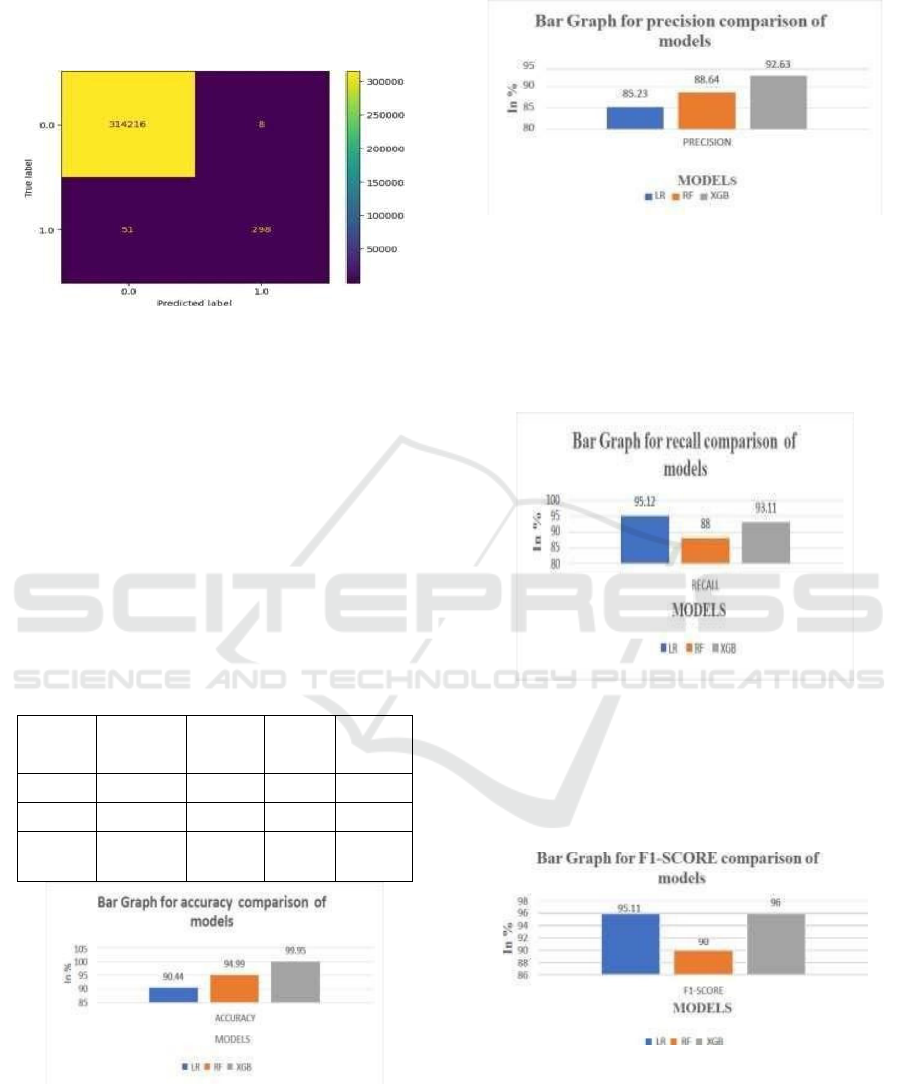
Figure 6: Confusion matrix for XGBoost.
The confusion matrix shows that the model correctly
classified 314,216 negative cases (TN)and 298
positive cases (TP). It misclassified 8 negatives as
positives (FP) and 51 positives as negatives (FN). The
model achieved 99.98% accuracy, with 97.38%
precision and 85.38% recall for the positive class.
While the model performs well overall, it misses
some actual positive cases, leading to a slightly lower
recall. Improving the recall for the positive class
could enhance the model’s ability to detect more true
positive instances. Table 1 shows the comparison
between various models.
Table 1: Comparison between various models.
Models Accuracy
Precisio
n
Recall
F1-
Score
RF 94.99 88.64 95.12 76
LR 90.44 85.23 72.56 78.63
XGB 99.95 92.38 88.26 90.63
Figure 7: Bar graph of accuracy comparison of models.
The bar graph comparing the accuracy of many
models is shown in Figure 7. In the accuracy
comparison, XGB scores highest at 99%, followed by
RF at 94.99% and LR at 90.44%. This indicates XGB
is the most accurate model compared to other models.
Figure 8: Bar graph of precision comparison of models.
The above figure 8 shows the comparison model for
the precision bar graph of different models. In this,
XGB achieves the highest precision of 92.63, and the
lowest precision is of the Logistic Regression with
85.23%
Figure 9: Bar graph for recall comparison of models.
The following figure 9 shows the Bar Graph for the
Recall comparison of models. In this comparison, LR
recall of 95.12%, and XGB recall is 93.11%. While
Random Forest (RF)shows the lowest recall at 88.
Figure 10: Bar chart for F1-score comparison across
models.
Figure 10 presents a comparison of F1-Scores
across various models. XGB Classifier achieves the
highest F1- score of 96%, showing a strong balance
between precision and recall. Logistic Regression
ICRDICCT‘25 2025 - INTERNATIONAL CONFERENCE ON RESEARCH AND DEVELOPMENT IN INFORMATION,
COMMUNICATION, AND COMPUTING TECHNOLOGIES
426

(LR) follows closely with an F1-score of 95.11%.
Finally, the comparison of the F1- score sheds light on
the models’ total performance in terms of
classification accuracy with the overall F1-score that
seems to accurately measure the quality of the models
achieving high scores for both precision and recall.
5 CONCLUSIONS AND FUTURE
SCOPE
The advancement in technologies and the growing
adoption of electronic financial transactions have
significantly increased the risk of fraudulent activities
due to simplified verification processes. In this study,
we analyzed a dataset comprising 284,807 credit card
transactions from European users. For fraud
detection, the dataset was split into 80% training and
20% testing data to build and evaluate models.
Preprocessing steps included Z-score normalization
for standardization, one-hot encoding for categorical
variables, and handling missing values through
appropriate techniques.
To assess the performance of various machine
learning models, we utilized key evaluation metrics:
accuracy, precision, recall, F1 score, and the confusion
matrix. Among the models tested, the XGBoost
Classifier demonstrated superior performance. While
the accuracy of the XGBoost model reached an
impressive 99%, further analysis revealed that
precision and recall were critical in addressing the
misclassification rate, particularly for the minority
class (fraudulent transactions).
The confusion matrix highlighted the model's
ability to correctly classify the majority of genuine
transactions while maintaining a reasonable balance
in detecting fraudulent cases. However, the results
underscore the importance of selecting the most
appropriate evaluation criterion—such as recall or F1
score to ensure effective fraud detection, especially in
imbalanced datasets like this one.
One limitation of this study is that the dataset was
collected over only two trading days, which may not
fully capture long-term trends or variations in
fraudulent behavior. Future research could address
this by incorporating a more extensive and diverse
collection of fraudulent transactions and exploring
advanced deep-learning algorithms to enhance fraud
detection rates and improve resistance to emerging
fraud techniques.
REFERENCES
A. Liaw, M. Wiener, Classification and regression by
random Forest, R News 2(3) (2002) 18–22.
A. Aditi, A. Dubey, A. Mathur, P. Garg, Credit Card Fraud
Detection Using Advanced Machine Learning
Techniques. (2022), 56–60.
http://dx.doi.org/10.1109/ccict56684.2022.00022.
B. G. Tabachnick, L.S. Fidell, Using Multivariate Statistics,
Harper Collins, New York, 1996.
F. C. Yann-a, Streaming active learning strategies for real-
life credit card fraud detection: Assessment and
visualization, 2018.
J. A. Michael, S.L. Gordon, Data Mining Technique for
Marketing, Sales and Customer Support, John Wiley &
Sons INC, New York, 1997, p. 445.
K. Yak, D. Tudeal, Internet Banking Development as A
Means of Providing Efficient Financial Services in
South Sudan. 2 (2011) 139–148.
K. Randhawa, C.H.U.K. Loo, S. Member, Credit card fraud
detection using AdaBoost and majority voting, IEEE
Access 6 (2018) 14277– 14284,
http://dx.doi.org/10.1109/ACCESS.2018.2806420.
K. Ayorinde, Cornerstone: A Collection of Scholarly and
Creative Works for Minnesota State University,
Mankato a Methodology for Detecting Credit Card
Fraud- Kayode Ayorinde (Thesis Master’s), Data
Science Minnesota State University Mankato, MN,
2021.
L. Breiman, Random forests, Mach. Learn. 45 (1) (2001)5–
32.
L. Guanjun, L. Zhenchuan, Z. Lutao, W. Shuo, Random
Forest for credit card fraud, IEEE Access (2018).
N. K. Trivedi, S. Simaiya, U. K. Lilhore, and S. K. Sharma,
“An efficient credit card fraud detection model based
on machine learning methods,” Int. J. Adv. Sci.
Technol., 2020.
N. S. Alfaiz and S. M. Fati, “Enhanced Credit Card Fraud
Detection Model Using Machine Learning,” Electron.,
2022, doi: 10.3390/electronics11040662.
O. Citation, B. Systems, University of Huddersfield
Repository Credit card fraud and detection techniques:
a review, 2009.
S. B. E. Raj, A.A. Portia, A. Sg, Analysis on Credit Card
Fraud Detection Methods. (2011) 152–156.
S. Madan, S. Sofat, D. Bansal, Tools and Techniques for
Collection and Analysis of Internet-of-Things malware:
A systematic state-of-art review, J. King
SaudUniv.Comput.Inf.Sci.(2021)xxxx,http://dx.doi.or
g/10.1016/j.jksuci.2021.12.016.
T. Pencarelli, The digital revolution in the travel and
tourism industry, Inf. Technol. Tourism (2019)
0123456789, http://dx.doi.org/10.1007/s40558-019-
00160-3.
V. Bolón-Canedo, N. Sánchez-Maroño, A. Alonso-
Betanzos, J. M. Benítez, and F. Herrera, “A review of
microarray datasets and applied feature selection
methods,” Inf. Sci. (Ny)., 2014, doi:
10.1016/j.ins.2014.05.042.
AI-Based Fraud Detection System for Financial Transactions
427

V. Nath, ScienceDirect credit card fraud detection using
machine learning algorithms credit card fraud detection
using machine learning algorithms, Procedia
Comput.Sci.165(2020)631–641,
V. Rohilla, S. Chakraborty, and R. Kumar, “Deep learning-
based feature extraction and a bidirectional hybrid
optimized model for location-based advertising,”
Multimed. Tools Appl., 2022, doi: 10.1007/s11042-
022-12457-3.
ICRDICCT‘25 2025 - INTERNATIONAL CONFERENCE ON RESEARCH AND DEVELOPMENT IN INFORMATION,
COMMUNICATION, AND COMPUTING TECHNOLOGIES
428
