
Comparative Analysis of Stock Price Prediction Models
Ch Amarendra, K. Parimala, R. Shivateja, B. Finney Vivek and K. Jashuva
Department of Advanced Computer Science and Engineering, Vignan's Foundation for Science, Technology & Research
(Deemed to be University), Vadlamudi, Guntur (Dt), Andhra Pradesh, India
Keywords: Long Short‑Term Memory (LSTM), Linear Regression, Moving Average, Mean Squared Error (MSE), R
Squared Error.
Abstract: Stock price prediction is the process of forecasting the future movements and trends in stock prices. It plays
a vital role in financial markets as it helps investors, traders, and financial institutions make informed
decisions regarding buying, selling, or holding stocks. It involves analysing historical price data, market
trends, economic indicators, and other relevant factors to develop predictive models. However, due to the
inherent complexities and uncertainties of financial markets, correctly forecasting stock values is a difficult
task. To improve prediction accuracy many machine learning techniques have been proposed. In this study,
the effectiveness of three alternative stock price prediction techniques like Linear Regression, Moving
Average, and Long Short-Term Memory are compared using the JPMorgan stock price prediction dataset.
The study’s findings demonstrate that the LSTM method forecasts stock prices more accurately than moving
average and linear regression by obtaining the lowest MSE of better prediction precision and a greater R
squared value of a small model-data fit. Performance of these approaches is assessed using the R-squared
error and Mean Squared Error (MSE).
1 INTRODUCTION
Stock price prediction is a critical area of research in
financial markets, aiming to forecast future
movements and trends in stock prices. Accurate
prediction of stock prices has significant implications
for investors, traders, and financial institutions,
enabling them to make informed decisions and devise
effective investment strategies. The complex and
dynamic nature of stock price data is often difficult to
capture using traditional methods for stock price
prediction, such as statistical models and technical
indicators. The primary goal of this study is to
compare the performance of different prediction
methods, including LSTM, Moving Average, and
Linear Regression, in forecasting stock prices.
Because of its ability to recognise long-term
dependencies and non-linear patterns in sequential
data, LSTM networks, a type of recurrent neural
networks, have become highly effective in time series
forecasting. Moving Average, on the other hand, is a
simple and widely used method that calculates the
average of a certain number of previous stock prices
to make predictions. Linear Regression, a classical
statistical technique, fits a linear equation to historical
price data to estimate future prices. Performance
measures like Mean Squared Error (MSE) and R-
squared are used to assess these approaches. The
accuracy of the model is demonstrated by the MSE,
which calculates the average squared difference
between the anticipated and actual stock values. The
percentage of variance in the stock prices and
predictors represented by the R-squared number
indicates how well the model fits the data. By
comparing the performance of these methods, we aim
to identify the most effective approach for stock price
prediction. The findings of this study can contribute
to the field of financial forecasting, providing
valuable insights for investors and financial
professionals in their decision-making processes.
Furthermore, it offers insights into the effectiveness
of different prediction techniques. By comparing the
performance of LSTM, Moving Average, and Linear
Regression, investors and financial professionals can
gain a better understanding of the most suitable
approach for forecasting stock prices. During the
stock price prediction process using the code
provided, various algorithms or models are
considered and evaluated. Firstly, the data is pre-
processed using a MinMaxScaler to bring them
176
Amarendra, C., Parimala, K., Shivateja, R., Vivek, B. F. and Jashuva, K.
Comparative Analysis of Stock Price Prediction Models.
DOI: 10.5220/0013909800004919
Paper published under CC license (CC BY-NC-ND 4.0)
In Proceedings of the 1st International Conference on Research and Development in Information, Communication, and Computing Technologies (ICRDICCT‘25 2025) - Volume 4, pages
176-181
ISBN: 978-989-758-777-1
Proceedings Copyright © 2025 by SCITEPRESS – Science and Technology Publications, Lda.

within a specific range. Each algorithm is trained on
the pre-processed data to learn the patterns and
relationships between stock prices. Subsequently, the
trained models are tested on a dataset to assess their
performance and accuracy in predicting stock prices.
Evaluation metrics such as Mean Squared Error
(MSE) and R-squared are utilized to quantify the
performance of each algorithm. The remainder of the
paper is divided into the following sections. There is
a comprehensive literature review in Section II. The
methodology is explained in Section III. A dataset that
was utilised in our studies is provided in Section IV,
together with a thorough analysis of the outcomes,
which compares the effectiveness of the various
models. The implications of our conclusions are
covered in Section V. Finally, Section VI summarises
our findings and provides potential directions for
further investigation.
2 LITERATURE SURVEY
In recent years, stock price prediction has attracted
significant attention in the field of finance and
machine learning. Researchers have explored various
techniques, including Long Short-Term Memory
(LSTM) models, to capture the complex dynamics of
stock market data and improve forecasting accuracy.
Cheung and Chong (1995) used support vector
machines and moving averages to empirically analyse
stock prices. They investigated how well these
techniques predicted changes in stock prices.
According to the study’s findings, moving average
and support vector machines can give investors
important information about short-term stock price
patterns and aid in their decision-making.
Hochreiter and Schmidhuber (1997) introduced
LSTM models as a powerful tool for learning and
retaining long term dependencies in sequential data.
Their significant work laid the foundation for
LSTM’s application in various domains, including
stock price prediction.
Fabozzi, Focardi, and Kolm (2012) presented a
com prehensive book on financial econometrics,
covering various modelling techniques for analysing
financial data. The book provides a comprehensive
overview of the basics and advanced concepts in
financial econometrics, including the application of
statistical methods like moving averages and
regression models for forecasting stock prices.
Al-Yaseen and Sathasivam (2019) proposed a
novel time series prediction algorithm utilizing
LSTM models for stock market forecasting. Their
study showcased the effectiveness of LSTM models
in capturing the underlying dynamics of stock prices
and outperforming traditional approaches.
Lim and Kim (2019) investigated the application
of LSTM-based deep learning models specifically for
stock price prediction. They emphasized the
robustness and accuracy of LSTM models in
capturing complex relationships and patterns in stock
market data, highlighting the superiority of deep
learning over traditional forecasting methods.
Zhang and Li (2020) focused specifically on
forecasting stock prices using LSTM models. Their
research provided insights into the design and
hyperparameter tuning of LSTM models, leading to
improved prediction accuracy.
3 EXISTING SOLUTIONS
Traditional stock price prediction methods have relied
primarily on Linear Regression and Moving Average
techniques. Linear Regression fits a linear
relationship between past stock prices and time, but it
assumes that stock prices follow a linear trend, which
is rarely the case in the highly volatile and non-linear
nature of stock markets. Moving Average smooths,
the data by averaging prices over a period, but it
suffers from lagging and fails to adapt to rapid market
changes, resulting in inaccurate forecasts.
These conventional models struggle with:
• Inability to capture complex non-linear
dependencies.
• Poor performance on datasets with long-
term temporal dependencies.
• Susceptibility to noise and sudden market
fluctuations.
• Limited capacity to model sequential
patterns in financial time-series data.
Due to these limitations, there is a significant gap
in developing models capable of learning and
adapting to the dynamic and stochastic behaviour of
stock prices.
4 PROPOSED SOLUTIONS
To overcome the shortcomings of traditional models,
the proposed solution leverages a Long Short-Term
Memory (LSTM) Neural Network for stock price
prediction. LSTM is designed to handle sequential
and time-series data, making it suitable for stock
market forecasting. LSTM can capture long-term
dependencies, retain useful information over
Comparative Analysis of Stock Price Prediction Models
177

extended periods, and effectively model non-linear
relationships between variables.
The proposed LSTM-based approach provides:
• Superior prediction accuracy by learning
patterns that span longer timeframes.
• Better handling of non-linearity and
volatility present in financial markets.
• Memory cells and gating mechanisms that
prevent vanishing gradient problems,
common in traditional RNNs.
• Reduction of prediction errors as
demonstrated by lower Mean Squared Error
(MSE) and higher R-Squared (R²) values
compared to Linear Regression and Moving
Average.
By adopting LSTM, the system achieves a more
reliable and efficient stock price prediction model,
suitable for practical financial decision-making.
5 METHODOLOGY
5.1 Moving Average
A typical stock indicator in technical analysis is the
moving average. By producing a continuously
updated average price, the moving average of a stock
is calculated to in smoothing out the price data and
enabling rice data and enable analysts to see trends
and patterns. The moving average generates a
smoothed line that where represents the mean price
across a defined time frame. Traders and analysts use
it to identify stock market trends. For example, When
the present market value exceeds the moving average,
it may signal an ascending trend, whereas a price
falling below the moving average could indicate a
descending trend. Additionally, many traders utilize
the intersection of various moving averages as a
method to generate trading cues. For instance, the
intersection of a brief-term moving average rising
above an extended-term moving average might be
interpreted as a positive market signal, potentially
indicating a favourable moment for investment.
𝑀𝐴 =
∑
(1)
The limitations of this moving average are lagging
indicators because they are based on historical price
data, sensitivity to timeframes as different timeframes
can produce varying moving average results, rely on
price data and do not take into account other critical
factors that influence the stock market, such as
fundamental analysis, news events, economic indica
tors, and investor sentiment, in volatile or choppy
markets with frequent price fluctuations and no clear
trend that may generate false or conflicting signals,
These calculations rely on past data, which may not
accurately represent present or upcoming market
trends.
5.2 Linear Regression
Linear regression is a statistical technique commonly
used for stock market predictions. It involves fitting a
straight line to historical price data to estimate future
price movements. Linear regression is a relatively
simple and straightforward statistical technique. It is
easy to understand and implement, making it
accessible to both beginners and experienced
analysts. It provides interpretable results. This model
is trained and applied quickly, allowing for rapid
analysis and prediction. Linear regression can help
identify relevant independent variables that influence
stock price movements. By examining the
coefficients, analysts can determine which variables
have a significant impact on the target variable, aiding
in feature selection and model refinement.
𝑦 = 𝛽0 + 𝛽1𝑥1 + 𝛽2𝑥2 +··· +𝛽𝑛𝑥𝑛 (2)
The target variable and the independent variables
are assumed to have a linear relationship using linear
regression. However, stock market data often exhibits
nonlinear patterns and complexities, which may limit
the accuracy of predictions using linear regression
alone. To enhance predictions, additional techniques
such as polynomial regression, time series analysis,
or machine learning algorithms can be employed to
capture nonlinear relationships and incorporate more
sophisticated modelling approaches.
5.3 LSTM
The purpose of LSTMs is to capture long-term
dependencies and patterns in sequential data. Unlike
moving averages and linear regression, which do not
inherently consider the sequential nature of the data,
LSTMs can learn from the historical sequence of
stock prices and capture complex temporal
relationships. Stock price movements often exhibit
nonlinear patterns, which can be challenging to
capture with linear regression. LSTMs, with their
ability to model complex nonlinear relationships, can
capture the intricate dynamics of the stock market by
leveraging the memory cells and gating mechanisms
within the LSTM architecture. Moving averages and
linear regression often rely on a limited set of
ICRDICCT‘25 2025 - INTERNATIONAL CONFERENCE ON RESEARCH AND DEVELOPMENT IN INFORMATION,
COMMUNICATION, AND COMPUTING TECHNOLOGIES
178

features, such as historical prices or technical in
dicators. LSTMs have the capability to automatically
identify and extract relevant features from raw data
inputs. This allows them to potentially uncover more
subtle and meaningful patterns that may not be
immediately obvious or captured by alternative
methods. LSTMs have an advantage over simple
moving averages and linear regression when dealing
with long-term dependencies. They are equipped with
memory cells that can store and recall information
over extended time periods, allowing them to capture
dependencies that occurred further back in time,
which is particularly valuable for stock price
prediction. LSTMs A. Data Preprocessing can adapt
and learn from changing market conditions by
continuously updating their weights and biases during
training. This adaptability enables the model to adjust
to new patterns and trends in the stock market,
making it more robust to evolving market dynamics
compared to fixed formulas like moving averages or
linear regression. Unlike fixed length moving
averages or regression models, LSTMs can handle
sequential data of varying lengths. This flexibility is
essential in stock price prediction, as historical price
data may have different time spans, irregular
intervals, or missing data points. LSTMs can
incorporate additional contextual information, such
as news sentiment, market indicators, or
macroeconomic factors, alongside historical price
data. This broader set of input features allows the
model to capture more comprehensive information
and potentially improve prediction accuracy. Figure 1
shows the workflow of LSTM whereas Figure 2
shows the Moving Average and Linear Regression.
Figure 1: Workflow of LSTM.
Figure 2: Workflow of moving average and linear
regression.
6 EXPERIMENTAL RESULTS
6.1 Data Set Summary
The data set includes columns for date, which
includes the open and close dates for stock market
data. When trading begins, the stock’s initial price;
during the trading session, the stock’s maximum
value attained; throughout the trading period, the
stock’s minimum value reached; and at the conclusion
of trading, the stock’s final price, as well as volume,
or the total number of shares or contracts exchanged
on the day. The dataset’s Open column was chosen as
the target variable for processing and training the
LSTM model, which was then used to the test set to
provide predictions.
6.2 Evaluation Metrics
Mean Squared Error (MSE) computes the average of
the squared disparities between predicted and actual
values. This metric assesses the overall prediction
error, with lower MSE scores indicating higher
prediction accuracy.
𝑀𝑆𝐸 = (1/𝑛) ∑(𝑦
−𝑦
)2
(3)
where n is the total number of predictions, y
predict
is the predicted value, and y
actual
is the actual value.
R-Squared calculates the share of the model’s
independent variables (predictors) that can be used to
explain the variance in the dependent variable (stock
market values). It indicates how well the model fits
the information.
𝑅
= 1 − (𝑅𝑆𝑆/𝑇𝑆𝑆) (4)
Where TSS and RSS are given by
𝑇𝑆𝑆 = ∑(𝑦
,𝑖−𝑦)2 (5)
Comparative Analysis of Stock Price Prediction Models
179
𝑅𝑆𝑆 = ∑(𝑦
,𝑖− 𝑦
,𝑖)2
(6)
R
2
ranges from 0 to 1, where a value of 0 means
that the model explains no variation and a value of 1
means that it fits the data perfectly. Higher R
2
values
show a better fit between the model and the data.
Table 1: Evaluation of Models on JP Morgan Stock Price
Dataset.
Method MSE R Square
Linear Regression 56.8002 0.8638
Moving Average 175.4034 0.6037
LSTM 27.9309 0.9369
Table-1 shows that LSTM performs best with the
lowest MSE of 27.9309 and the highest R-Square of
0.9369, indicating strong predictive accuracy. Linear
Regression performs moderately, while the Moving
Average method has the highest MSE and lowest R-
Square, making it the least effective. These results
highlight the advantage of deep learning models for
stock price forecasting.
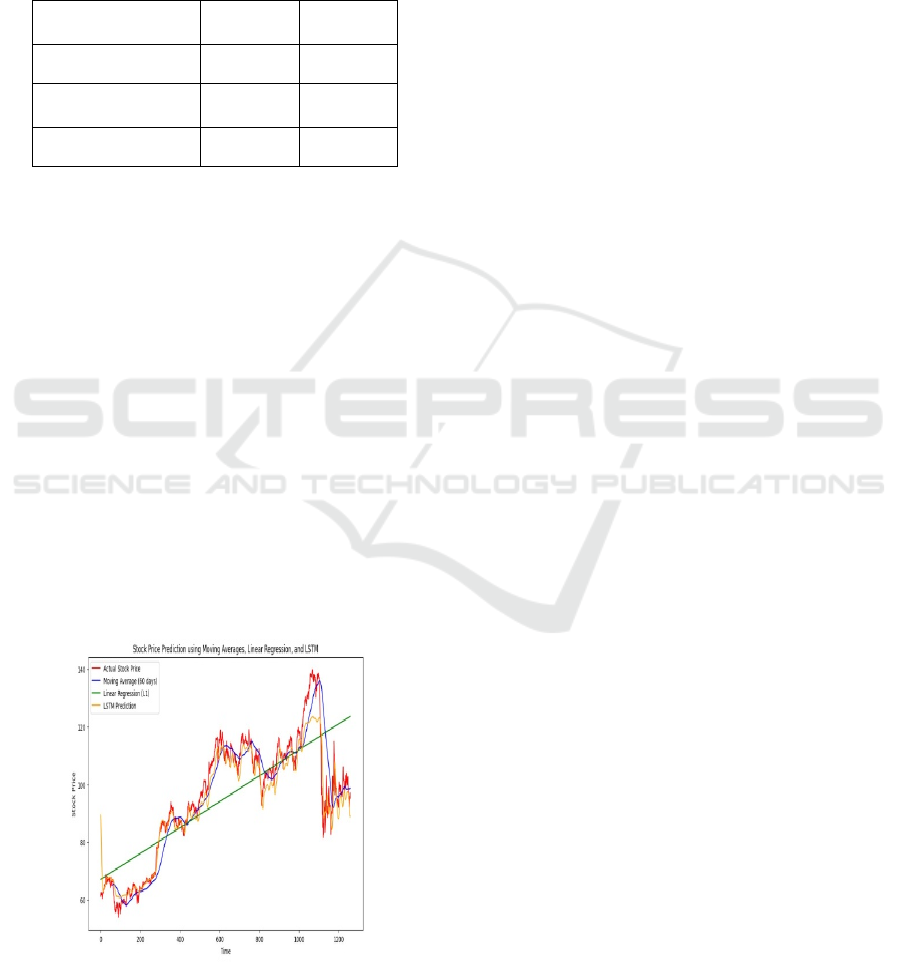
Figure 3 visualizes stock price predictions using
Moving Averages, Linear Regression, and LSTM
models. The actual stock price (red) shows high
volatility, while the Moving Average (blue) smooths
fluctuations but lags behind trends. Linear Regression
(green) provides a simple upward trend but fails to
capture variations. The LSTM model (orange) closely
follows actual stock movements, demonstrating its
ability to learn complex patterns. This aligns with
Table-1, where LSTM had the lowest MSE and
highest R-Square, confirming its superior predictive
accuracy.
Figure 3: Stock price prediction using moving average,
linear regression, and LSTM.
7 DISCUSSIONS AND
CONCLUSIONS
Sentiment analysis is beneficial for stock price
prediction because it helps capture the influence of
investor sentiment and market psychology on stock
prices. Monitoring Social Media Sentiment:
Sentiment analysis can track and analyse sentiment
expressed on social media platforms such as Twitter,
Reddit, or Stock Twits. By monitoring relevant
hashtags, company mentions, and discussions related
to the upcoming earnings report, sentiment analysis
algorithms can assess the overall sentiment expressed
by retail investors and traders. Positive sentiment may
indicate optimism about the company’s performance,
while negative sentiment may suggest concerns or
pessimism. The performance of the LSTM model can
be fine-tuned by optimizing its hyperparameters. To
determine the ideal set of parameters, methods like
grid search or Bayesian optimisation might be used,
such as the number of LSTM units, dropout rate, and
learning rate. This process can lead to further
improvements in prediction accuracy. Exploring
additional relevant features such as trading volume,
historical trends, and news sentiment can potentially
improve the predictive power of the model.
Incorporating these features into the model can
capture more nuanced patterns and enhance the
accuracy of stock price predictions.
In this study, we explored various stock price
prediction techniques using the JPMorgan stock price
dataset. We implemented Moving Averages, Linear
Regression, and Long Short-Term Memory (LSTM)
models to forecast future stock values. While Moving
Averages provided a simple trend analysis and Linear
Regression established a linear relationship with time,
the LSTM model outperformed both by capturing
complex temporal dependencies in stock prices. Our
results highlight the effectiveness of deep learning for
financial forecasting, demonstrating that LSTM
models offer more accurate predictions by leveraging
sequence modeling and historical patterns.
REFERENCES
A. Merchant, N. Shenoy, A. Bharali, and A. M. Kumar,
“Identifying Similar Questions in the Medical Domain
Using a Fine-tuned Siamese BERT Model,” in Proc.
IEEE India Council Int. Conf. (INDICON), 2022.
C. Werner, J. Voigt, S. Khattak, and G. Fettweis,
“Handover Parameter Optimization in WCDMA using
Fuzzy Controlling,” in Proc. IEEE Int. Symp. Personal,
ICRDICCT‘25 2025 - INTERNATIONAL CONFERENCE ON RESEARCH AND DEVELOPMENT IN INFORMATION,
COMMUNICATION, AND COMPUTING TECHNOLOGIES
180

Indoor and Mobile Radio Communications, 2007, pp.
1–6.
C. Peng, Z. Yin, X. Wei, and A. Zhu, “Stock Price
Prediction based on Recurrent Neural Network with
Long Short-Term Memory Units,” in Proc. Int. Conf.
Engineering, Science, and Industrial Applications
(ICESI), 2019.
E. Hirata and T. Matsuda, “Forecasting Shanghai Container
Freight Index: A Deep Learning-Based Model
Experiment,” Journal of Marine Science and
Engineering, 2022.
F. J. Fabozzi, S. M. Focardi, and P. N. Kolm, Financial
Econometrics: From Basics to Advanced Modeling
Techniques. Hoboken, NJ: John Wiley & Sons, 2012.
G. Zhang and B. Li, “Forecasting stock prices with a long
short-term memory recurrent neural network,” Expert
Systems with Applications, vol. 140, Article 112867,
2020.
G. Panda, B. Majhi, and S. Ghosh, “Deep learning models
for stock market prediction: A comprehensive
analysis,” International Journal of Computational
Science, vol. 12, no. 1, pp. 75–87, 2021.
J. Liu, Y. Luo, and Y. Xia, “Deep learning for stock
prediction using numerical and textual information,” in
Proc. IEEE/WIC/ACM Int. Conf. Web Intelligence
(WI), 2017, pp. 301–306. [5] V. Sharma and A. Kumar,
“Stock price prediction using LSTM, RNN and CNN-
sliding window model,” in Proc. Int. Conf. Computing,
Communication and Automation (ICCCA), 2017, pp.
1–6.
K. C. Cheung and T. T. Chong, “Empirical analysis of stock
prices using moving average and support vector
machines,” in Proc. Int. Joint Conf. Neural Networks,
vol. 2, 1995, pp. 1363–1366.
M. Gholamzadeh and A. Amindoust, “Application of
LSTM Neural Network for Stock Price Prediction: A
Comparative Analysis,” Sensors, vol. 21, no. 18,
Article 6255, 2021.
M. Shahzad, F. Azam, A. Hussain, Q. Abbas, and M.
Shabbir, “Short Term Stock Price Prediction Using an
Integrated Deep Learning Ap proach,” Signal
Processing, 2021, Article 4055281.
M. Shahin, F. F. Chen, A. Hosseinzadeh, and N. Zand,
“Using Machine Learning and Deep Learning
Algorithms for Downtime Minimization in
Manufacturing Systems: An Early Failure Detection
Diagnostic Service,” Research Square Platform LLC,
2023.
S. Hochreiter and J. Schmidhuber, “Long short-term
memory,” Neural Computation, vol. 9, no. 8, pp. 1735–
1780, 1997.
W. N. Al-Yaseen and S. Sathasivam, “Forecasting stock
market prices using a novel time series prediction
algorithm,” Expert Systems with Applications, vol.
132, pp. 245–259, 2019. [10] S. Y. Lim and J. H. Kim,
“Predicting stock prices using LSTM-based deep
learning models,” Sustainability, vol. 11, no. 5, Article
1319, 2019.
Comparative Analysis of Stock Price Prediction Models
181
