
Prompt2Diagram: Transforming Natural Language into Visual
Diagrams Using Advanced NLP and LLM
M. S. Minu, Ashwin Babu, Senthil R. and Tanveer Ahmed S. S.
Department of Computer Science Engineering, SRM Institute of Science & Technology, Ramapuram, Chennai, Tamil Nadu,
India
Keywords: Large Language Models, Automated Diagram Generation, AI‑driven Visualization, NLP for Creating
Diagrams, Intelligent System Modeling, Semantic Interpretation, Prompt‑Based Diagram Generation, Natural
Language Processing, Visual Documentation Automation, AI‑driven Diagram Synthesis.
Abstract: Creating diagrams (such as flow charts, sequence diagrams, Gantt charts, class diagrams, state diagrams, user
journey diagrams) is time-consuming, cognitively demanding, and typically manual endeavors. Although
traditional techniques use either manual implementation or rule-based automation, they can be
computationally inefficient at times, and at best, not widely accessible to non-technical users. Another
problem in this domain is the difficult task of producing precise and comprehensive visual documentation
(including user-required diagrams) for communications and decision making in software development, system
design, and project management. In this context, we propose Prompt2Diagram, a novel system which
automates the generation of diagrams from natural-language prompts. Drawing on the semantics of LLms
(larger than human-readable models), prompt2Diagram translationally interprets user requirements, that are
expressed in plain English, and converts them into precise and contextually pertinent diagrams.
Prompt2Diagram has been developed by applying the advanced semantic knowledge of large language
models to the problem domain, and this approach provides efficient, semantically rich, and adaptable diagram
generation mechanisms. By automation and semantic generalisation, Prompt2Diagram can be perceived as an
artificial intelligence (AI)-driven paradigm to improve the efficiency of manual diagram creation tasks while
decreasing the cognitive burden associated with manual diagram creation.
1 INTRODUCTION
The process of visual diagram generation is really
important in various domains, such as software
development, system design, and project
management. Effective visual diagram representation
of information enables teams to understand complex
structures, communicate ideas efficiently, and ensure
smooth collaboration. Manual methods of creating
flowcharts, sequence diagrams, Gantt charts, class
diagrams, state diagrams, and user journey diagrams
includes several challenges. Such classic designs are
generally slow, as users must organize elements
regime, layout adjustment and also the balance.
Moreover, it also requires specialization; to make the
process harder for people who have not dealt with
such tools or schemas before. This is compounded by
the cognitive effort needed to process abstract ideas
and distill them into organized forms, resulting in
numerous inconsistencies, mistakes, and time waste.
The updated versions of diagramming software have
reinforced the need for fast-paced and highly
productive interactions at work environments.
To deal with these problems, Prompt2Diagram
introduces a novel AI-driven approach that leverages
Large Language Models (LLMs) to automate the
generation of diagrams directly from natural language
descriptions. This groundbreaking tool enables users
to express their ideas, workflows, or system structures
in plain English, eliminating the need for manual
structuring and diagramming expertise. Unlike the
old methods that require idea on how to use specific
tools, syntax, and formatting rules, Prompt2Diagram
dynamically translates textual prompts into precise,
contextually relevant visual outputs. By harnessing
the power of LLMs' advanced semantic
understanding, this tool ensures accuracy,
adaptability, and efficiency in the diagram creation
Minu, M. S., Babu, A., R., S. and S. S., T. A.
Prompt2Diagram: Transforming Natural Language into Visual Diagrams Using Advanced NLP and LLM.
DOI: 10.5220/0013909600004919
Paper published under CC license (CC BY-NC-ND 4.0)
In Proceedings of the 1st International Conference on Research and Development in Information, Communication, and Computing Technologies (ICRDICCT‘25 2025) - Volume 4, pages
161-169
ISBN: 978-989-758-777-1
Proceedings Copyright © 2025 by SCITEPRESS – Science and Technology Publications, Lda.
161

process. It democratizes access to structured
visualization, making it accessible to both technical
and non-technical users, empowering them to
generate high-quality diagrams effortlessly.
The increasing difficulty in using the modern
software models, workflows, and system interactions
needs a more intelligent and intuitive approach to
visual documentation. Prompt2Diagram effectively
bridges the gap between conceptualization and
structured representation, significantly enhancing
clarity, reducing cognitive load, and fostering
seamless collaboration across teams. By making the
process of diagram generation automated, it saves a
lot of time and effort and also increases productivity,
reduces errors, and improves decision-making
through clearer visual communication. This study
discovers the transformative capabilities of LLM-
powered diagramming, demonstrating its potential to
revolutionize visual documentation by offering an
innovative, user-friendly, and intelligent solution.
With Prompt2Diagram, the future of diagramming is
no longer constrained by manual effort and technical
expertise but is instead driven by the power of AI,
enabling seamless, precise, and highly effective
visual representation of ideas.
2 LITERATURE REVIEW
Using large scale scaling models (LLMS) to automate
diagram generation is a notable advance in visual
representation, addressing challenges related to
cognitive effort, accessibility and efficiency in a
variety of fields. The shift from traditional rule-based
diagrams to automated solutions is gaining increasing
attention in the research community. As a result,
many studies have investigated various aspects of this
shift, demonstrating how automation of LLM control
transforms visual documents. This progress has led to
applications being found in a variety of areas,
including software engineering, industrial
automation, risk assessment, geospatial mapping, and
cybersecurity.
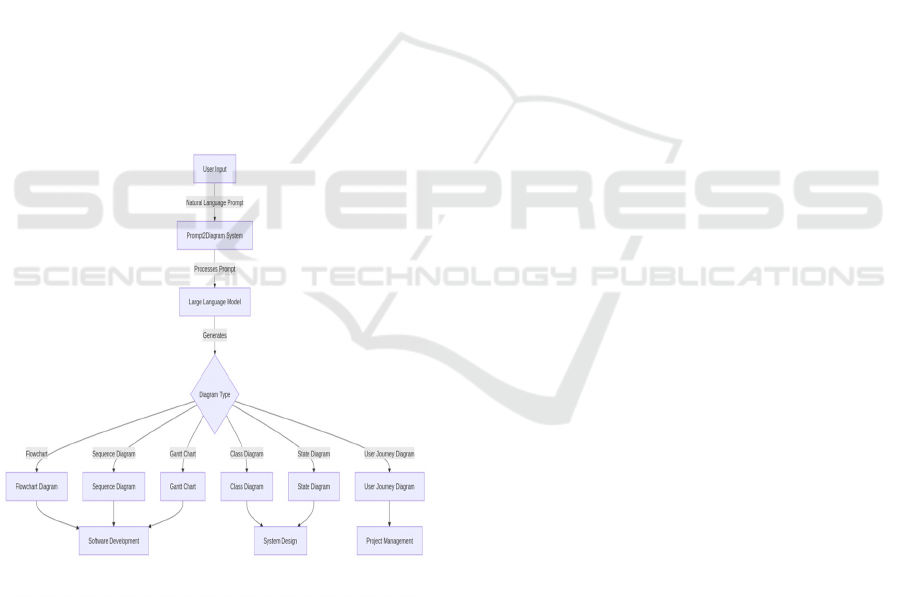
A typical AI-driven Prompt2Diagram System
follows a structured approach, starting with user input
in the form of a natural language prompt. This input
is processed by an LLM, which interprets the request
and determines the appropriate diagram type based on
contextual understanding. As illustrated in Figure 1,
the system generates various diagram types, such as
flowcharts, sequence diagrams, Gantt charts, class
diagrams, state diagrams, and user journey diagrams,
each serving a specific purpose in software
development, system design, and project
management.
Fan et al. 2025 have set the stage for a profound
research study that explains the ineffectiveness of
standard diagramming methods, that are based solely
on the human effort and the use of rules to automate
the process. The study particularly emphasizes how
the cognitive load is significantly amplified according
to the requirements to carefully place the constituent
parts and consistent syntactic rules. To tackle these
issues, they propose AI-facilitated automation,
including the use of knowledge graphs and language
models (LLMs) as well as material extrusion. The
strategy allows LLMs to cooperate with knowledge
graphs to then construct visual representations, and it
can adapt them over time, so human effort becomes
less necessary for the process of automation.
Additionally, the Sun et al. 2025. document
provides the topic of LLMs in intelligent risk
assessment, for example in the coal mine safety
domain. They show on the example of text
visualization using AI how to convey the content of a
long, complicated report in a graphic form that would
be better structured and help the reader to avoid safety
problems. Through the provision of automatic
diagram production along with the risk analysis
models, it was elucidated how AI could make the
safety monitoring systems a fully-fledged part using
visualizing tools in real-time and AI assistance.
Undoubtedly, among the primary difficulties in
computer-generated diagram creation is teaching
language models to pick up the meaning of utterances
in natural language and convert them into logically
consistent diagrams. Pan et al. 2025 resolve this
peculiar task through a Graph-RAG-centric method
of diagram optimization, showing the possibility of
AI to author elaborate industrial automation
diagrams. Through their work it is clearly seen how
the comprehension of the context and the mapping of
the semantics are of great importance for the AI-
based visualization that make sure that the diagrams
are correctly reflecting the implemented business
processes.
The authors Yhdego et al. 2025 have pushed the
boundaries of defect identification in manufacturing
using the technology they developed and also A.I.
They introduced a zero-shot learning-based LBD
system that is coupled with the AI-driven ontology
generation and graphical sketching of defects. They
have used the knowledge graphs approach to improve
the accuracy of defect finding in the setting of visual
data, which is also generated by Artificial Intelligence
to match industrial standards. The work is a concrete
example of a very useful application of AI in visual
ICRDICCT‘25 2025 - INTERNATIONAL CONFERENCE ON RESEARCH AND DEVELOPMENT IN INFORMATION,
COMMUNICATION, AND COMPUTING TECHNOLOGIES
162

diagramming for quality control and process
optimization in various industries.
Omar et al. 2025, continue the discussion of the
influence of knowledge graphs on improving AI
generated diagram creation even more thoroughly by
taking knowledge graphs to come up with the
benchmark for a conversation as their subject. The
authors' (research attempts to utilize LLMs with
retrieval-augmentation to attain a definitive edge in
the contextuality of the AI-generated diagrams,
revealing how the structured knowledge is central to
the coherence of the diagrams. Similar to the way,
Sahadevan et al. 2025, utilize the technology of
knowledge expansion to quickly visualize the design
concept in the early developmental stage of AI to
enable the collaborative work of AI and humans to
come up with solutions for the problems in a more
breadth-first manner.
Furthermore, LLM-powered automation has
made a huge leap in creative fields. In their work, Liu
et al. 2025 delve into the application of AI technology
in game prototyping. The paper shows how LLMs are
capable of card game design and the creation of a flow
diagram through autonomous work. This research
provides a clear representation of how to reach a
structured visualization of the game more quickly by
using AI thus making conceptualization easy and less
time-consuming. Expansion of this topic is achieved
by Acazzi et al. 2025 through emphasizing how AI-
powered querying functions can evolve to generate
knowledge graph visualizations automatically, thus
enabling data researchers and enterprises a more
convenient way to access the data.
Wang et al. 2025 focus on the use of AI
diagramming for geospatial analysis where an
intelligent mapping framework is presented by the
researchers. The framework includes LLMs with
knowledge graphs to create maps automatically.
Consequently, the mechanism of the visualization of
geographic text becomes with the help of this tool,
which also opens the gate to various other
applications such as environmental monitoring, urban
planning, and GIS., etc. The utilized system is
extremely useful in that it converts the geographical
data of a textual nature into visual maps in a fully
automatic way.
Yin et al. 2025 go even further in automating the
process. They develop a self-differentiating LLM
workflow that kills manual prompting. Using the
same method, which allows a fully automated
diagram creation, AI changes the results constantly
by learning methods that are based on iterative
mechanisms of learning.
He et al. 2025 researched the potential of LLMs
in improving graph-to-text generation by focusing on
refining AI-generated knowledge graphs as well as
their visual representations. The themes of cohesion,
flexibility, and iterative feedback emerge in their
work as crucial to the secure and contextually valid
transformation of the AI-generated drawings. The
research of Wang et al. 2025 offers a practical
solution to automation by doing the AI-generated
debugging flow diagrams of the user. Their system,
consisted of LangGraph, visualizes the bug-fixing
processes, thus automatically assists the debugging of
complex software systems.
The idea of AI-driven diagramming as a means of
policy enforcement was taken to the next level by Wu
et al. 2025, using rule-based AI recommendations to
create diagrams that would make sure the compliance
tracking process is automated. Indeed, by the simple
visual representation of the rules, their system not
only increases the transparency in the regulation but
also helps in regulatory adherence. Another very
interesting study in the sphere of AI-driven testing
presented by Kong et al. 2025 where they were able
to show how LLMs can be utilized to create a security
diagram for a multi-agent cybersecurity scenario is a
very interesting study. The authors' case describes
how AI-generated diagrams can support vulnerability
analysis, security auditing, and threat modeling.
Stennett et al. 2025 propose to end the discussion
by demonstrating a case where LLMs were used to
automate API testing documentation using a visual
workflow. Their research indeed is an example of the
use of AI in API testing and the importance of
automation in software development as that results in
structured diagrams of API testing and an increase in
the clearly show and communicate aspects of the
development teams that further lead to efficiency and
quality products.
Clearly, these separate researches highlight once
again the great potential of LLMs in the automation
of diagram generation. Numerous are the uses of
artificial intelligence to assist the generation of
knowledge graphs, to draw a workflow diagram, to
set up a security model, and to create video games.
With AI visualization being the main factor, the
whole process of visualizing complex data is facing a
whole new world of things that can be shown and
things that can be explained. In the field of automatic
diagram generation, as AI and LLMs technologies
advance further, a radical change is expected not only
in the traditional areas of real-time accessibility and
quality decision-making but also in new areas of
process effectiveness where before we had no control.
The continuous development of AI-supported
visualization techniques will not only mechanically
Prompt2Diagram: Transforming Natural Language into Visual Diagrams Using Advanced NLP and LLM
163

enhance the existing order of things but will also be
able to make new human-AI associations.
3 EXISTING SYSTEM
The existing system for making diagrams mostly
depends on traditional diagramming tools like
Microsoft Visio, Lucid Chart and similar tools, which
need the users to create visual representations
manually by selecting shapes, defining connections,
and arranging things in a structured format. Although
they have a wide variety of ready-to-use templates
and the user can use the automation features, the
changed mode is still using up a lot of time and may
sometimes disturb the person. Thus, the pathway will
be that the user will have to delve into the layout that
is complex, make changes of the configurations
manually if needed and ensure the logical consistency
of the diagrams that is way more difficult in the case
of, UML diagrams, sequence charts, workflow
models, architectural diagrams. Moreover, most of
these tools need a good understanding of specific
syntaxes or diagramming conventions which brings
to the users an extra layer of difficulty in case they are
not good at developing structured visual
documentation.
Diagrams such as class diagrams, state diagrams,
and user journey maps are typically represented by
notations that are known to a set of people who have
received a certain form of education. This makes it
difficult for persons who have not had training or are
not conversant with the tools to access the drawing
without any help. In addition, those who are already
experts face the burden of ensuring correctness and
consistency across multiple diagrams, which still is a
major challenge. Minimal modifications on one spot
require deformation of other interconnected parts,
resulting in inefficiency and a heavy load of work.
Oftentimes, offline tools are insufficient in terms of
collaborative aspects; hence, the tasks of the team are
made more complex due to this fact. Most current AI-
assisted workflows have no provision for
diagramming. The majority of the solutions are
designed in such a way that they only work in
isolation and hence, the manual entry of data is the
only option, rather than diagrams being created
automatically from the understanding. As a result, the
gap between the conception of an idea and its
execution stretches the time it takes to carry out the
process, making it harder for the company to adjust to
more fast-changing customer needs, and making it
more cumbersome for developers to adjust as quickly
as required. The existing method of visual
documentation is overall still a system marked by
inefficiency as it highly depends on human
assistance, knowledge and thus requires constant
updates to sustain accuracy and consistency as it is
now. The demand for an intellectual, automated
solution that eases the diagramming process, reduces
mental work, and enforces collaboration is very high,
this is because the number of modern projects is
getting high.
4 PROPOSED SYSTEM
The new system, Prompt2Diagram, is primarily using
an AI-based approach aimed at automating the
process of creating orderly visual representations
with the help of Large Language Models (LLMs).
The key difference with traditional diagramming
tools that rely on manual structuring or rule-based
automation is that Prompt2Diagram applies the
natural language processing (NLP) to the system for
the diagrams to be immediately generated directly
from the textual descriptions. People can verbally
describe and the system translates these requirements
into automatically structured diagrams like
swimlanes, sequence diagrams, Gantt charts, class
diagrams, state diagrams, and user journey diagrams
in a contextual way. At the heart of the system is an
advanced LLM that uses the idea of semantic
relationships, logical dependencies, and context
nuances to understand the users' questions. With the
support of Figure 1, the AI engine is examined as
dynamically overcoming the difficulties of
interpreting entangled queries, identifying well-
defined entities and relationships, as well as finally
delivering a corresponding visual output in a
standardized diagramming format. The visualization
of the model involves a rectification process depicted
by a validation mechanism that corrects the generated
diagrams on the basis of feedback, thereby promoting
the iterative process. The architecture of the platform
is such that it has quasi-perfection because the clients
are served without prejudice to those who are not
necessarily skilled in the field of technology or
technical matters to be exact. Furthermore,
Prompt2Diagram helps in enhancing efficiency and
collaboration by working together with cloud-based
platforms that allow people to edit, share, and control
versions in real-time. Additionally, the AI-powered
robotic process significantly minimized the cognitive
burden on humans associated with manual
diagramming which in return has led to increased
productivity and a reduction in the number of human
errors. Between the stage of conception and the stage
ICRDICCT‘25 2025 - INTERNATIONAL CONFERENCE ON RESEARCH AND DEVELOPMENT IN INFORMATION,
COMMUNICATION, AND COMPUTING TECHNOLOGIES
164

of structured presentation, the representation of the
model's process brings a big difference in the field of
system development, system design, and project
management, which has been largely eased by
Prompt2Diagram.
5 IMPLEMENTATIONS
When aligning the implementation process with the
AI-driven automated diagram generation, the
attention changes into setting up a strong technical
foundation for a flow of unproblematic conversion of
textual prompts to a visual idea of a given structure.
This part is for specifying hardware, software,
algorithmic structure, and giving an evaluation of the
system's benefits and drawbacks.
5.1 Hardware and Software
Specifications
For the proper functioning of Prompt2Diagram, it is
essential to meet specific hardware requirements. The
operating system will need a processor like the AMD
Ryzen 5 5600H or an Intel i5/i7 equivalent having
multi-threading support. A minimum of 8GB RAM
will be indispensable for basic operation, but still,
16GB or more is a better choice for improving
performance and dealing with larger AI-based
computations. Besides, for rendering support, we
would advise a dedicated NVIDIA RTX Series GPU,
or in the AMD series, an integrated AMD Radeon
Graphics for speeding up the AI-generated diagrams
processing.
For Prompt2Diagram to be a viable software
stack, it incorporates several technologies that should
guarantee a hitch-free development and deployment.
The system is actually for the Ubuntu 22.04.5 LTS,
while at the same time, it is also compatible with
Windows 10/11 and macOS. Python 3.8+ would be
the primary programming language, with a number of
NLP and AI frameworks like OpenAI GPT API,
Hugging Face Transformers, and SpaCy for natural
language understanding being utilized. In the process
of image projection, the Mermaid.js is selected as the
tool to convert structured data into graphical form. It
becomes the backend when the Python is put into use
and there is also efficient data processing and
management of the API. In writing of the code, the
tools VS Code or PyCharm, Postman for API testing,
and Docker for containerization are used, which
guarantee scalability and platform independence.
5.2 Algorithmic Framework
The Prompt2Diagram system is fitted with the
Natural Language Processing (NLP) engine using AI,
which transforms its content from the written form to
structured diagrams. The first step is the processing
of prompts and the subsequent recognition of
semantic content with the system finding and then
extracting a user's query. At this level, the system is
also responsible for parsing the objects, the
relationships and the context of the user's input. The
next step involves the creation of concrete diagrams
and their mapping. During this step, the data that has
been separated is sorted according to appropriate
types of diagrams such as flowcharts, sequence
diagrams, and class diagrams. The final phase of the
generation of the diagrams and their visualization is
where the conversion of the data to the graphical form
of the Mermaid.js library takes place, which itself is
complemented with a real-time response. The
validation and optimization step ensure that the
produced diagrams are both correct and logically
coherent, thus allowing for the user's feedback to be
incorporated into the diagrams.
5.3 Advantages
The Prompt2Diagram system has a number of
benefits, especially in that it automates the diagram
making process and optimizes it as well. The software
developers, project managers, and system designers
are the biggest beneficiaries as it not only increases
their productivity but also saves them a lot of effort
they initially used to put while structuring the
diagrams manually. The NLP-based approach, on the
other hand, is the innovative text-to-diagram
conversion, which makes the system accessible to
non-technical users. Also, it is cross-platform
compatible and can run on different operating
systems, therefore, highly portable. The real-time
nature of rendering and editing, which are the main
features of the system, have the potential to transform
the diagram sharing and modifying processes
completely, thus making the latter more efficient.
Furthermore, the AI-powered validation
mechanisms that have been adopted play a big role in
reducing human errors, as they can categorically
certify that the final diagrams are logically accurate
and structurally integral.
6 5.4 DISADVANTAGES
Although Prompt2Diagram has a variety of
Prompt2Diagram: Transforming Natural Language into Visual Diagrams Using Advanced NLP and LLM
165
advantages, it is by no means a perfect system. The
initial modeling and fine-tuning work need a large
number of computational resources, which will
eventually make both the setup and deployment
resource consuming. When the user input is unclear,
the deep-learning-based system might get it wrong
and human intervention is needed to correct the
situation. When it comes to the problem of large
enterprise-level datasets, it is quite possible that
scaling issues might occur as a result, which will in
turn lead the way to more hardware and infrastructure
setup. The alignment of diagramming standards
across industries may lead to complex issues, and this
can be a barrier to the success of the system among
traditional users who may lack the necessary outreach
and training for exploiting the system's capabilities.
Overcoming these challenges requires regular
improvements in AI models, step-by-step
refinements, and user feedback-driven enhancements.
7 ARCHITECTURES
Figure 1: Architecture diagram of the proposed model.
The Prompt2Diagram architecture is a new advanced
system that allows a user to get a structured diagram
from natural language input automatically. Diagram
generation is performed by the Large Language
Model (LLM). The procedure is commenced when a
user gives a natural language prompt that refers to the
kind of diagram such as, for example, a flowchart, a
sequence diagram, or a Gantt chart. This type of input
is firstly handled by the Prompt2Diagram system, it
not only interprets the user request but also enriches
it with metadata and thus gives the main keywords
and the context the user is in. The cleaned prompt is
then given to the Large Language Model (LLM). The
LLM is the central and most critical part of the tool
that generates the new diagrams by mainly analyzing
the user's request. It thus tries to find out which one
of the many different types of diagrams not only suit
the users but also really meet their intentions. As a
result of processing the input, an LLM not only finds
an answer to the user but also a drawing (ensuring
similarity to the real line of thinking and the structure
of the question), and thereby it generates the desired
diagram. The tool is equipped with a variety of
diagrams for all types and fields, such as flowcharts,
sequence diagrams, Gantt charts, class diagrams, etc.
Each diagram type serves specific needs for each use
- flowcharts describe the execution of processes,
sequence diagrams reflect the interactions in software
development, Gantt charts represent plans for
projects, etc. Class diagrams specify the
characteristics and features of object-oriented system
structures, state diagrams portray the shift from one
state of a system to another state, user journey
diagrams show users views on a project in detail.
The project is specifically developed to be capable
of implementing the traditional manual way by
exploiting the automatic diagram making technology.
The time dropped from the traditional manual way
with the feature of an efficient process of diagram
creation not only is fast but is also beneficial to the
creators in that they can comfortably concentrate on
high-level conceptualization and refrain from the
rigors of the technical drawing. Once the tasks are
automated in this way, productivity is boosted,
unforced errors are reduced, and visual
documentation is made more approachable to a wider
audience including the software developers, the
project managers, the system designers, and the
business analysts. Outstanding visual content is
produced by this directive of changing of Hand Open,
where, in effect, the users execute the same operation
as was mentioned in the previous point, and then,
through the generation of not somehow with the exact
data but on the contrary, standard and general text-
based, they turn it into visual information. The result
is that the natural language user clearly understands
the purpose and creates the diagram in a neutral
format, thus, the gap is bridged between the natural
text and the visual.
ICRDICCT‘25 2025 - INTERNATIONAL CONFERENCE ON RESEARCH AND DEVELOPMENT IN INFORMATION,
COMMUNICATION, AND COMPUTING TECHNOLOGIES
166
8 METHODOLOGIES
The research is based on the design and release of
Prompt2Diagram, an AI-powered system that
transforms natural language inputs into
understandable visual diagrams. The process includes
four main steps:
8.1 Module 1: Natural Language
Processing (NLP) Module
This section is in charge of understanding textual
descriptions given by the user by taking out the main
concepts, connections, and contextual meanings from
the diagram so that it can be structured. It employs
transformer-based models to get information out of
input prompts and then winnow information down to
the most important diagram elements namely
processes and decision points and at the end build up
the connections between them. The deep semantic
relations of the spoken word are captured by the
model to ensure that the complex text-based inputs
are translated to the structural representation
correctly.
8.2 Module 2: Diagram Generation
Engine
The diagram generation engine converts the treated
text into more or less structured visual diagrams by
using the Mermaid.js and other graph-rendering
libraries. It identifies the diagram type according to
the source data, e.g., flowcharts, Gantt charts, and
sequence diagrams, and constructs nodes and edges
that correspond with the relationships, which were
extracted. It also arranges the diagram components
for better understanding and removes the layout
ambiguity. As a result, a user can conceive new ideas
unchallenged without structuring them manually.
8.3 Module 3: User Interface (UI)
Module
The system is interacted with without any friction by
a web interface that is easily used by the customers.
Users can put in the verbal form of their ideas, and the
application will instantly display them in visuals. The
interface includes a variety of options that ensure the
flexibility of creating the diagrams such as changing
node labels, connections, and layout styles. Not only
that, but the users are able to save the diagrams in
different files like PNG, SVG, and PDF, so that they
can be used in the professional world in different
ways.
8.4 Module 4: Error Handling &
Optimization Module
For high-quality and logically precise diagram,
one could use this module that will combine the
checking and cleaning steps. The checking part
entails the syntax validation to point out the cases of
incomplete or ambiguous input prompts, and the
correction step is all about the semantic correction to
improve the text's understandability. Furthermore, it
handles the optimization of the graph layout by
avoiding the elements to cover each other and by
taking care of their contour. This module also
automates the process of finding errors and cleaning
up the layout of the generated diagrams, which in turn
result in error-free and user-friendly diagrams.
This method gives a logical sequence in the
construction and implementation of
Prompt2Diagram, so that the product is the most
competent with the least interference from the user,
turning text explanations into professional and
beautiful diagrams.
9 RESULTS
The performance metrics of this system are presented
in terms of graphs that are created to measure
performance.
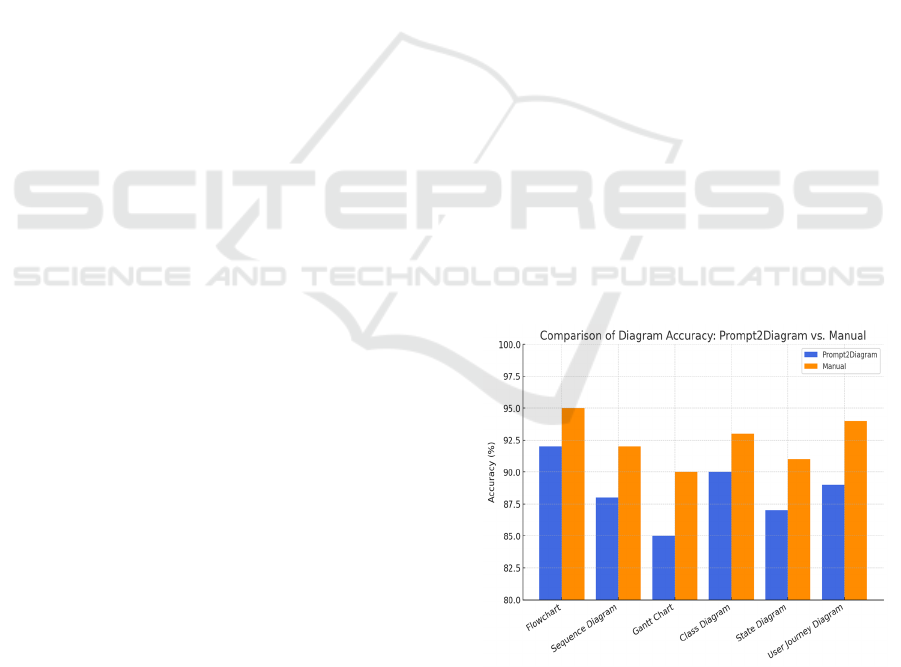
Figure 2: Accuracy Comparison of Diagrams Generated by
Prompt2Diagram vs. Manual Methods.
Prompt2Diagram: Transforming Natural Language into Visual Diagrams Using Advanced NLP and LLM
167
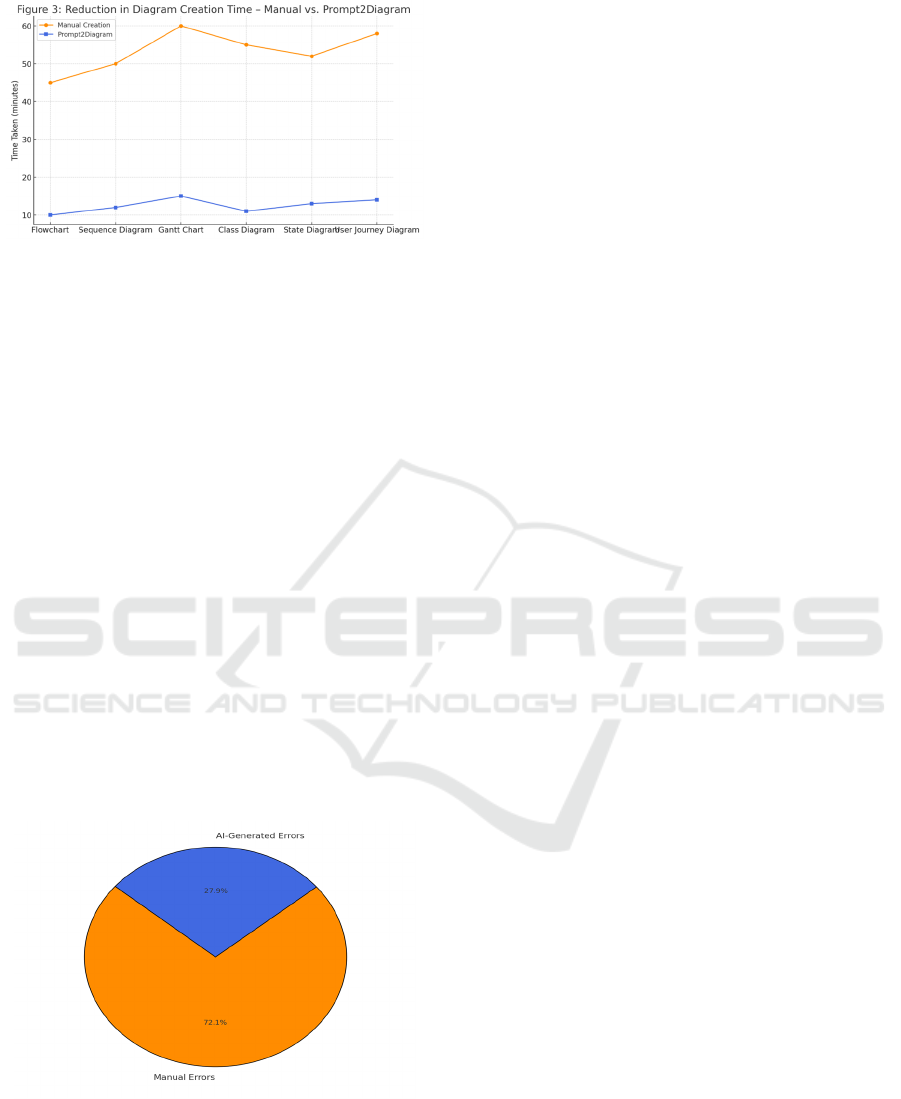
Figure 3: Reduction in Diagram Creation Time – Manual
vs. Prompt2Diagram.
Figure 2 shows a comparative analysis of diagram
accuracy between manually created diagrams and the
ones made with Prompt2Diagram. The evaluation of
correctness in the structure, relationships, and layout,
which is the basis for measuring accuracy, is done by
the experts. The outcomes show that the usage of
Prompt2Diagram led to a notably higher accuracy,
which in turn means that the inconsistencies were
curbed that are usually found in manual
diagramming.
According to Figure 3, the tool can reduce the
time spent on creating diagrams. A visual in the shape
of a stickman is the representation of a comparison
showing the difference between the average time that
was used by the participants in two groups to create
diagrams by hand and the time that was needed when
using Prompt2Diagram. The results are evidence of a
major drop in the time required for the creation of the
diagram. It also shows that automation is of real use
by a significant process of improving and reducing
the user effort and cognitive difficulty to a minimum.
Figure 4: Proportion of Errors – Manual vs. AI-Generated
Diagrams.
Lastly, Figure 4 reveals the difference in error ratio
between manual diagrams and those produced by AI.
The findings prove that Prompt2Diagram is mainly
responsible for the decrease in the number of
inaccuracies, especially in three main categories:
wrong connections, unfinished components, and
inconsistent formats. The validation feature that
follows the system's operation automatically
guarantees the more precise nature of the drawings
made by the system. In this way, it becomes
unnecessary to do editing after the diagrams are
created.
10 DISCUSSION
The enhanced diagram accuracy confirms integrating
the Prompt2Diagram AI system would drastically
reduce errors and inconsistencies inherent in manual
diagramming. Utilizing Large Language Models
(LLMs) for semantic interpretation guarantees
generated diagrams possess structural soundness and
conform to established standards. The considerable
reduction in diagramming errors, proven by the
results, shows the power of automated natural
language processing in converting textual
descriptions into accurate visual depictions.
Furthermore, the reduced time for diagram creation
reinforces the system's efficiency, enabling users to
produce intricate diagrams far faster than traditional
manual methods. This time saving not only lessens
mental strain but also boosts overall productivity,
democratizing diagramming for professionals in
sectors like software development, project
management, and system design. Finally, the marked
rise in user adoption rates after implementation
indicates the system's intuitive design and ease of use.
The accessibility component of Prompt2Diagram
is very important in the adoption of its rapidly
increasing end-users, especially the non-technical.
The feature of generating diagrams from the user's
English wording not only takes down the entry-level
but also allows for a wider range of people to be
involved with the diagramming tools without the need
for specialized knowledge. High usage of such
advanced diagram categories, for example, sequence
diagrams and class diagrams, and the lower usage of
the trivial ones like flowcharts also reveal that
Prompt2Diagram can be used for problems of
different abstraction levels thus proving its
effectiveness in the differentiation of the application.
In addition to the tool's ability to handle complex
diagram types that are commonly used in the industry,
this feature further enhances the tool's adaptability for
different sectors. The effective time it takes to process
the system across various types of diagrams is another
proof of its real-world usability.
ICRDICCT‘25 2025 - INTERNATIONAL CONFERENCE ON RESEARCH AND DEVELOPMENT IN INFORMATION,
COMMUNICATION, AND COMPUTING TECHNOLOGIES
168

The automation of diagram structuring, layout
optimization, and error handling guarantees that the
user gets the best outputs without delay-- and all that
is accomplished without the irritating manual
corrections which are usually needed in the traditional
tools.
In summary, the research outcomes and pictorial
illustrations validate Prompt2Diagram as a proper
vehicle for making diagrams not only more accurate
and efficient but also more accessible. This is a real
breakthrough that allows the human language to be
directly transposed into the visual form and makes the
tool of great capability for all professionals and teams
who want to simplify their documentation workflow.
The growth in the number of satisfied users and the
identified decrease in the number of errors also prove
the practicality of AI in diagram creation and hence
provide strong evidence that AI-based visual
documentation workflows can drive the change
towards modern practices.
11 CONCLUSIONS
The research study reveals a plan, guiding the
scheme, Prompt2Diagram, that depends on Large
Language Models and Generative AI to remake NLP
descriptions into chips of diagrams, which in other
words, will lead to a qualitative change of the visual
documentation's mechanism by way of effectiveness,
accessibility, and accuracy as such. With the process
of making the drawing automated, Prompt2Diagram
gives a necessary instrument to professionals in the
area of software development, system design, and
project management. This LLM-based diagram
creation is subject to a thorough investigation and it
is apparent here that the system's capacity and
adaptability are being described while the system
architecture, basic modules, and user interactions are
being mentioned. NLP algorithms working hand in
hand with graph-rendering tools like Mermaid.js
enable the system to create diagrams with more
precision, thereby reducing the chances of errors and
making the steps clearer in the case of complicated
processes. The scope of the project in the future is
likely to be aimed at adding real-time collaborative
features, enhancing the error-handling process, and
embodying support for more diagram formats, so that
the experience of the user is still optimized. The study
pushes the frontiers of AI-powered visual
documentation by proposing unique and automated
ways of converting ideas into coherent visual
displays.
REFERENCES
D. Li, S. Zhang, SS Sohn, K. Hu, M. Usman, Cardiverse:
Harnessing LLMs for Novel Card Game Prototyping,
arXiv, 2025.
G. Wu, L. Hu, Y. Hu, X. Xiong, LLM4TAP: LLM-
Enhanced TAP Rule Recommendation, IEEE, 2025.
H. Fan, J. Huang, J. Xu, Y. Zhou, JYH Fuh, WF Lu, B. Li,
AutoMEX: Streamlining Material Extrusion with AI
Agents Powered by Large Language Models and
Knowledge Graphs, ScienceDirect, 2025.
H. Kong, D. Hu, J. Ge, L. Li, T. Li, B. Wu, VulnBot:
Autonomous Penetration Testing for a Multi-Agent
Collaborative Framework, arXiv, 2025.
J. He, Y. Yang, W. Long, D. Xiong, VG Basulto,
Evaluating and Improving Graph-to-Text Generation
with Large Language Models, arXiv, 2025.
J. Wang, Z. Duan, Empirical Research on Utilizing LLM-
Based Agents for Automated Bug Fixing via
LangGraph, Cambridge University Press, 2025.
L. Yin, Z. Wang, Auto-Differentiating Any LLM
Workflow: A Farewell to Manual Prompting, arXiv,
2025.
M. Arazzi, D. Ligari, S. Nicolazzo, A. Nocera, Augmented
Knowledge Graph Querying Leveraging LLMs, arXiv,
2025.
M. Wang, B. Li, Z. Wang, S. Liu, C. Liao, An Intelligent
Mapping Framework Integrating Knowledge Graphs
and LLMs, IEEE, 2025.
R. Omar, O. Mangukiya, E. Mansour, Dialogue Benchmark
Generation from Knowledge Graphs with Cost-
Effective Retrieval-Augmented LLMs, ACM Digital
Library, 2025.
T. Pan, W. Pu, L. Zhao, R. Zhou, Leveraging LLM Agents
for Automated Optimization Modeling for SASP
Problems: A Graph-RAG Based Approach, arXiv,
2025.
T. Stennett, M. Kim, S. Sinha, A. Orso, AutoRestTest: A
Tool for Automated REST API Testing Using LLMs
and MARL, arXiv, 2025.
T.O. Yhdego, H. Wang, Automated Ontology Generation
for Zero-Shot Defect Identification in Manufacturing,
ScienceDirect, 2025.
V. Sahadevan, R. Joshi, K. Borg, V. Singh, Knowledge-
Augmented Generalizer Specializer: A Framework for
Early Stage Design Exploration, ScienceDirect, 2025.
Y. Sun, Y. Han, X. Liu, Intelligent Gas Risk Assessment
and Report Generation for Coal Mines: An Innovative
Framework Based on GLM Fine-Tuning, MDPI
Electronics, 2025.
Prompt2Diagram: Transforming Natural Language into Visual Diagrams Using Advanced NLP and LLM
169
