
Development of Weather Monitoring and Forecasting System Using
Reinforcement Learning Algorithms for Enhanced Solar Power
Response in PV System
Rajasekaran S, Prem A T, Dhinesh G
and Ramu R
Department of Electrical and Electronics Engineering, K.S.R. College of Engineering, Namakkal, Tamil Nadu, India
Keywords: Photovoltaic, Reinforcement Learning, International Energy Agency, Machine Learning, Temperature,
Humidity, Pressure, Weather Monitoring.
Abstract: This work deliberates the integrated approach on using reinforcement learning algorithms for photovoltaic
system performance and efficiency optimization in concurrence with monitoring and forecasting weather
conditions. Thus, the proposed novel architecture of continuously monitoring and predicting meteorological
variables such as temperature, humidity, cloud cover, and irradiance with Reinforcement learning algorithm
to adaptively control and manage the PV system operations based on real-time weather data to maximize
energy output, improve system stability, and reduce the power generation costs. By using this method, the
overall efficiency increased from 74% to 91%, and also the accuracy increased with response time. In this
work, it is observed that the use of Reinforcement Learning in weather forecasting has shown significant
improvement in efficiency and accuracy than the traditional method.
1 INTRODUCTION
Accurate weather forecasting is essential for
predicting solar power generation from sunlight. In
earlier times, limitations in forecasting techniques
made it difficult to assess the atmospheric conditions
accurately, which negatively impacted on regional
development (
J. Wang et al, 2019). Weather can be
referred as to what extent the environment is whether
it is hot or cold or wet or dry, or calm or stormy or
clear or foggy. Weather is the atmospheric condition
of the environment based on considering some
external factors like temperature, precipitation
activity etc., over a certain interval of time (
K.
Krishnamurthi, et al. 2015)
Solar power has been used
extensively across the globe and is one of the most
promising and fast-growing alternative sources of
energy. Accurate forecasting of solar power is crucial
to providing the reliable and cost-effective operation
of power systems (
P.Prem Sagar et al., 2022) As of
2016, 303 GW of PV power was installed worldwide,
representing a 33.48% increase from 2015. We can
enhance the power output of the solar system by
making use of the weather data. This weather
monitoring system specially designed for
determining the solar radiance of the particular area
to determine that area for efficient for power
generation using PV systems (
P. Ashok Baste et al,
2021) Compared to statistical models like
Autoregressive Integrated Moving Average
(ARIMA), Long Short-Term Memory (LSTM), and
Gated Recurrent Unit (GRU), reinforcement learning
approaches, such as Q-learning algorithm,
demonstrate a superior performance in certain
forecasting tasks (
E. O. Arwa et al., 2021) In order to
successfully incorporate solar photovoltaic systems
into the current power grid, the conversion process
and stabilization of the grid that manage variations in
solar power need to be done effectively (
Anand, R.,
Stallon, S.D et al.., 2024)
Grid stability is required to
sustain a balance between supply and demand during
weather fluctuations. Efficient energy conversion in
solar PV systems ensures the complete use of solar
energy available. Proper energy conversion
mechanisms and some grid stabilization techniques
may cause power quality problems, resulting in more
operational problems for the grid if solar PV systems
are integrated (
Ramasamy, M., & Thangavel, S.) The
International Energy Agency (IEA) reports that solar
energy contributed around 12% to the global energy
mix in 2024, an increase from 8% in 2020. Forecast
suggest this share could exceed 20% by 2030, fueled
S., R., T., P. A., G., D. and R., R.
Development of Weather Monitoring and Forecasting System Using Reinforcement Learning Algorithms for Enhanced Solar Power Response in PV System.
DOI: 10.5220/0013903800004919
Paper published under CC license (CC BY-NC-ND 4.0)
In Proceedings of the 1st International Conference on Research and Development in Information, Communication, and Computing Technologies (ICRDICCT‘25 2025) - Volume 3, pages
679-685
ISBN: 978-989-758-777-1
Proceedings Copyright © 2025 by SCITEPRESS – Science and Technology Publications, Lda.
679

by technological innovations and policy-driven
incentives worldwide.
2 RELATED WORKS
A lot of research has already been published in this
regard, more than 57 research papers and articles
particularly focused on this intersection of weather
forecasting, reinforcement learning, and solar energy
optimization. The sources of these references are
peer-reviewed journals, and conferences such as
IEEE Xplore and Google Scholar.
Das et al. proposed an optimized PSO-based SVR
model for solar power forecasting using novel data
preparation algorithms for preprocessing the weather
reports. Their model was able to deliver a huge gain
in accuracy up to 2.841 nRMSE. The research stated
that parameter optimization along with preprocessing
gives a reliable prediction of solar power (
U. K. Das et
al., 2022)
Manohar et al. proposed a protection scheme
for hybrid PV-wind microgrids using stochastic
weather models and rotation forest-based classifiers.
Wavelet-transformed data improve fault detection
accuracy under diverse conditions, emphasizing
resilient strategies to address the issues due to
weather intermittency in renewable energy systems
M. Manohar et al.2020)
. Liu et al. proposed a technique
for home solar energy scheduling based on adaptive
dynamic programming.
Their technique reduces costs and enhances load
balancing through weather pattern categorization and
preferring energy sources. The self-improving neural
networks prove the worth of dynamic scheduling
models and further enhance system performance. (
D.
Liu et al. 2018)
. Wu et al. proposed one-day-ahead PV
power was subsequently forecast using weather-
classification-based forecasting methods, deep AI
models in XGBoost, GRU, and Transformer, and
clustering methods such as K-means. The prediction
accuracy of this method is high as it captures seasonal
and temporal patterns. This approach also showcases
how machine learning and weather classification
complement each other in enhancing solar
forecasting. (
Y. K. Wu, et al., 2024)
. Lyu and
Eftekharnejad had addressed solar forecasting under
fluctuating weather conditions through a dynamic
probabilistic model. That is, their method
dynamically quantifies spatio-temporal correlations
by merging copula theory and machine learning that
could potentially enhance accuracy to up to 60%
higher than previously known in non-sunny
conditions. This further supports the use of
unpredictability adaptation in weather-dependent
solar power generation (
C. Lyu and S. Eftekharnejadet
al., 2024)
. Feng et al. introduced a reinforcement
learning-based dynamic model Selection (DMS)
strategy for short-term load forecasting (STLF). Their
method employed a Q-learning agent to adaptively
select the most effective model from a set of machine
learning algorithms. This technique resulted in a 50%
improvement in the forecasting accuracy as compared
to the traditional static methods (
C. Feng and J. Zhang.,
2019)
. The paper from the author Baste et al. who
designed a cost-effective weather station using
Arduino Mega for monitoring climatic parameters is
reference for the proposed work. The system provides
real-time data transmission and storage, enabling
insights for optimizing solar plant efficiency and
offering a lightweight, affordable alternative to
commercial weather stations (
P. Ashok Baste et al
.,
2021)
From the previous findings, it is concluded that it
can not correlate with the real-time uptodate
information. So, this is why the Reinforcement
learning algorithm is used to dynamically improve the
photovoltaic system based on real-time weather
characteristics. The aim of the study is to enhance the
efficiency and accuracy of the PV system using the
RL algorithm.
3 MATERIALS AND METHODS
This work is linked to some notable studies including
ARIMA, LSTM, and their combination. With
relatively stable weather conditions, ARIMA was
successful in forecasting temperatures in the northern
part of Europe. However, it proved unsuccessful in the
tropical regions of highly variable weather, such as
Southeast Asia, due to the nonlinear nature of data
Hyndman, R.J., & Wang, E. (2016).
LSTM produced
state-of-the-art accuracy in forecasting solar
irradiance in California, given the availability of vast
historical data. However, the inability of this model to
adjust dynamically led to poor results during
unexpected anomalies in weather conditions (
Y. I.
Febriansyah et al
., 2024) Hybrid ARIMA-LSTM model
implemented in Germany enhanced the day-ahead
electricity demand forecasting by 12%. However, it
needed to be retrained often, which restricted its
applicability in real-time systems (
Yildirim.A.,
Bilgili.M et al 2023)
This work addresses the development of a Weather
Monitoring and Forecasting System integrated with
reinforcement learning algorithms, which will
optimize solar power generation by using real-time
environmental data in advanced prediction models to
ICRDICCT‘25 2025 - INTERNATIONAL CONFERENCE ON RESEARCH AND DEVELOPMENT IN INFORMATION,
COMMUNICATION, AND COMPUTING TECHNOLOGIES
680
ensure adaptability to variations in weather. RL
integrates and enhances the decisions toward the
renewable energy infrastructure while taking energy
systems as operational elements in operations. Its
outcome opens way toward smarter renewable
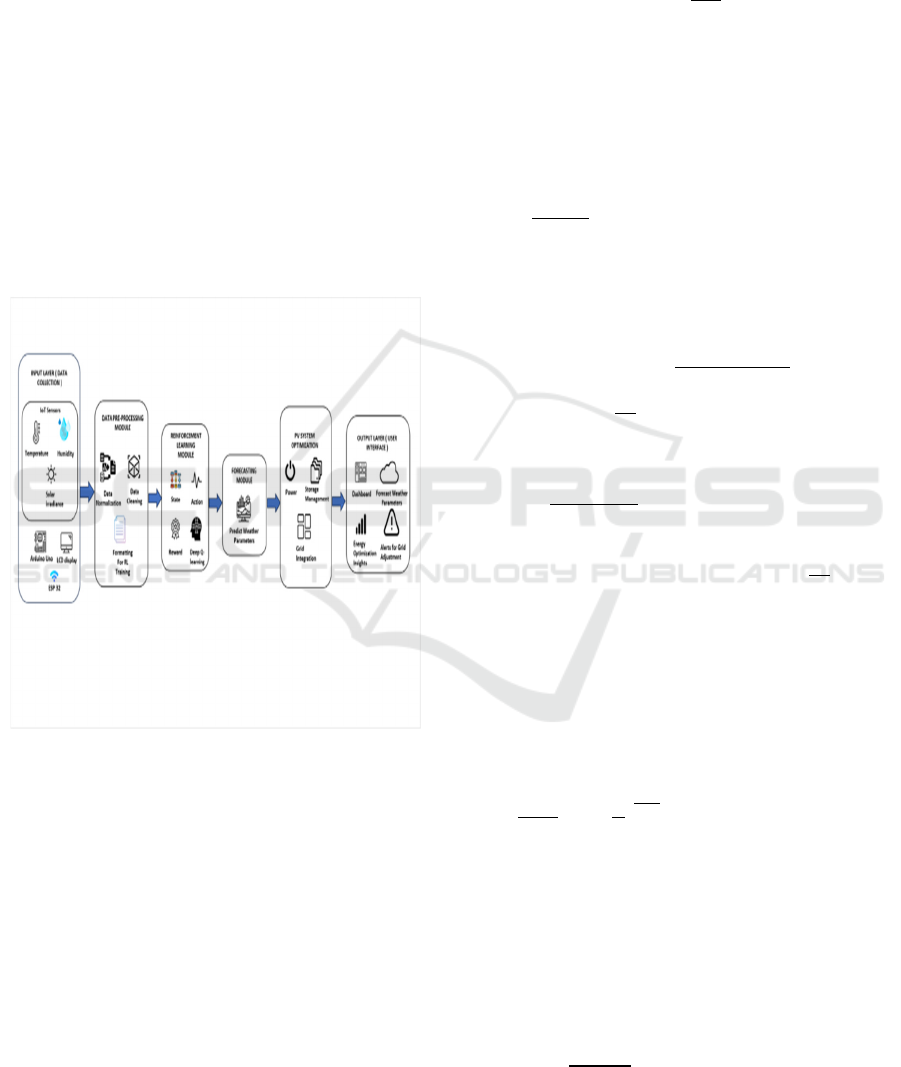
infrastructure. Figure 1. describes our model's outer
structure, including its six-layer setup, beginning with
an input layer and leading all the way up to the output
layer, as discussed therein.
From the figure.1, shows the sequence of actions
involved in collecting data, training and applying the
reinforcement learning (RL) model, forecasting
weather, optimizing solar power output, and
deploying the system in real-time. The system first
gathers environmental data using various sensors
such as temperature, humidity, irradiance, pressure,
and wind speed. These sensors transmit real-time data
to a processing unit.
Figure 1: Flow chart of the model.
That processing unit performs filtering and
normalization by using the raw sensor data. Then
these data will be stored in the database for long-term
pattern analysis. After that, the processed data goes to
the training model [ RL model]. The RL model is
trained by using the real-time data and historical
weather data. This model will learn the best actions to
optimize the solar power generation under varying
weather conditions. It provides forecasts of
temperature, solar irradiance, cloud cover and
humidity. That predicted result is used to optimize
energy management in the PV systems. This
improves the system PV efficiency and enhances
energy utilization.
4 CALCULATION
For calculating the output voltage is shown in
equation (1)
𝑉
𝑆𝑒𝑛𝑠𝑜𝑟 𝑅𝑒𝑎𝑑𝑖𝑛𝑔
(1)
Here 𝑉
is the reference voltage (typically 5V for
Arduino) and the value 1024 is the ADC resolution
for a 10-bit ADC. Calculating the temperature sensor
reading depends on the type of sensor used and its
output characteristics and the related formula for the
Temperature (in °C) calculation is shown in equation
(2),
𝑇
°
⁄
(2)
Relative Humidity (RH): The sensor typically
provides RH directly as a percentage and calculates
the actual RH using the equation (3). Use the sensor's
datasheet formula, if necessary.
𝑅𝐻
𝑅𝐻
..
(3)
Solar irradiance
:
The solar irradiance can be calculated using equation
(4)
𝐼
(4)
Where the 𝑉
is the sensor output voltage,
Sensitivity is typically measured in 𝑚𝑉
, and A
is the sensor's active area
𝑖𝑛 𝑚
.
Pressure
𝑖𝑛 ℎ𝑝𝑎
: The sensor typically outputs the
pressure directly. We can use the conversion from the
datasheet with the help of equation (5).
𝑝𝑅𝑎𝑤 𝑆𝑒𝑛𝑠𝑜𝑟 𝑂𝑢𝑡𝑝𝑢𝑡 𝐶𝑜𝑛𝑣𝑒𝑟𝑠𝑖𝑜𝑛 𝐹𝑎𝑐𝑡𝑜
(5)
Altitude (in meters):
Altitude can be measured using equation (6)
ℎ
.
1
.
(6)
Where T is the temperature in Kelvin, P is the current
pressure in hPa and Po is the sea-level standard
atmospheric pressure (1013.25 hPa).
DERIVED
CALCULATIONS
FOR
FORECASTING
Dew Point (°C):
Dew point can be calculated using the equation (7)
with temperature and RH parameters.
𝑇
𝑇
(7)
Development of Weather Monitoring and Forecasting System Using Reinforcement Learning Algorithms for Enhanced Solar Power
Response in PV System
681
Where T is the temperature in °C and RH is relative
humidity in %.
Heat Index (°C):
The calculation for the heat index is measured using
the equation (8) with known parameters such as
Temperature, Relative humidity.
𝐻𝐼8.7847 1.6114𝑇 2.3385𝑅𝐻
0.1461𝑇 𝑅𝐻 0.0123𝑇
0.0164𝑅𝐻
0.0003𝑇
𝑅𝐻
(8)
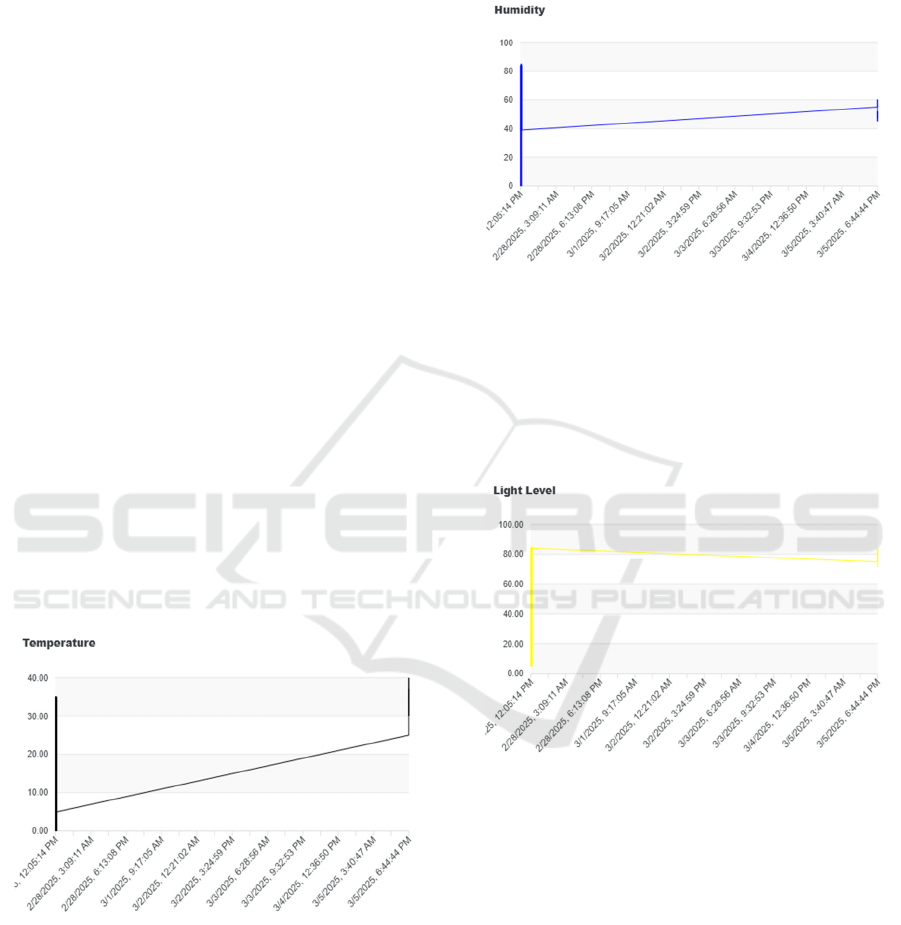
5 RESULTS AND DISCUSSIONS
A series of testing had been conducted using the
developed model for weather forecasting and with the
data obtained, the graphical data represents variations
in temperature, humidity, light level, and solar
voltage recorded from 28
th
of February, 2025 to 5
th
of
March, 2025 at various intervals. The data gives
insight into environmental conditions during the
testing hours. Temperature and irradiance would tend
to be monotonic decreasing as the daylight hours
disappear, but the humidity would be enhanced
because of cooling in the night air. Interpretation of
the variables would offer insights into dynamics in
the environment and in terms of optimizing
renewable systems, such as tuning photovoltaic
responses or predicting performance toward an
overall optimization of efficiency over evening
periods.
Figure: 2 Temperature data during the testing period.
From figure 2, during the testing hours the
temperature is gradually increasing in Linear manner
from 6°C to 25°C of temperature. Since the testing
was conducted in various hours, the temperature is
measured in the Morning, Noon, Evening period.
During the morning hours the temperature is reached
below 10°C and during the evening and noon hours it
reached to 25°C. This shows that the climatic
condition is most favorable during the noon and
evening period in the month of February and March
month.
Figure: 3 Humidity data during the testing period.
while comparing with humidity of that same
environment with the figure 3., that temperature is
directly related to the humidity. Here the humidity
rises from 40% in the evening of 28
th
of February to
58% in the evening of 5
th
march which is
proportionate with the temperature.
Figure: 4 Light level data during the testing period.
When looking at the light level during the testing
hours from the figure 4, the peak value is registered
on the Feb 28
th
, 2025 of about 83%. During the 5
th
Mar, 2025, the value is down of about 72%, this
significant decrease is due to the change in climatic
factors such as cloud cover. This may be one of the
significant reasons for decrease in light level during
the testing.
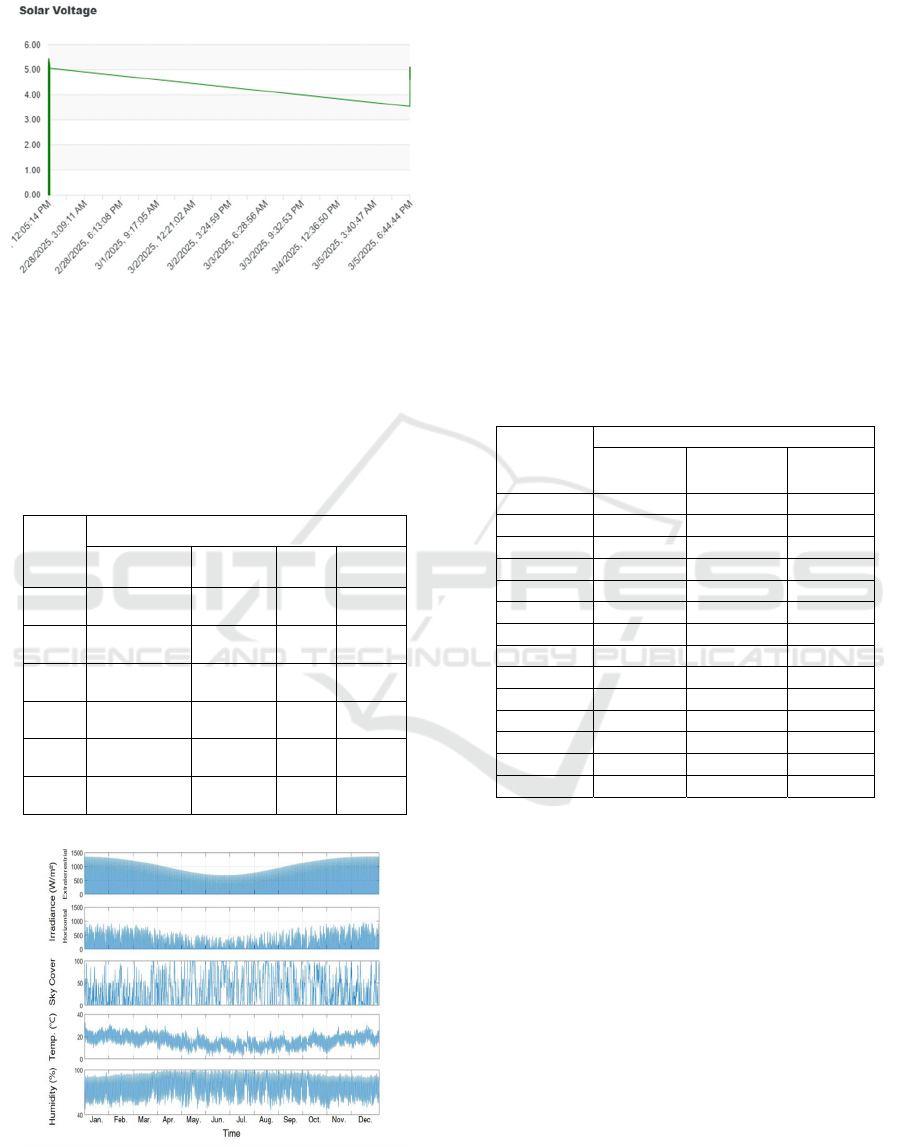
From figure 5, the power generation levels during
the testing hours keep varying due to the change in
climatic conditions. During the testing hours, the peak
value of voltage is reached around 5.10V and keeps
changing its value. The detailed review from the
report is tabulated in table 1, from which the
ICRDICCT‘25 2025 - INTERNATIONAL CONFERENCE ON RESEARCH AND DEVELOPMENT IN INFORMATION,
COMMUNICATION, AND COMPUTING TECHNOLOGIES
682
numerical relationship between each parameter can
be defined.
Figure: 5 Light level data during the testing period.
During the testing from 28
th
of February, 2025 to
5
th
of March, 2025. The detailed variations of various
parameters such as temperature, humidity, pressure,
light intensity. And the relation between climatic
factors can be correlated.
Table 1: The sensor readings of several parameters.
Time
Period
Parameters
Temperature
(°C)
Humidity
(%)
Light
Level
Solar
voltage
28
th
Feb
6 41 83 4.8
1
st
Ma
r
10 43 80 4.5
2
nd
Ma
r
12 45 78 4.2
3
rd
Ma
r
17 49 75 4.0
4
th
Ma
r
21 53 74 3.9
5
th
Ma
r
25 57 72 3.7
Figure: 6. Annual weather characteristics.
From figure 6, explains the annual weather
characteristics throughout the year. Here the x-axis
represents the month from January to December,2024
and the y-axis represents the Irradiance(W/m²)
(Horizontal and Extraterrestrial), Sky cover,
Temperature(°C), Humidity (%) respectively. From
the graph, we can conclude that during the middle of
the year, the production of irradiance is low when
compared with the other months. The irradiance
values vary in the range from 750 W/m² to 1400
W/m². During in the month of June, the irradiance
value goes as low as 750 W/m² to 800 W/m². The
peak value is reached during the month January and
December as 1400 W/m².
The reference solar irradiance from the historical
data is compared with proposed solar irradiance
values for every month from January to December in
the year 2024.
Table 2: Predictive performance of target models.
Month
RMSE
(
W
/
m²
)
Reference
Ref.
(Sequence)
Proposed
Januar
y
43.2 34.8 26.1
Februar
y
44.1 36.5 25.4
March 58.1 42.1 26.8
April 65.6 41.3 25.4
May 58.1 40.2 30.6
June 55.2 32.3 30.6
Jul
y
55.4 26.5 35.8
Au
g
ust 61.4 36.5 37.2
Septembe
r
61.6 55.3 36.6
Octobe
r
63.2 44.2 41.5
Novembe
r
60.4 47.1 31.1
Decembe
r
51.3 41.4 24.3
Avera
g
e 56.4 39.8 32.7
CVRMSE 12.8% 9.2% 7.0%
We conducted tests every month to measure the
solar irradiance values for varying climatic
conditions. The collected data was systematically
recorded and organized into a table, enabling detailed
analysis and comparison of monthly irradiance
patterns for use in the development and validation of
the forecasting system. From the table 2, we can
understand that from the month of the January to
April 2024, the values increasing from 44.3 W/m² to
66.7 W/m². since during that time the sunlight time
is higher than other seasons. After that period, it is
gradually decreasing from the April to July 2024
(66.7 W/m² to 56.3 W/m²) and then it keeps an
undulating pattern, rising and falling periodically till
the month of December. During the period of testing,
in the month of April where the readings reached its
peak value about 66.7 W/m².
Development of Weather Monitoring and Forecasting System Using Reinforcement Learning Algorithms for Enhanced Solar Power
Response in PV System
683
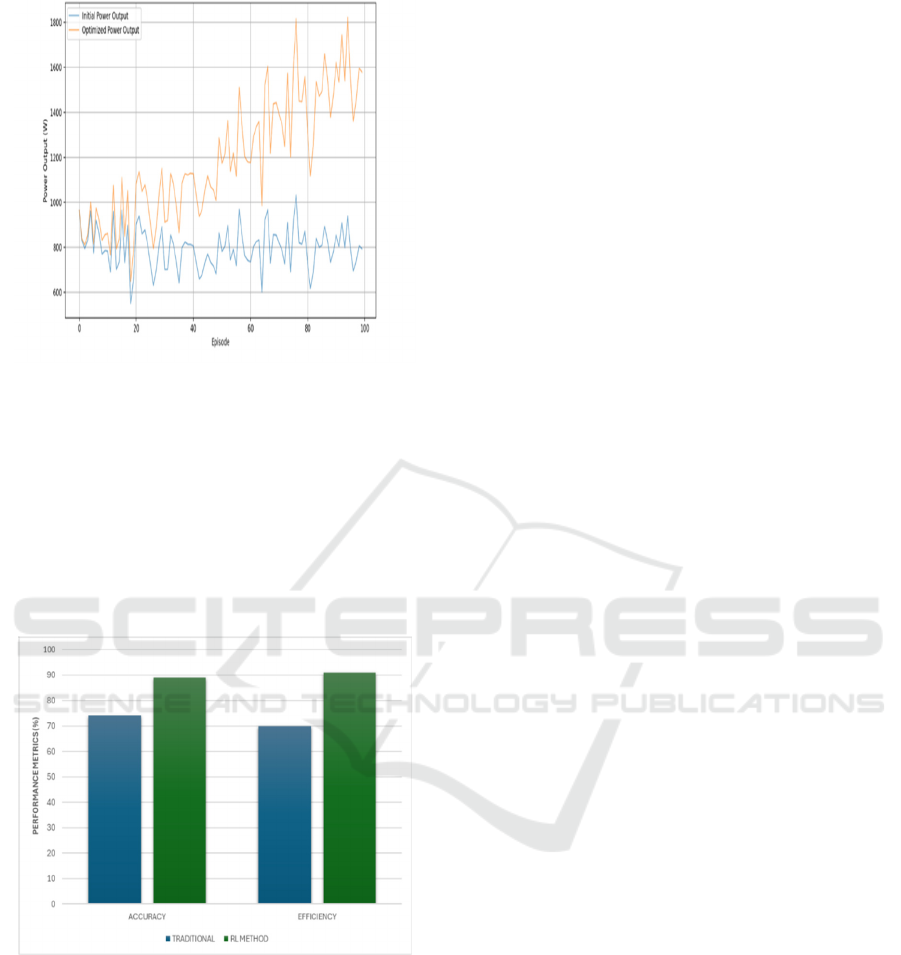
Figure: 7 RL-based PV system optimization.
The comparison of the traditional method with the
RL method in the figure 8., shows the significant
increase in the power production. Here, the gain of
enhanced power output using the RL is compared
with the traditional power output generated. The
improvement is seen from the graph clearly and the
power output has reached its peak value of about
1800W but in the normal method it has reached only
1000W. The is a difference of 800W between them.
Figure: 8 Performance comparison between the traditional
approach and RL approach.
From the figure 8., We can understand the
improvement in the proposed system by comparing
the parameters like efficiency, accuracy, response
time with the traditional data. The data from hardware
using the RL algorithm is compared with the
traditional method. Here, the x- axis refers to the
accuracy and efficiency of the model while the y-axis
refers to the performance metrics. The efficiency
increased from 70% to 91% while the accuracy
increased from 74% to 89%. There is a significant
increase in efficiency of about 21%.
The reinforcement Learning model used in the
system is significantly better than the existing
method. The efficiency of the system has increased
from 70 to 91%. The power generation reached the
peak of 1800W which is 800W more than the
traditional power generation. Due to better energy
optimization and reduced losses, the overall cost per
unit of solar power has been reduced by 15 - 20%
compared to traditional methods.
By using the IoT technology for establishing an
environment suitable for monitoring the real-time
tracking of climatic factors and analysing the
condition. Implementing IoT-Based solutions can pay
the way for more responsive and adaptive energy
management systems (
Bharathy.S et al. 2022)
. To
forecast solar irradiance, certain systems developed a
system based on deep learning that is mainly
concerned with flexibility and resilience. It is a model
based on Convolutional Long Short-Term Memory
layers and supports easy addition or exclusion of
sensors as well as sensor failure with higher accuracy
and robustness in large-scale systems. (
I. Prado-Rujas.,
2021)
. By incorporating numerical weather prediction
models (NWP) to provide detailed meteorological
data, this will improve the accuracy of the forecast
and studies have shown that combining multiple
NWP will enhance the forecast reliability and
performance (
B. Saad et al., 2020)
.
The limitation of this system is that RL models
primarily rely on past data and struggle to adapt
instantly to unexpected weather conditions such as
thunderstorm, heavy cloud cover. Also, the RL model
cannot react instantly to sudden irradiance drop.
6 CONCLUSIONS
This work contributes immensely to optimizing
renewable energy by promoting the use of more
reliable, sustainable energy systems. When weather
data are combined with predictions based on the RL
paradigm, the result is improved forecasting
accuracy; this improves strategies for maximum
generation of solar power and its efficient storage and
distribution. Finally, we can conclude that the overall
efficiency increases from 70% to 91% and its
accuracy also increases.
ICRDICCT‘25 2025 - INTERNATIONAL CONFERENCE ON RESEARCH AND DEVELOPMENT IN INFORMATION,
COMMUNICATION, AND COMPUTING TECHNOLOGIES
684

REFERENCES
J. Wang et al. "Exploring Key Weather Factors from
Analytical Modeling Toward Improved Solar Power
Forecasting," in IEEE Transactions on Smart Grid, vol.
10, no. 2, pp. 1417-1427, March 2019.
K. Krishnamurthi, et al. "Arduino based weather
monitoring system," in International Journal of
Engineering Research and General Science vol. 3, pp.
452-458,2015.
P. Prem Sagar, D.Vidya Sagar, B.Srikanth, J.Sudhanshu et
al. (2022), “Weather monitoring system for remote
places using GSM”, Journal of Next Generation
Technology, 2(1), 63-69.
P. Ashok Baste et al. "Weather Station for Solar PV Power
Plant Using Arduino Mega," International Conference
on Computer Communication and Informatics (ICCCI),
Coimbatore, India, 2021, pp. 1-6.
E. O. Arwa et al. "Improved Q-learning for Energy
Management in a Grid-tied PV Microgrid," in SAIEE
Africa Research Journal, vol. 112, no. 2, pp. 77-88,
June 2021.
Anand, R., Stallon, S.D et al. “Using hybrid firebug swarm
optimization and jellyfish search to enhance DC-DC
converter efficiency in solar PV systems.” Environ Dev
Sustain (2024).
Ramasamy, M., & Thangavel, S. “Optimal Utilisation of
Photovoltaic System as Dynamic Voltage Restorer for
Voltage Regulation and Energy Conservation” in
Australian Journal of Electrical and Electronics
Engineering, 10(3), 371–382.
U. K. Das et al., "Optimized Support Vector Regression-
Based Model for Solar Power Generation Forecasting
on the Basis of Online Weather Reports," in IEEE
Access, vol. 10, pp. 15594-15604, 2022.
M. Manohar et al. "Stochastic Weather Modeling-Based
Protection Scheme for Hybrid PV–Wind System With
Immunity Against Solar Irradiance and Wind Speed,"
in IEEE Systems Journal, vol. 14, no. 3, pp. 3430-3439,
Sept. 2020.
D. Liu et al. "Residential energy scheduling for variable
weather solar energy based on adaptive dynamic
programming," in IEEE/CAA Journal of Automatica
Sinica, vol. 5, no. 1, pp. 36-46, Jan. 2018.
Y. K. Wu, et al. "Day-Ahead Solar Power Forecasting
Using Weather Classifications: Case Study in Taiwan,"
in IEEE Trans. Ind. Appl, vol. 60, no. 1, pp. 1409-1423,
Jan.-Feb. 2024.
C. Lyu and S. Eftekharnejad, "Probabilistic Approach for
Solar Generation Forecasting Under Rapidly Changing
Weather," in IEEE Access, vol. 12, pp. 79091-79103,
2024.
C. Feng and J. Zhang, "Dynamic Model Selection for Short-
Term Load Forecasting Using Reinforcement
Learning," in Proc. IEEE Power & Energy Soc. Innov.
Smart Grid Technol. Conf. (ISGT), Washington, DC,
USA, 2019.
Hyndman, R.J., & Wang, E. (2016). "The application of
ARIMA models in temperature forecasting: Success in
stable climates and limitations in tropical regions."
Journal of Climate and Atmospheric Science, 7(4), 249-
262.
Y. I. Febriansyah et al., "Improving Solar Power
Forecasting in Hybrid PV Systems using LSTM Solar
Irradiance and Temperature Prediction," Proc. Int.
Conf. Technol. Policy Energy and Electr. Power
(ICTPEP), Bali, Indonesia, 2024. pp. 449-454.
Yildirim.A., Bilgili.M et al. “Short-Term solar radiation
forecasting: A comparative study using by MLP,
LSTM, and ANFIS Models,” Meteorol. Atmos. Phys.
vol. 135, no.10 ,2023.
Bharathy.S et al., “IoT-based Efficient Weather Forecasting
Powered by Solar Energy,” in Proc. 1st Int. Conf.
Comput. Sci. Technol. (ICCST), Chennai, India,2022,
pp.682-685.
-I. Prado-Rujas, A. García-Dopico, E. Serrano et al. "A
Deep Learning Approach for Reliable Solar Irradiance
Prediction," in IEEE Access, vol. 9, pp. 12348-12361,
2021.
B. Saad, A. E. Hannani, R. Errattahi et al. “Effect of
Weather Forecast Models Integration on the AMS solar
energy prediction, ” in Proc. 4th Int. Conf. On Intell.
Comput. Data Sci (ICDS),Fez,Morocco, pp 1-5,2020.
Development of Weather Monitoring and Forecasting System Using Reinforcement Learning Algorithms for Enhanced Solar Power
Response in PV System
685
