
Advanced Predictive Analytics for Aircraft Accident Severity
Using Deep Learning
S. Thenmalar, B. Jaya Krishna Yadav and D. Venkat Kishore
Department of NWC, SRM Institute of Science and Technology, Chennai, Tamil Nadu, India
Keywords: Accident Severity, Aircraft Safety, Convolutional Neural Networks, Deep Learning, Feature Engineering,
Machine Learning, Predictive Analytics.
Abstract: Aviation safety is seriously threatened by aircraft accidents, which calls for sophisticated prediction models
for precise severity categorization and risk reduction. The intricate, nonlinear linkages found in accident data
are frequently missed by traditional approaches, resulting in less-than-ideal forecasts and postponed
preventive actions. Our research uses machine learning models and deep learning techniques to create a
sophisticated forecasting system for classifying the severity of plane accidents. To increase the dataset's
prediction capacity, we use feature engineering approaches and conduct in-depth Exploratory Data Analysis
(EDA) on historical accident data. We apply the XGB-Classifier after thorough processing and data
organizing, and it achieves an impressive train accuracy of 100% to evaluate accuracy of 95.9%. We create a
model of Convolutional Neural Networks (to improve performance even further, and it first achieves an
accurate training of 97.66% and an accuracy in tests of 93.6%. The model's accuracy is enhanced for both
low-severity incidents (train: 99.13%, test: 96.17%) and high-severity accidents (train: 99.53%, test: 96.93%)
by hyperparameter tuning and severity-specific optimization. By combining both severity levels, the final
CNN model shows a strong predictive performance with an improved train precision of 98.30% and test
accuracy of 97.93%. These results demonstrate how well-structured preprocessing, feature engineering, and
sophisticated deep learning architectures work together to produce a potent tool for immediate accident
severity assessment and aviation safety improvement.
1 INTRODUCTION
Since the beginning of aviation, there has been a
strong focus on aircraft safety, with ongoing efforts to
reduce the likelihood of accidents and enhance
predictive techniques. In the past, accident
investigations used manual research of pilot reports,
flight data, and black box recordings to identify
contributory variables and recommend safety
enhancements. Improved understanding of accident
Over the years, this has been made possible with the
developments in data gathering, sensor technology,
and statistical analysis. Yet aviation accidents do
occur despite stringent safety regulations and
enhanced monitoring systems, warranting better
prediction methods. As the amount of historical
accident data grows, a combination of machine
learning (ML) and deep learning (DL) techniques
presents an opportunity to enhance the accuracy and
efficiency of accident severity classification.
Traditional aviation accident prediction models are
mostly based on rule-based classification technology
and other statistics 16, 17. The prediction capabilities
of these approaches are usually poor, as they often
overlook the complex relationships and nonlinear
patterns present in large-scale aviation data. Several
models such as logistical regression and decision
trees have been applied in order to classify the
severity of accidents, nonetheless, their performance
is bounded due to feature selection problems and
model interpretability. Moreover, most current
approaches focus on individual accident causes
instead as a global forecast according to severity
which leads to suboptimal detection and prevention
policies. In addition, many the research do not
sufficiently address data imbalance, which can result
in biased severity classes, further impeding the
practical applicability of these frameworks in real-
world settings.
To address these challenges, this research
proposes an advanced predictive analytics framework
for determining the severity of flight accidents via
648
Thenmalar, S., Yadav, B. J. K. and Kishore, D. V.
Advanced Predictive Analytics for Aircraft Accident Severity Using Deep Learning.
DOI: 10.5220/0013903400004919
Paper published under CC license (CC BY-NC-ND 4.0)
In Proceedings of the 1st International Conference on Research and Development in Information, Communication, and Computing Technologies (ICRDICCT‘25 2025) - Volume 3, pages
648-656
ISBN: 978-989-758-777-1
Proceedings Copyright © 2025 by SCITEPRESS – Science and Technology Publications, Lda.

applying deep learning techniques. To ensure dataset
quality, the analysis begins with feature engineering
and in-depth exploratory data analysis (EDA). This
research was driven by the industry need to accurately
detect the severity of accidents in order to improve
aviation safety and mitigate risks. With flying
operations increasing all around the world, even with
highly sophisticated safety systems in place, there
remains a risk of an accident occurring. A highly
predictive model can tremendously help in early
identification and allow airlines and civil aviation
authorities to take preventable safety measures. Yet,
this research intends to bridge the gap between a
conceptual approach to safety evaluation and real
time disaster forecasts through deep learning
architectures, ensuring a better decision-support
system for risk management of airlines in the
operations phase. This research aims to build on a
new and novel classification technique to classify
level of the flight accidents incidence of severity of
the flight accidents, the recent deep learning
applications, model have been well known, however
these models are so complex that they do not
implement a structure preprocessing or feature
engineering techniques. Not only does it improve the
prediction accuracy, but combining the ML and DL
models also makes them explainable and flexible for
use in the real world. The work underscores the
importance of advanced AI-powered statistics in
terms of flight safety and demonstrates how deep
learning models could transform accident prevention
strategies. The results are in line with an overarching
goal to minimize accident-related deaths and improve
flight safety through judicious, data-oriented
insights.
2 LITERATURE SURVEY
Several works considered the application of
statistical and machine learning techniques for
evaluating and classifying flight accident severity6.
Early approaches to modelling accident severity with
historical aviation data primarily used traditional
statistical models, such as logistic regression,
decision trees and Bayesian classifiers. To determine
the main causes of accidents, including weather, pilot
expertise, and aircraft type, researchers have used
feature selection techniques. Nevertheless, these
models frequently have trouble processing high-
dimensional data and identifying intricate
correlations between variables. In order to enhance
predictive performance, some research also tried to
employ ensemble techniques like Random Forest and
Gradient Boosting; nonetheless, the outcomes were
frequently limited by unbalanced datasets and the
incapacity to generalize effectively across various
accident circumstances. Additionally, even though
these models produced findings that could be
understood, their accuracy was still below par,
requiring more advanced techniques to improve
predictive power. Madeira et al. uses text preliminary
processing, Natural Language Processing (NLP),
semi-supervised Label Spreading (LS), and
supervised Support Vector Machine (SVM) to
discover and categorize human component categories
from aircraft incident reports. Bayesian optimization
techniques and random search enhance model
performance. With Micro F1 scores of 0.900, 0.779,
and 0.875, the top predictive models had strong
prediction abilities. A bigger data set should be
considered in future studies. Zhang et al. in order to
forecast unfavorable outcomes, this research analyses
National Transportation Safety Board (NTSB)
accident investigation records using data mining and
sequential deep learning algorithms. In order to
develop models for classification for passenger
airlines, the researchers concentrate on written
information that defines event sequences.
Dong et al. suggests identifying causative
elements through the use of deep learning-based
models. An open-source natural language model, an
attention-based long short-term memory model, and
200,000 incident reports from the Aviation Safety
Reporting System (ASRS) are among the data sets
utilized. The suggested method is a viable strategy for
enhancing aircraft safety since it is more precise and
flexible than conventional machine learning
techniques. In order to better analyze aviation
accident data, researchers have begun using neural
networks, namely Convolutional Neural Networks
(CNNs) and Recurrent Neural Networks (RNNs), as
deep learning has become more popular. CNNs have
been demonstrated in many researches works to boost
classification performance by identifying important
patterns in structured accident datasets. To enhance
accuracy and robustness, other studies have applied
hybrid models by combining deep learning and
traditional machine learning methods. Nevertheless,
their contemporary usage for airline safety
management operations is limited due to the nature of
majority of these techniques focusing on large-scale
accident analysis instead of clear-cut impact
classification. Lastly, since deep learning models tend
to require more fine tuning and processing power, it
can make it hard to adopt them in real-time flight
safety systems. Nonetheless, there is still a need for a
comprehensive and high prediction model to classify
Advanced Predictive Analytics for Aircraft Accident Severity Using Deep Learning
649
the severity of accidents accurately, despite these
advancements. Zhang et al., (2021) If the
shortcomings of previous work are to be tackled, this
model would combine machine learning and deep
learning methods.
3 METHODOLOGY
First, we have a structured method of doing
advanced predictive analysis over the ensembles of
neural networks that reflects a state-of-the-art
behavior of our data-driven approach to aircraft
accidents severity analysis. The process starts with an
aggregation of data from trusted sources like the
FAA, NTSB, ASN and BAAA, with data points
including but not limited to: recorder data, aircraft
parameters, pilot and crew info, atmospheric data and
ATC communications, and historical accident
reports. Data is preprocessed, in which Missing
Value treatment, Duplicate Removing, Normalizing
etc. are done. Data preprocessing techniques such as
Principal Component Analysis (PCA) and Recursive
Feature Elimination (RFE) are useful for determining
the most relevant features, while Natural Language
Processing (NLP) techniques like TF-IDF and Word
Embeddings (Word2Vec, BERT) can be applied to
analyze textual accident reports. You are using only
up to October 2023 data for training your models. In
addition, Recurrent Neural Networks (RNNs) and
Long Short-Term Memory (LSTM) networks can be
used for sequential flight data, which extract temporal
dependencies, whereas CNNs are more suitable for
processing image-based data like weather maps and
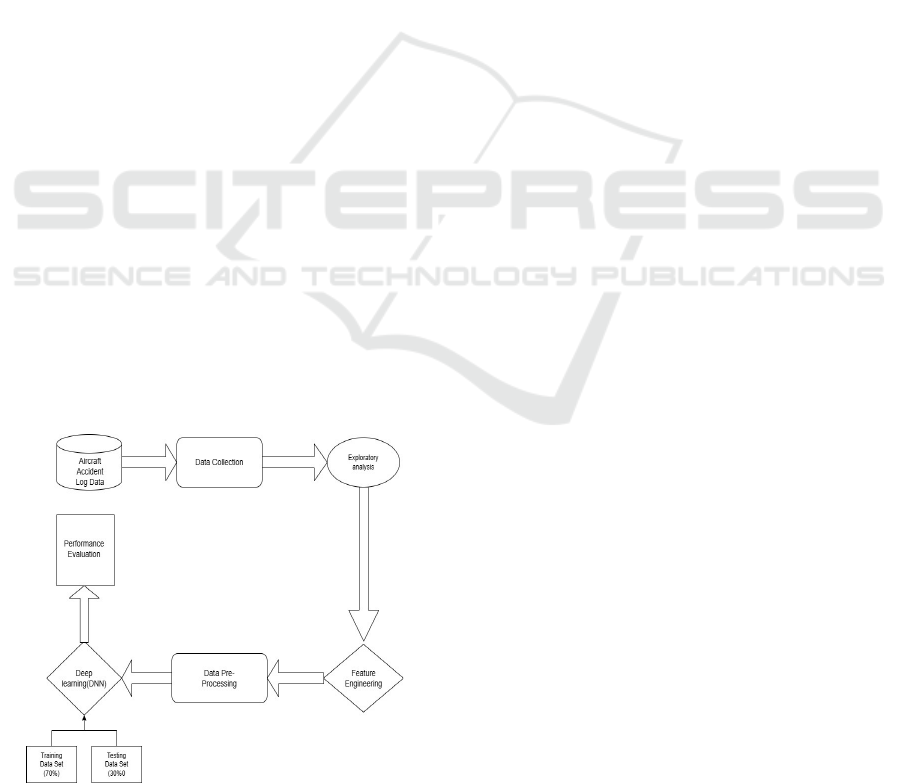
aircraft damage assessments. Figure 1 shows working
methodology.
Figure 1: Working methodology.
It is trained on labelled datasets to predict the
severity of accidents as minor, serious or fatal by
leveraging advanced techniques like transfer
learning, Bayesian Optimization for hyperparameter
tuning and assembling for accuracy improvement.
The performance is evaluated using several metrics
such as accuracy, precision, recall, F1-score, and
AUC-ROC, while validation techniques such as k-
fold cross-validation ensure model generalization. To
mitigate the black-box issue within deep learning,
interpretability techniques (e.g. Shapley Additive
explanations (SHAP)) are utilized to understand
crucial contributing parameters, providing useful
insights to enhance aviation safety. The validated
predictive model is incorporated into real-time
aviation monitoring systems, providing early
warning capabilities to air traffic control, flight
management, and airline safety systems.
Incorporating Real-time Data Continuous retraining
on incoming live data allows the model to adapt
quickly to evolving risks typical of the aviation
industry, improving proactive risk assessment
capabilities and emergency response strategies. This
predictive framework based on deep learning offers a
valuable approach for mitigating aviation accident
severity, enhancing regulatory adherence, and
bolstering the overall safety framework in the
domain of aviation.
3.1 Data Collection
To make sure the data set used in this study was well-
balanced for model evaluation, the 10,000 records
were separated into7,000 training samples and 3,000
test samples. All records contain in the accident data
vital operational and environmental aspects that will
influence the severity of the accident. Among the key
features in this dataset is Safety Score, which is the
numeric representation of the aircraft's overall safety
level, and Severity, denoting the target variable for
classification. Another important feature are Days
Since Inspection (shows service history) and Total
Safety Complaints (previous safety issues). These
provide related to the external effects acting on the
airplane efficacy and manage stability. Also, along
with Accident Type Code which categorizes a range
of accident types, Cabin Temperature was added as a
variable affecting the flight stage. It also features
Violations, a list of any prior infractions made in
relation to the aircraft and Max Elevation provides an
insight into the height of which the event took place.
Finally, Accident ID acts as an identification number
for every incident, and Adverse Weather Metric takes
into consideration the dangerous weather
ICRDICCT‘25 2025 - INTERNATIONAL CONFERENCE ON RESEARCH AND DEVELOPMENT IN INFORMATION,
COMMUNICATION, AND COMPUTING TECHNOLOGIES
650
circumstances that contributed to the accident.
Before the models are trained, this dataset which is
rich in a variety of aviation-related parameters is
preprocessed and improved through feature
engineering in order to increase predicted accuracy.
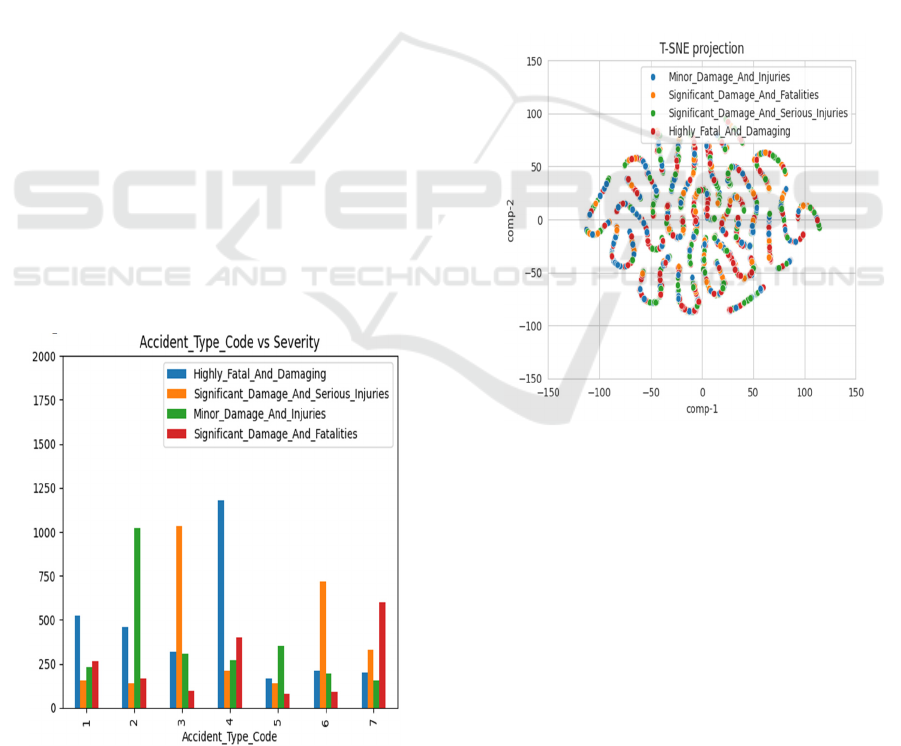
3.2 Exploratory Data Analysis (EDA)
In order to better grasp the dataset, a variety of EDA
and visualization techniques were used to assess class
separability, identify anomalies, and comprehend
feature distribution (as shown in Figure 2). The
spatial distribution of numerical characteristics was
examined using boxplots and histograms. The results
showed that Adverse Weather Measure and Total
Safety Complaints had a significant right skew with
many outliers, suggesting that these variables might
not be reliable indicators of accident severity. Safety
Score, Days Since Inspection, Accident Type Code
and Violations all showed substantial correlations
with accident severity, indicating that these variables
are essential for model training. Correlation heatmaps
also assisted in identifying dependencies between
features. Relationships between variables were
investigated using pair plots and scatter plots, which
showed that some features clearly separated across
accident groups while others showed a great deal of
overlap. Variable distributions across severity levels
were compared using violin plots, which showed that
while Highly Fatal and Damaging and Minor Damage
and Injuries could be clearly distinguished from one
another, the other two classes showed substantial
overlap, which made classification more difficult.
Figure 2: Creating features for analysis.
Additionally, box plots aided in the detection and
management of outliers, especially in variables with
extreme values like Adverse Weather Metric and
Total Safety Complaints. Safety Score, Days Since
Inspection, Accident Type Code, and Regulations
were the most significant criteria in evaluating the
severity of the accident, according to feature
importance analysis using machine learning models.
Two severity classes were found to be well-separated,
while the other two showed significant overlap, as
confirmed by the use of Principal Component
Analysis (PCA) to visualize feature grouping in a
lower-dimensional space. Figure 3 shows
Exploratory Data Analysis. In order to improve
model performance, redundant or less important
features were either eliminated or altered, while the
most pertinent qualities were kept for predictive
modelling. Overall, the EDA results served as a guide
for choosing features and development process.
Figure 3: Exploratory data analysis.
3.3 Data Preprocessing
A strong preprocessing pipeline was put in place to
guarantee that the dataset was properly organized and
training-optimized. In the first stage, missing values
were handled by filling in categorical values with the
most frequent class and imputed numerical
characteristics using the value of the median to avoid
data bias. Box plots and the IQR (Interquartile
Range) approach were used to identify outliers.
Extreme values in highly skewed features, such as
Adverse Weather Measure and Total Safety
Complaints, were either clipped or changed. In order
to prevent redundancy in the final model, highly
correlated features were examined after the dataset
Advanced Predictive Analytics for Aircraft Accident Severity Using Deep Learning
651

was examined for skewness and multicollinearity.
Before encoding categorical variables like Accident
type code were also examined to make sure they were
adequately represented in all classes. A key factor in
enhancing model performance was feature
engineering. To gain a greater understanding of
aviation safety situations, existing traits were
combined to create new features. To better assess an
aircraft's safety reliability, for example, Safety Score
and Violations were integrated to form the Risk Index
feature. Likewise, to more accurately depict flying
stability, Control Metric and Turbulence in forces
were converted into a Stability Score. Recursive
feature elimination (RFE) and mutual information are
two feature selection strategies that were used to
reduce dimensionality and increase computational
efficiency by keeping just the most important
predictors. Safety score, Days Since inspection,
Accident type code and Violations were among the
features that were chosen because they were found to
be very relevant in the assessment of severity.
To guarantee a fair model evaluation, the dataset was
divided into training (70%) and testing (30%) after
feature selection was finished. The following was the
train-test split formula:
𝑇𝑟𝑎𝑖𝑛 𝑆𝑖𝑧𝑒 =
𝑋 𝑇𝑜𝑡𝑎𝑙 𝐷𝑎𝑡𝑎,
𝑇𝑒𝑠𝑡 𝑆𝑖𝑧𝑒 =
𝑋 𝑇𝑜𝑡𝑎𝑙 𝐷𝑎𝑡𝑎 (1)
where 3,000 samples were set aside for testing and
7,000 samples for training. Standard Scaler from sk
learn. preprocessing was then used to standardize
numerical features in order to improve convergence
in deep learning models and normalize data
distribution. The following was the standardization
formula,
𝑋
=
(2)
where 𝜇 is mean of the feature and 𝜎 its standard
deviation. Certain categorical variables, specifically
in the case of Accident type code, can be transformed
into a format that can be supplied to the machine,
without making any ordinal associations, such that
they pertain to which one is not dependent upon the
other; this process is widely known as One-hot
encoding It enabled models to work with this value
types by transforming the category attributes into
many binary columns. After initial processing,
information stacking was applied to merge multiple
models and utilize their collective predictive power.
In this way, CNN was used as a meta-model over the
XGB-Classifier base learner in the stacking process
for improving the severity classification. The stacking
formula that was used:
𝐹𝑖𝑛𝑎𝑙 𝑃𝑟𝑒𝑑𝑖𝑐𝑡𝑖𝑜𝑛 = 𝛼 𝑋 𝑀𝑜𝑑𝑒𝑙
+ 𝛽 𝑋 𝑀𝑜𝑑𝑒𝑙
(3)
where α, β denote the weight coefficients
optimized during model training. This hybrid model
ensured a trade-off between high fidelity of the deep
learning and lack of interpretability of classical ML.
By applying these processing and feature extraction
methods, we successfully optimized the dataset and
achieved significant improvements in accuracy and
generalization performance.
3.4 XG-Boost Classifier
For flight accident severity classification, the stated
research utilized the Extreme Gradient Boosting
(XG-Boost) Classifier, which is a powerful ensemble
learning method based on gradient boosting. Due to
its commonly used way of achieving effectiveness,
scale, and high accuracy in prediction, XG-Boost is a
prominent choice of for handling structured tabular
data. It does this by fitting a sequence of weak
architecture- Trees additively, where each new tree
is built to correct the errors made by the previously
fitted trees. This training works on the principle of
boosting, which can help to lower loss and improve
prediction performance of the model. The objective
function is maximized by the XG-Boost algorithm
and this consists of a regularization term and a loss
function which are defined as follows:
𝑂𝑏𝑗 =
∑
𝐿𝑦
,𝑦
+
∑
Ω𝑓
(4)
where L\left (y_i, {\hat{y}} _j\right) is the loss
function that determines how well the prediction
captures the true value, and \Omega(f_j) is the
regularization term that penalizes model complexity
to avoid overfitting. This research used Grid-Search-
CV to optimize hyperparameters: regularization
terms, learning rate, maximum tree depth, and
number of estimators among them. The final tuned
XGB-Classifier achieved good generalization with a
training accuracy of 100% and a test accuracy of
95.9% while maintaining high precision when
classifying accident severities. One of the key
strengths of XG-Boost is its ability to handle high-
dimensional data, feature interactions, and missing
values efficiently. Also, the model includes advanced
methods such as L1 / L2 regularization, column
subsampling, and row subsampling that help it
generalize better without a huge computational cost.
ICRDICCT‘25 2025 - INTERNATIONAL CONFERENCE ON RESEARCH AND DEVELOPMENT IN INFORMATION,
COMMUNICATION, AND COMPUTING TECHNOLOGIES
652
To achieve that only the most relevant predictors
affect the classification, XG-Boost also involves a
weighted quantile sketch algorithm for fast feature
selection.
4 4 CONVOLUTIONAL NEURAL
NETWORKS
In this research, the Convolutional Neural Network
(CNN), a potent deep learning model, was employed
to categorize the severity of flight accidents.
Although CNNs are frequently employed for image
recognition, they can also process organized tabular
data due to their versatility. In this experiment, CNN
was trained to recognize important linkages that
affect accident severity by learning intricate patterns
from numerical characteristics. CNNs are extremely
effective for tasks such as classification involving
several interacting variables because, in contrast to
typical machine learning models, they can extract
deep representations and capture non-linear
connections. Convolutional layers, functions for
activation, batch normalization, loss layers, and fully
interconnected layers were among the several layers
that made up the CNN architecture utilized in this
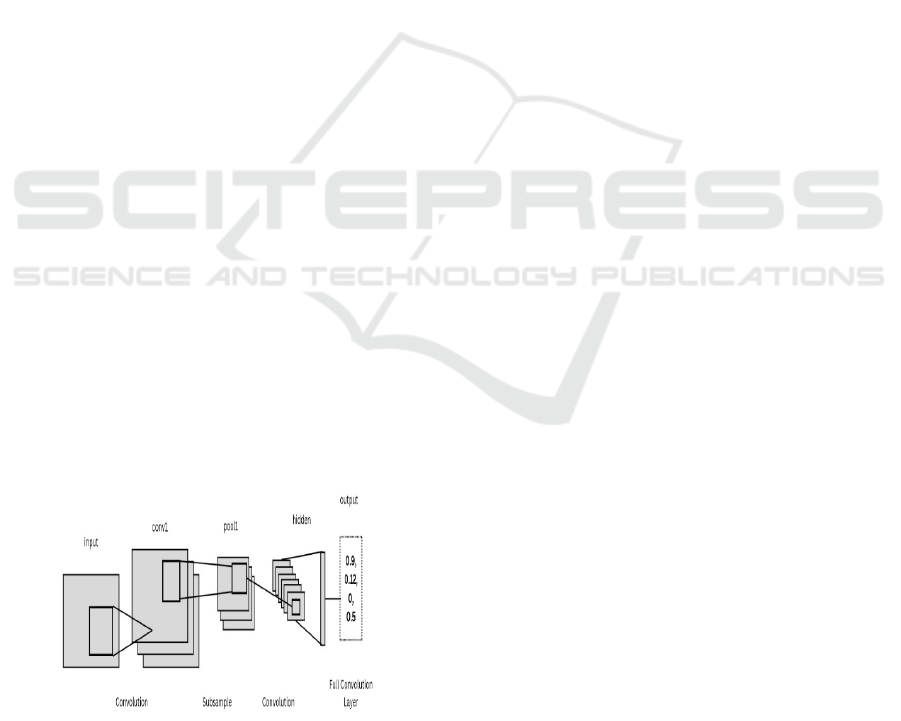
investigation (as shown in Figure 4). Every feature in
the structured incident dataset was handled as a
distinct dimension in an input tensor by the input
layer. In order to discover important parameters
influencing aviation safety, the layers of convolution
applied filters to the data in order to capture spatial
hierarchies. To ensure that the system could learn
intricate linkages, non-linearity was introduced using
activation functions like ReLU (Rectified Linear
Unit). While dropout layers prevented overfitting by
periodically deactivating neurons during training,
batch normalization was used to maintain learning.
Figure 4: CNN model architecture.
The CNN model had an initial training accuracy of
97.66% and a test accuracy of 93.59%. This result
indicated the CNN could generalize to unseen data
while retaining high accuracy. Nevertheless, the CNN
was further tuned by noting that the classifications
could be further optimized if divided into High
Severity and Low Severity. I made this optimization
under the assumption that training the CNNs
separately on the minor incidents and catastrophic
disaster would increase the classification quality
since my investigations had shown the accidents have
distinct patterns. For Low Severity, I accomplished
the following: I trained the CNNs specifically on
incidents falling under the Low-Risk Incidents and
Minor Damage and Injuries. Consequently, the CNN
could focus the technical and behavioral indicators
that are not apparent in high disaster levels, such as
minor safety noncompliance and control metrics
fluctuations. After fine-tuning, the CNNs training
was 99.13%, with a test accuracy of 96.17%. I
optimized this to train on the incidents that are
categorized Major Safety Violations, Highly Fatal
and Damaging, and so on. Common in these
incidences are extreme weather, serious mechanical
malfunctions, and significant safety non-compliance.
The fine-tuning afforded the CNNs the capabilities to
capture high-risk indicator hence the remarkable
training accuracy of 99.53% and a test accuracy of
96.93%. The hybrid approach ensured that the CNN
leant from a significant number of low and
catastrophic disaster cases to secure the optimal
classification accuracy balance. The extracted final
CNN outperformed the initial CNN and XGB-
Classifier as the results show. The training accuracy
was 98.30%, and the test accuracy was 97.93%. CNN
had automatic feature hierarchy extraction, not
requiring feature engineering to construct complex
capacity patterns. CNNs saved the process step of
selecting features from a myriad of features in regular
models that are complex preprocessing routines.
CNNs learned and knew the feature representations
dynamically and were well prepared for the unseen
examples.
Moreover, crucial for CNN’s success was its
ability to handle class disparities. Traditional models
commonly have unbalanced datasets, where fewer
cases may be present in some severity categories than
others. CNN model used data augmentation
techniques such as weighted loss functions and
synthetic sampling to ensure balanced training over
all accident severity categories. The model,
therefore, was capable of producing precise forecasts
for each severity level without favoring the majority
class. The stacking framework at the same time
Advanced Predictive Analytics for Aircraft Accident Severity Using Deep Learning
653
integrated the benefits of CNN and XGB-Classifier
and achieved even better prediction performance.
CNN was given the abilities of deep learning to
capture complex, non-linear interactions whereas
XGB−Classifier provided structured learning and
robust feature selection. The merger of the two
models also showcased the remarkable potential of
deep learning in the field of aviation safety research,
as it produced a highly accurate and reliable accident
severity prediction system. The CNN-based
categorization system that was developed in this
work represents a significant advancement in
statistical analysis used for predicting the severity of
flight accidents. By combining deep learning with
specific fine-tuning procedures, the model achieved
high accuracy and generalization, providing a
powerful tool for enhancing proactive risk
management and aviation safety assessments.
5 RESULTS
The performance of the proposed Aircraft Accident
Severity Prediction Model was evaluated using
accuracy, loss, confusion matrix, and model
comparison. The two main models used for the
research, CNN and XGB-Classifier, were both
optimized to maximize on classification accuracy.
CNN was further improved by dividing the
information into cases of High Severity and Low
Severity, which made it possible to comprehend
accident severity patterns in greater detail. To
ascertain the best method for forecasting the severity
of aircraft accidents, the output of various models was
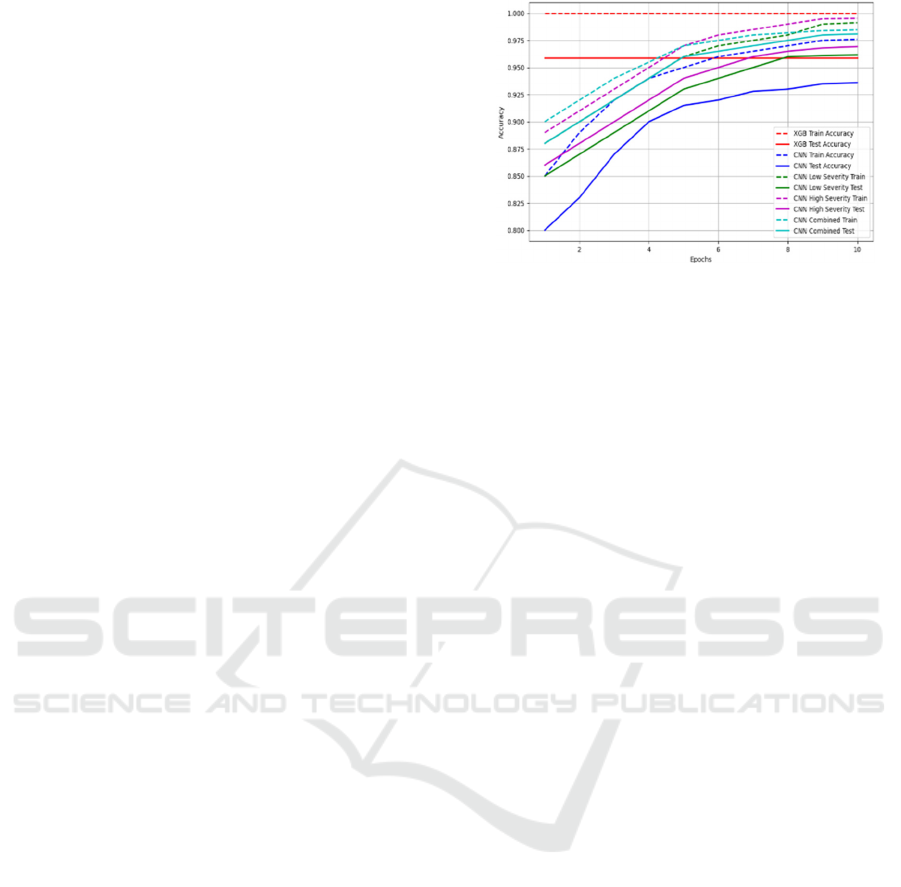
compared. To maximize performance (as shown in
Figure 5), a stacking method was used to train the
XGB-Classifier model on the preprocessed dataset.
Following training, it demonstrated remarkable 100%
train accuracy and 95.9% test accuracy. The model
seems to have successfully captured intricate
correlations in the data, as seen by the nearly flawless
training accuracy. The model did marginally worse
on unknown data, however the test accuracy was still
high and suggested some overfitting. The XGB-
Classifier's confusion matrix revealed that while it
properly classified the majority of cases, there were a
few small misclassifications in severity classes that
overlapped, especially in the categories for moderate
damage and mild injury.
Figure 5: Train and test accuracy of various models.
Prior to any adjustments, the original CNN model
had a 93.59% test accuracy and a 97.66% training
accuracy. CNN had the advantage of automatically
learning feature representations, which allowed it to
identify deeper patterns in the data, even though its
accuracy was marginally lower than that of XGB-
Classifier. While the validation loss stopped slightly,
indicating the need for fine-tuning, the loss curves
exhibited a consistent reduction during training,
showing adequate convergence. Subsequent
examination of the confusion matrix revealed that,
like the XGB-Classifier, there was considerable
overlap in the Medium Damage and Minor Injury
groups, but that the Highly Fatal or Damaging
instances were accurately classified. The CNN model
was adjusted independently for High Severity and
Low Severity instances in order to overcome these
classification issues. The CNN model obtained an
accuracy in training of 99.13% and a test accuracy of
96.17% when trained exclusively for Low Severity
accidents. This showed that by concentrating on
small mishaps, the model could distinguish between
them more successfully, reducing the number of
incorrect classifications. In a similar vein, the CNN
model demonstrated a high degree of ability to
differentiate among fatal collisions and other severe
occurrences, achieving training precision of 99.53%
and test accuracy of 96.93% for High Severity cases.
With a training success rate of 98.47% and a test
accuracy of 98.10%, the final combined CNN model
which combined both Low Severity and High
Severity tuning strategies achieved the best overall
accuracy.
ICRDICCT‘25 2025 - INTERNATIONAL CONFERENCE ON RESEARCH AND DEVELOPMENT IN INFORMATION,
COMMUNICATION, AND COMPUTING TECHNOLOGIES
654
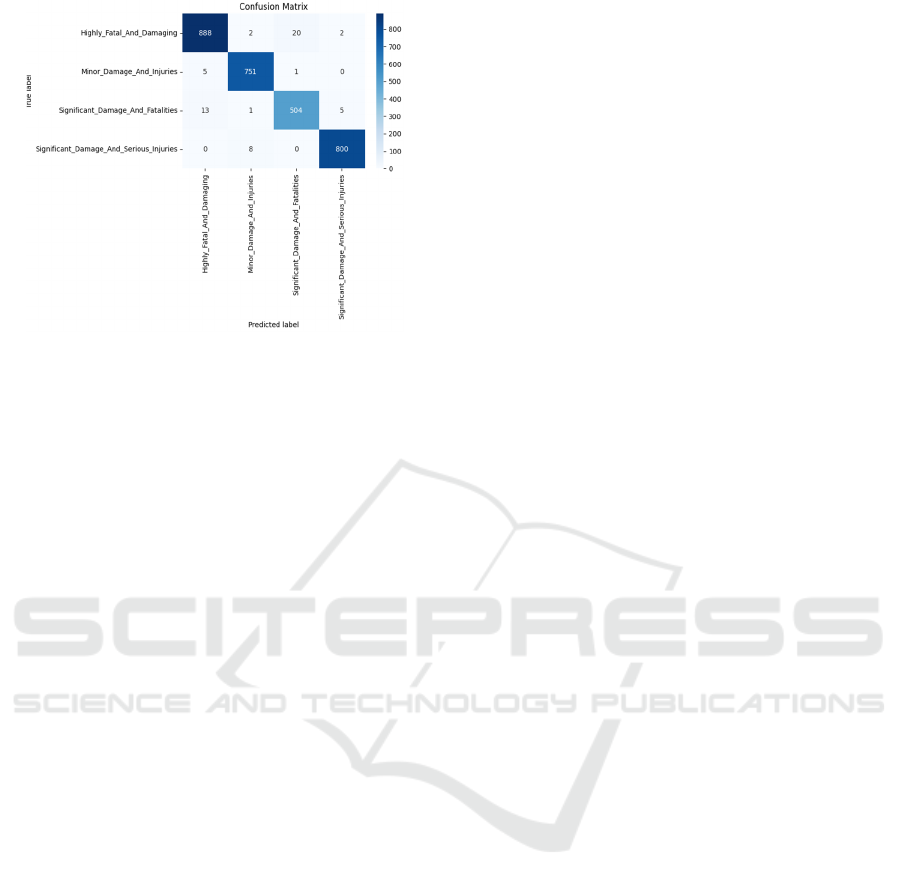
Figure 6: Confusion matrix of various class.
Variations in accident severity across all
categories were well-represented by this model (as
shown in Figure 6). This CNN model considerably
decreased misclassification errors, especially in
moderate and mild accident classes, that were
previously difficult for both XGB-Classifier and the
original CNN model, according to the confusion
matrix comparison. Furthermore, this final CNN
model's loss curves demonstrated smooth
convergence, suggesting improved generalization
over previous iterations. Accuracy and loss plots for
each model were compared in order to further
validate the model's performance. Because of its
flawless training accuracy, the XGB-Classifier model
showed evidence of minor overfitting despite its
quick convergence The CNN models, however,
showed a much-more-steady increase in accuracy,
and loss continued to decrease across epochs. The
adjusted CNN models with the lowest loss curves
were those of High Sensitivity and Little Severity
brackets, which were found to be the best
compromise. The final merged CNN model
demonstrated the most reliable performance with
high accuracy across all severity classifications. As
shown in the comparison of CNN model and XGB-
Classifier, the application of deep learning in
predicting the severity of flight accidents yields
better benefits.
6 CONCLUSIONS
This study provides a comprehensive approach to
predicting the severities of flight accidents using
state-of-the-art machine learning and deep learning
techniques. The dataset was significantly
preprocessed, feature engineered, and exploratory
data analysis (EDA) was carried out to further
enhance model performance. So, these research
articles managing to work with CNN(XGB-
Classifier) which is very capable of giving good
prediction on accident severity. CNN achieved
higher accuracy on the test dataset and had lower
overfitting as compared to XGB-Classifier, which
achieved 95.9% test accuracy on the test dataset.
While we achieved test accuracy levels of 96.17%
and 96.93% (obtaining a loss of 0.087706 & 0.067773
respectively) through further fine-tuning by
separating the two classes of High Severity and Low
Severity cases, we found particularly significant
improvements. The final combination CNN model,
which utilized both severity levels, produced the best
test accuracy of 97.93%, making it the most
successful solution. Through this research, it is
demonstrated that neural network models,
particularly CNN, can learn complex interactions in
aircraft accident data, and therefore serve as a
reliable method for severity classification. The
findings of this research have significant
implications for aviation safety, as they enable
proactive risk assessment and accident prevention
strategies. In future studies, real-time flight data and
accredited publication from airlines can be added to
the model so as to better predictive capabilities.
Urgent: performance can be improved by using
ensemble methods which combine deep learning
with other AI driven methods such as transformer-
based architectures and reinforcement learning. The
utilization of explainable AI (XAI) techniques will
contribute towards enhanced transparency in
decision-making for aviation authorities as well.
Integration of weather patterns as well as pilot
behavior analytics and maintenance records can
enrich the model and may even make a fully
automated and intelligent incident forecasting
system, aiding aviation safety and risk avoidance, a
reality.
REFERENCES
Alahmari, Fahad, Arshi Naim, and Hamed Alqahtani. "E-
Learning modeling technique and convolution neural
networks in online education." IoT-enabled
convolutional neural networks: Techniques and
applications. River Publishers, 2023. 261-295.
Bai, Yuhan. "RELU-function and derived function review."
SHS web of conferences. Vol. 144. EDP Sciences,
2022.
Berhanu, Yetay, Esayas Alemayehu, and Dietrich Schröder.
"Examining Car Accident Prediction Techniques and
Road Traffic Congestion: A Comparative Analysis of
Advanced Predictive Analytics for Aircraft Accident Severity Using Deep Learning
655

Road Safety and Prevention of World Challenges in
Low‐Income and High‐Income Countries." Journal of
advanced transportation 2023.1 (2023): 6643412.
Boddapati, Mohan Sai Dinesh, et al. "Creating a protected
virtual learning space: a comprehensive strategy for
security and user experience in online
education." International Conference on Cognit-ive
Computing and Cyber Physical Systems. Cham:
Springer Nature Switzerland, 2023.
Chand, Arun, S. Jayesh, and A. B. Bhasi. "Road traffic
accidents: An overview of data sources, analysis
techniques and contributing factors." Materials Today:
Proceedings 47 (2021): 5135-5141.
Courtney, Matthew B. "Exploratory data analysis in
schools: A logic model to guide implementation."
International Journal of Education Policy and
Leadership 17.4 (2021): 14-pp.
De Lutio, Riccardo, et al. "Learning graph regularisation for
guided super-resolution." Proceedings of the ieee/cvf
conference on computer vision and pattern recognition.
2022.
Deveci, Muhammet, et al. "A decision support system for
reducing the strategic risk in the schedule building
process for network carrier airline operations." Annals
of Operations Research (2022): 1-37.
Di Mauro, Mario, et al. "Supervised feature selection
techniques in network intrusion detection: A critical
review." Engineering Applications of Artificial
Intelligence 101 (2021): 104216.
Ding, Ning, et al. "Parameter-efficient fine-tuning of large-
scale pre-trained language models." Nature Machine
Intelligence 5.3 (2023): 220-235.
Dong, Tianxi, et al. "Identifying incident causal factors to
improve aviation transportation safety: Proposing a
deep learning approach." Journal of advanced
transportation 2021.1 (2021): 5540046.
Helgo, Malene. "Deep learning and machine learning
algorithms for enhanced aircraft maintenance and flight
data analysis." Journal of Robotics Spectrum 1 (2023):
090-099.
Jia, Weikuan, et al. "Feature dimensionality reduction: a
review." Complex & Intelligent Systems 8.3 (2022):
2663-2693.
Kumar, Pradeep, et al. "Classification of imbalanced data:
review of methods and applications." IOP
conference series: materials science and engine-ering.
Vol. 1099. No. 1. IOP Publishing, 2021.
Li, Xuan, et al. "From features engineering to scenarios
engineering for trustworthy AI: I&I, C&C, and V&V."
IEEE Intelligent Systems 37.4 (2022): 18-26.
Liu, Huipeng, Minghua Hu, and Lei Yang. "A new risk
level identification model for aviation safety."
Engineering Applications of Artificial Intelligen-ce
136 (2024): 108901.
Madeira, Tomás, et al. "Machine learning and natural
language processing for prediction of human factors in
aviation incident reports." Aerospace 8.2 (2021): 47.
Mazarei, Arefeh, et al. "Online boxplot derived outlier
detection." International Journal of Data Science and
Analytics (2024): 1-15.
Rodriguez, Jose, et al. "Latest advances of model predictive
control in electrical drives Part I: Basic concepts and
advanced strategies." IEEE Transactions on Power
Electronics 37.4 (2021): 3927-3942.
Shreffler, Jacob, and Martin R. Huecker. "Exploratory data
analysis: Frequencies, descriptive statistics,
histograms, and boxplots." StatPearls [Internet].
StatPearls Publishing, 2023.
Singh, Dalwinder, and Birmohan Singh. "Feature wise
normalization: An effective way of normalizing data."
Pattern Recognition 122 (2022): 108307.
Valente, Francisco, et al. "Interpretability, personalization
and reliability of a machine learning based clinical
decision support system." Data Mining and Knowledge
Discovery 36.3 (2022): 1140-1173.
Wang, Huanxin, et al. "An analysis of factors affecting the
severity of marine accidents." Reliability Engineering
& System Safety 210 (2021): 107513.
Zhang, Fan. "A hybrid structured deep neural network with
Word2Vec for construction accident causes
classification." International Journal of Construction
Management 22.6 (2022): 1120-1140.
Zhang, Xiaoge, Prabhakar Srinivasan, and Sankaran
Mahadevan. "Sequential deep learning from NTSB
reports for aviation safety prognosis." Safety science
142 (2021): 105390.
ICRDICCT‘25 2025 - INTERNATIONAL CONFERENCE ON RESEARCH AND DEVELOPMENT IN INFORMATION,
COMMUNICATION, AND COMPUTING TECHNOLOGIES
656
