
Weight Initialization‑Based Rectified Linear Algorithm for Accurate
Prediction of Chronic Heart Disease Compared with PCHF Feature
Engineering Technique
S. S. Deepak Senni and M. Krishnaraj
St Joseph’s Institute of Technology, Chennai, Tamil Nadu, India
Keywords: Cardiovascular Disease Prediction, Supervised Learning, Artificial Intelligence (AI), Weight
Initialization‑Based Rectified Linear Algorithm (WiReL), PCHF Algorithm, Medical Data Analysis, AI
Cardiologists, Patient Risk Assessment, Generative AI, Federated Learning.
Abstract: Cardiovascular disease continues to pose a significant challenge to global health, underscoring the critical
need for early and precise prediction to enable effective preventive strategies. This paper investigates the
promising role of supervised learning techniques within the realm of Artificial Intelligence (AI) for predicting
heart disease. We explore notable advancements in various algorithms, including logistic regression (LR),
support vector machines (SVM), and deep neural networks (DNN), emphasizing their ability to uncover
intricate patterns within extensive medical datasets. Moreover, the research highlights the capacity of AI-
enhanced cardiologists to analyze a wide array of patient data, encompassing demographics, medical histories,
lab test outcomes, and ECG readings. Such comprehensive evaluations promise to enhance the accuracy and
personalization of risk assessments, potentially facilitating earlier interventions and improving patient
outcomes. This study also addresses the significant challenges related to data quality, the mitigation of biases,
and the explainability of AI models, highlighting the need for ethical considerations in their design and
deployment. We classify ECG stages utilizing two models: a Cardiology model based on Machine Learning
techniques with a specific dataset and a Deep Learning Model focused on identifying cardiovascular disease
through ECG image classification. Additionally, the application of the Weight Initialization-Based Rectified
Linear Algorithm (WiReL) for heart disease prediction underscores the integration of optimized weight
initialization principles along with ReLU activation within a deep learning context. Our findings demonstrate
that the WiReL algorithm outperforms the Principal Component Heart Failure (PCHF) Feature Engineering
Technique in terms of predictive accuracy. Furthermore, this paper discusses potential future advancements
in AI-driven heart disease prediction, considering the implications of emerging methodologies such as
Generative AI and federated learning to further enhance this vital field. Our proposed research offers
meaningful contributions to medical science and its endeavors in combating cardiovascular disease.
1 INTRODUCTION
Heart failure represents a condition in which the heart
struggles to pump an adequate volume of blood to
meet the body's demands. Cardiovascular illnesses
have emerged as a major worldwide health problem.,
profoundly impacting public health across the world.
Heart failure, in particular, is a common and deadly
disorder affecting millions of people. The
incorporation of machine learning into medical
diagnostics and the larger healthcare sector has shown
much potential. Its application is many, including
drug discovery, diagnostic imaging, outbreak
forecasting, and heart failure prediction. By deriving
insights from extensive medical datasets, machine
learning techniques facilitate predictive analysis.
When compared to conventional medical
methodologies, machine learning offers noteworthy
advantages, including savings in time and costs,
thereby enhancing diagnostic efficiency (
M. Qadri et
al., 2023)
.
We are pleased to share our key research
contributions towards the detection of heart failure
using machine learning. Our proposed novel WiReL
(Weight Initialization-Based Rectified Linear)
algorithm represents an innovative strategy that
combines advanced weight initialization techniques
with the attributes of the Rectified Linear Unit
618
Senni, S. S. D. and Krishnaraj, M.
Weight Initialization-Based Rectified Linear Algorithm for Accurate Prediction of Chronic Heart Disease Compared with PCHF Feature Engineering Technique.
DOI: 10.5220/0013902900004919
Paper published under CC license (CC BY-NC-ND 4.0)
In Proceedings of the 1st International Conference on Research and Development in Information, Communication, and Computing Technologies (ICRDICCT‘25 2025) - Volume 3, pages
618-626
ISBN: 978-989-758-777-1
Proceedings Copyright © 2025 by SCITEPRESS – Science and Technology Publications, Lda.

(ReLU) activation function. This approach is
specifically designed to predict the likelihood of heart
disease. By training a deep learning model with
comprehensive patient data, including demographics,
medical histories, laboratory results, and ECG
readings, we aim to analyze electrocardiograms
(ECGs) with precision. Our system adeptly identifies
complex patterns within the data, learns hierarchical
structures automatically—minimizing the need for
elaborate feature engineering—and enhances training
efficiency, thus improving performance in deep
architectures when compared to the existing PCHF
engineering technique. This robust system has the
potential to assess a patient’s risk of enabling
healthcare providers to implement tailored preventive
measures and initiate timely interventions, ultimately
enhancing patient outcomes. Nevertheless, it is
imperative to uphold data quality, mitigate bias, and
ensure interpretability (or explain ability) of AI-
driven decisions, all of which are critical for the
responsible adoption of these technologies.
We advocate for the utilization of our WiReL
algorithm to further refine performance by focusing
on the most pertinent features. This technique not
only identifies but also prioritizes essential dataset
characteristics with significant importance values,
thereby advancing the development of machine
learning models. By innovatively assembling a new
feature set, we have optimized the WiReL framework
to attain superior accuracy scores compared to
previously established methods. Additionally, we
conduct hyperparameter tuning for each machine
learning approach to pinpoint the optimal parameters,
resulting in enhanced accuracy outcomes.
2 RELATED WORKS
This section presents a comprehensive review of the
literature pertinent to our proposed research study,
examining previous investigations concerning heart
failure prediction. The findings and methodologies of
related research are systematically discussed and
compared.
In Study (
A. U. Hassan et al., 2022), the focus is on
the broader category of cardiovascular disease,
commonly known as heart disease. This includes
different conditions impacting the heart, which has
regrettably become the leading cause of mortality
worldwide in recent decades. Given the multitude of
risk factors associated with heart disease, there is a
pressing need for accurate and reliable methods of
early diagnosis to facilitate timely treatment. Within
healthcare, data analysis is crucial for managing and
understanding large datasets. Researchers employ a
range of statistical and machine learning approaches
to examine complex medical data, supporting
clinicians in anticipating cardiac problems.
The study (
A. U. Hassan et al., 2022) looks at several
aspects of heart illness and proposes a prediction
model based on supervised learning techniques
including Random Forest (RF), Decision Tree (DT),
and Logistic Regression. Using an existing dataset
from the UCI Cleveland database, which has 303
entries and 76 characteristics, the study evaluates 14
chosen features. The aim is to forecast the chance of
individuals developing heart disease, and the data
show that logistic regression has the highest accuracy
score of any approach studied.
Furthermore, dynamic CT image sequence
registration is a crucial preprocessing step for the
clinical evaluation of numerous cardiac physiological
parameters., including both global and regional
myocardial perfusion. In an innovative Approach,
we suggest a deep learning-based image registration
method that is specifically designed for quantitative
myocardial perfusion CT evaluations. This method is
capable of overcoming unique challenges, including
low image quality with limited anatomical landmarks,
fluctuating contrast agent concentrations within heart
chambers, and alignment difficulties that result from
cardiac stress, respiration, and patient movement.
(
Saboor et al., 2022).
To accommodate for temporal local contrast
variations, the proposed method utilizes a recursive
cascade network, a ventricular segmentation module,
and a unique loss function. The model is trained and
validated using data from 118 individuals with known
or suspected coronary artery disease and/or aortic
valve insufficiency. The results show that the
approach effectively registers dynamic cardiac
perfusion sequences, decreasing local tissue
displacements in the left ventricle (LV) while
maintaining contrast accuracy and CT (HU) values
throughout the series. Furthermore, the deep learning
technology has incredible processing speed, greatly
surpassing previous picture registration algorithms,
highlighting its potential for standardizing
quantitative cardiac perfusion CT in routine clinical
use.
The importance of accurate and reliable diagnoses
of cardiac disease cannot be overstated, particularly
as the incidence of fatalities from heart attacks
continues to escalate (
S. Sarah et al., 2021). Early
diagnosis is critical for prompt treatment of cardiac
problems. Using datasets from the University of
California, Irvine (UCI) repository, numerous
supervised machine learning approaches have been
Weight Initialization-Based Rectified Linear Algorithm for Accurate Prediction of Chronic Heart Disease Compared with PCHF Feature
Engineering Technique
619

examined to predict cardiac disease, including K-NN,
DT, LR, Naïve Bayes, and SVM.
The findings suggest that Logistic Regression
surpasses other classifiers across performance metrics
(
P. Rani et al., 2021), exhibiting a lower risk level with
fewer false negatives, as highlighted by confusion
matrix comparisons. The potential for enhancing
classifier. accuracy through ensemble methods is also
noted. To facilitate the implementation of these
models, Jupiter Notebook serves as an effective tool,
providing an array of libraries and modules
supportive of precise and accurate analyses.
In recent years, there has been a significant uptick
in interest toward auxiliary diagnostic technologies
for cardiovascular disease, particularly through the
detection of abnormal heart sounds (
G. O. Young.,
1964)
. Heart sound signals hold great promise for the
early diagnosis of cardiovascular conditions. Previous
study has mostly focused on the local aspects of heart
sounds., this work presents a unique approach for
mapping complicated heart sound patterns into fixed-
length feature embeddings, known as HS-Vectors, for
abnormality detection. To successfully capture the
comprehensive embedding of complicated heart
sounds, HS-Vectors (
W.-K. Chen., 1993) are developed
employing the compressed time and time delay
frequency expansion. A Dynamic Masked Attention
(DMA) module supplements the TCFE-TDNN neural
network (
A. U. Hassan et al., 2022). HS-Vectors are
intended to extract and highlight critical global heart
sound properties by filtering out irrelevant
information. The TCFE-TDNN module converts
cardiac sound signals over defined time periods into
fixed-length embeddings. The DMA module, which
includes a learnable masked attention matrix,
combines multiscale hidden features from
TCFETDNN layers to efficiently remove
inconsequential frame-level items.
The method was carefully validated using 10-fold
cross-validation (
H. Poor., 1985) on both the 2016
Physio Net Challenge dataset and a newly collected
pediatric heart sound dataset. The findings indicate
that the proposed technique has promising potential
for improving cardiac disease prediction when
compared to existing cutting-edge models (
Saboor et
al., 2021).
3 PROPOSEDMETHODOLODY
In this study, we examine a heart failure dataset
sourced from Kaggle, which comprises 1,025 patient
records, including both cases of heart failure and
healthy individuals. To enhance the dataset's quality,
we implement a range of data preprocessing
techniques, followed by exploratory data analysis that
provides valuable insights into patterns and variables
associated with heart failure. We employed the
Weight Initialization-Based Rectified Linear
(WiReL) Algorithm for predicting heart disease,
focusing on identifying the most pertinent features to
optimize the model's performance.
The WiReL algorithm is specifically designed to
improve machine learning model effectiveness by
selecting the most significant features from the
dataset. The dataset encompasses a variety of
attributes, such as age, sex, BP, cholesterol levels,
ECG results, and other relevant medical data. WiReL
processes inpatient data—consisting of 13 features
from the Kaggle dataset—utilizing layers with ReLU
as the activation function to accurately model
complex relationships. By assigning weights to
features based on their importance, the dataset is
divided into training and testing subsets. Ultimately,
the model produces probability scores or class
predictions regarding heart disease, demonstrating
enhanced accuracy. Our proposed model shows
promise in surpassing existing predictive methods,
positioning it as an efficient tool for heart failure
prediction.
3.1 Predictive Model
Machine learning fundamentally depends on the
careful collection of data, particularly a significant
amount of historical and raw information. However,
it's important to note that raw data requires
preprocessing before it can be effectively utilized for
analysis. (
P. Rani et al., 2021) This crucial step ensures
that the data is transformed into a suitable format.
Once this preprocessing is complete, appropriate
methods and models are selected for the analysis. The
chosen model undergoes a training and testing phase
to verify its performance and accuracy in making
predictions while minimizing errors. To maintain and
enhance the model's accuracy over time, it is
beneficial to periodically fine-tune it, as exemplified
in Figure 1.
ICRDICCT‘25 2025 - INTERNATIONAL CONFERENCE ON RESEARCH AND DEVELOPMENT IN INFORMATION,
COMMUNICATION, AND COMPUTING TECHNOLOGIES
620
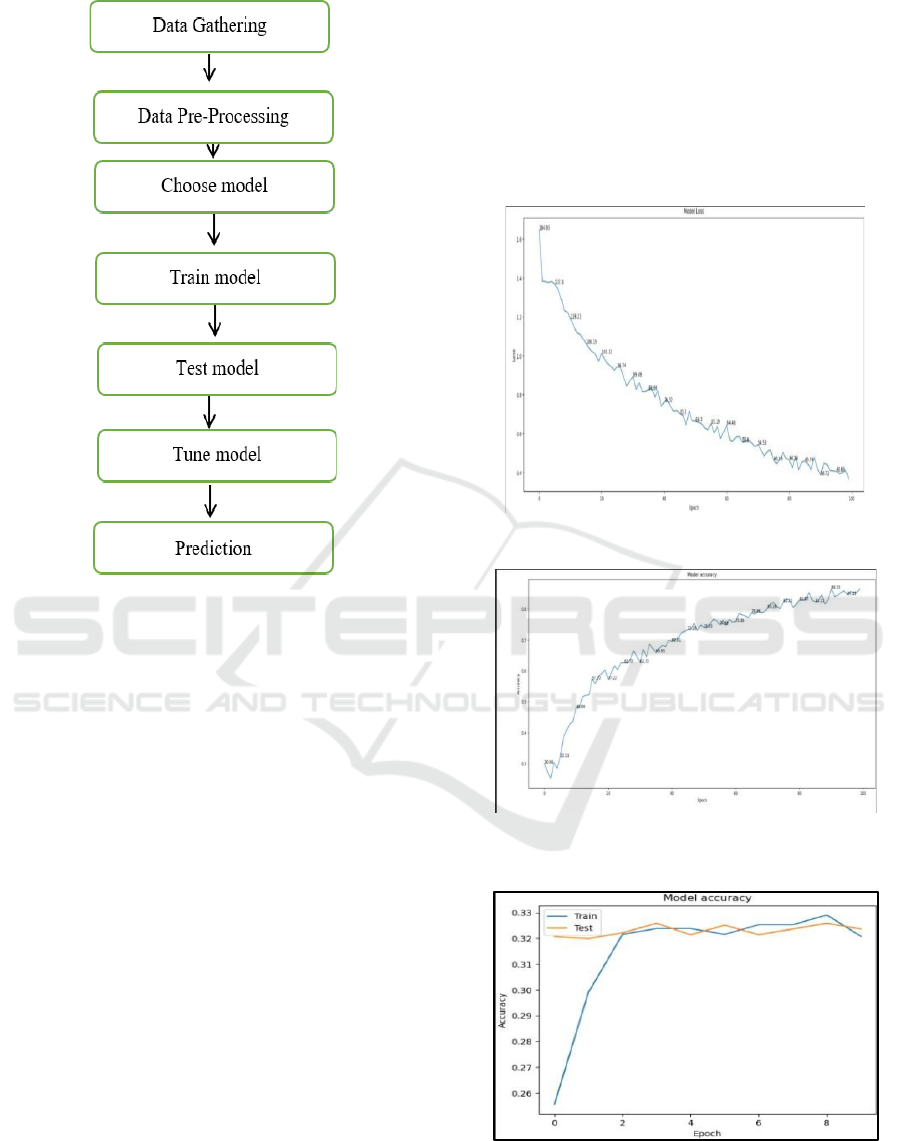
Figure 1: Predictive Model Process.
By thoughtful adapting Lent’s architecture and
training methodologies to better suit heart disease
data, it stands to serve as a highly effective predictive
model, particularly for image- based diagnostic tools.
This adaptability allows LeNet to automatically
extract relevant features from medical images,
thereby minimizing the necessity for extensive
manual feature engineering (
K. Chohan and D. C.
Dobhal., 2022)
. Its relatively shallow architecture
makes it particularly well-suited for the small datasets
that are often encountered in medical research. In the
case of ECG plots, LeNet is capable of processing
these images directly. If necessary, it is advisable to
convert medical imaging data into grayscale format.
Additionally, applying augmentation techniques,
such as rotation and flipping, can enhance the model's
generalization capabilities. It is also important to
normalize pixel intensity values to ensure they fall
within a specified range, such as [0, 1]. To align with
the specific requirements of heart disease prediction,
adjustments should be made to LeNet’s output layer.
This entails replacing the original 10-class output
layer, designed for digit classification, with a binary
output layer for predicting the presence or absence of
the disease, or alternatively, multiple nodes for multi-
class classification to reflect varying stages of disease
severity. Depending on the classification approach,
using a sigmoid activation function for binary
outcomes or softmax for multi- class scenarios is
recommended. Finally, a comparative analysis
between LeNet and conventional manual predictive
models is illustrated, providing insights into the
relative performance and efficacy of each approach as
demonstrated in Figures 2 and 3 for LeNet, and
Figures 4 and 5 for the manual predictive model (
S.
Sarah et al., 2022).
Figure 2: Graph for Model Loss for Lanet Predictive Model.
Figure 3: Graph for Model Accuracy for Lanet Predictive
Model.
Figure 4: Graph for Model Accuracy for Manual Predictive
Model.
Weight Initialization-Based Rectified Linear Algorithm for Accurate Prediction of Chronic Heart Disease Compared with PCHF Feature
Engineering Technique
621
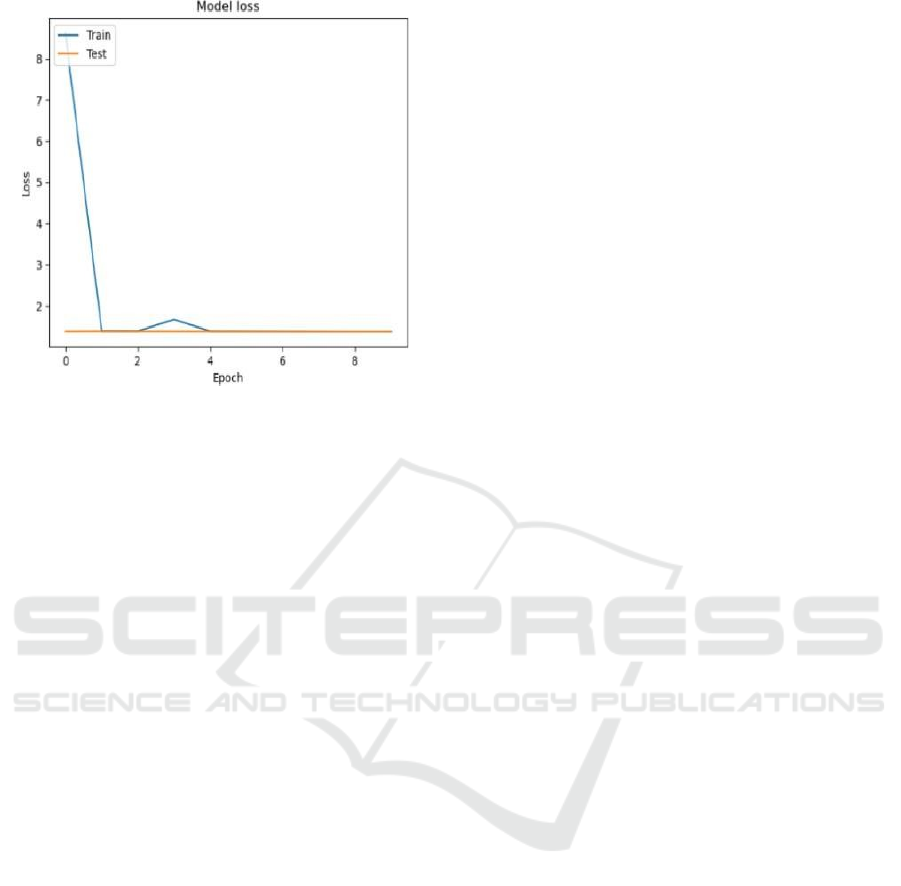
Figure 5: Graph for Model Loss for Manual Predictive
Model.
3.2 Data Pre-Processing
Validation techniques in machine learning estimating
the error rate of an ML model with the intent of
closely approximating the true error rate of the
dataset. While a large and representative dataset can
sometimes reduce the necessity for rigorous
validation, it is important to acknowledge that real-
world scenarios often present challenges where data
samples may not fully encapsulate the population
they aim to represent (
P. Rani et al., 2021).
In this context, validation becomes critical in
addressing potential issues such as missing values,
duplicate entries, and the accurate characterization of
data types, such as distinguishing between float and
integer variables. These techniques not only support
unbiased evaluations of the model's performance on
the training dataset but also assist in the careful fine-
tuning of hyperparameters (
G. O. Young., 1964),
ultimately leading to enhanced model performance.
It is essential to recognize that the evaluation
process can become increasingly influenced by the
model's performance on the validation dataset, which
may guide its configuration. Thus, while the
validation set serves to assess a model's effectiveness,
it is frequently utilized for ongoing evaluations,
enabling machine learning engineers to iteratively
refine the model’s hyperparameters.
Moreover, the tasks of data collection, analysis,
and addressing data quality, content, and structural
issues can require significant time and attention.
During the initial data identification phase, gaining a
deep understanding of the dataset and its
characteristics is imperative. This understanding not
only enhances preprocessing efforts but also
facilitates the selection of the most fitting algorithm
for model development.
3.3 Data Validation / Cleaning /
Preparing Process
To begin the process, it is essential to thoughtfully
import the necessary library packages and carefully
load the provided dataset. An initial analysis of the
dataset should involve a comprehensive variable
identification, with particular attention to its structure,
data types, and any potential issues such as missing
or duplicate values. It is advisable to hold back a
validation dataset from the training process, as this
can play a vital role in estimating the performance of
a model during the tuning of models and procedures.
The careful and appropriate use of validation and test
datasets is paramount for achieving reliable model
evaluation (
W.-K. Chen., 1993).
Moreover, the stages of data cleaning and
preparation include thoughtful actions such as
renaming the dataset, removing any superfluous
columns, and employing various analytical
techniques, including univariate, bivariate, and
multivariate analysis. The specific steps and
techniques may vary based on the unique
characteristics of the dataset at hand (
H. Poor., 1985).
The primary goal of data cleaning is to identify and
rectify any errors, inconsistencies, or anomalies,
thereby significantly enhancing the reliability and
applicability of the data in analytics and informed
decision-making.
3.4 Exploration Data Analysis of
Visualization
Data visualization plays an essential role in applied
statistics and machine learning, enriching the
quantitative aspects of statistics with valuable
qualitative insights. While statistical methods focus
primarily on numerical data and estimations, data
visualization provides effective tools for exploring
datasets, identifying underlying patterns, detecting
outliers, and revealing any inconsistencies in the data.
When combined with domain expertise,
visualizations can adeptly illustrate key relationships,
making complex information more intuitive and
impactful for stakeholders compared to traditional
numerical metrics like associations or significance
levels. By utilizing charts and plots, we can transform
intricate insights into accessible and actionable
knowledge, thereby bridging the gap between
technical analysis and practical decision-making (
J.
ICRDICCT‘25 2025 - INTERNATIONAL CONFERENCE ON RESEARCH AND DEVELOPMENT IN INFORMATION,
COMMUNICATION, AND COMPUTING TECHNOLOGIES
622

Wang).
Preprocessing is a critical phase that entails
applying transformations to data before it is
introduced to a machine learning algorithm. This
significant step prepares raw data— often derived
from diverse sources—by transforming it into a clean
and structured format suitable for analysis. To ensure
that a machine learning model performs optimally, it
is imperative to appropriately prepare the data.
Specific algorithms, such as Random Forest, have
unique requirements; for instance, they don't
accommodate null values. Thus, effectively managing
null values is vital prior to applying such algorithms
to the dataset. Furthermore, preprocessing guarantees
that the dataset is formatted appropriately for various
machine learning and deep learning algorithms. This
adaptability opens the door for experimentation with
different models, helping to identify the most
effective one for the given dataset and ultimately
enhancing the overall efficiency and accuracy of the
analysis (
J. Kaufman., 1995).
4 COMPARISON ALGORITHM
Consistently comparing the performance of a
proposed algorithm with existing algorithms is of
utmost importance in the field of machine learning (
Y.
Yorozu et al.,)
. Python, in conjunction with libraries
such as scikit-learn, offers a robust framework that
facilitates these comparisons effectively. Each model
tends to exhibit distinct performance characteristics,
and employing resampling methods like cross-
validation can provide valuable estimates of a
model’s potential performance on unseen data. These
insights are instrumental in identifying the models
that stand out among a suite of developed options (
J.
Wang., 1987)
.
When engaging with a new dataset, it can be
advantageous to utilize various visualization
techniques to explore the data from multiple angles.
This principle extends to model selection as
wellemploying diverse visualization methods can
greatly aid in examining metrics such as average
accuracy, variance, and other statistical attributes
related to model performance. Such visual insights
enrich our understanding and enhance the decision-
making process involved in selecting the most suitable
model. A fair comparison of machine learning
algorithms hinges on the premise of uniform
evaluation across all models, ensuring they are
assessed on the same data using a consistent test
harness. This method not only mitigates bias but also
guarantees that any performance differences stem
solely from the algorithms' inherent capabilities,
rather than external variances linked to data or
evaluation strategies.
Utilizing a standardized test harness, be it through
cross- validation or a fixed train-test split, ensures that
each algorithm operates under consistent training and
testing conditions. This level of consistency
contributes to a reliable assessment of their respective
strengths and weaknesses, ultimately leading to a
more objective selection of the best- performing
model
4.1 The K-Fold Cross Validation
To ensure a fair evaluation of machine learning
algorithms, it is essential to maintain consistent data
handling practices. This can be accomplished by
configuring the same random seed, which allows for
identical training data splits across different
algorithms. Before embarking on the comparison of
various algorithms, one can create a machine learning
model utilizing Scikit-learn. This involves installing
the library and performing important preprocessing
operations such as correcting missing values, scaling
features, and encoding categorical variables. Models
such as Logistic Regression from the linear model
module, Random Forest from the ensemble module,
and Decision Tree Classifier from the tree module are
excellent choices to consider. Employing cross-
validation methods, like K-Fold, will contribute to a
more robust performance evaluation. Furthermore,
train test split may effectively divide the dataset into
training and testing sets, allowing the model's
performance on previously unknown data to be
evaluated. Ultimately, each model can be trained and
tested, utilizing metrics such as accuracy to predict
outcomes and compare results. This structured
approach enables the identification of the best-
performing algorithm in a systematic manner while
ensuring fairness and consistency throughout the
evaluation process.
5 PCHF ENGINEERING
TECHNIQUE
The PCHF Technique encompasses the application of
Principal Component Analysis (PCA) and related
dimensionality reduction methods specifically
designed for predicting heart failure. This approach
aims to highlight the most pertinent features that
influence heart failure outcomes by transforming the
dataset into a more compact set of principal
Weight Initialization-Based Rectified Linear Algorithm for Accurate Prediction of Chronic Heart Disease Compared with PCHF Feature
Engineering Technique
623

components while preserving the majority of the
variance (
J. Wang., 1987). Data collection involves the
systematic gathering of clinical and diagnostic
information relevant to heart failure prediction.
Following this, data preprocessing and correlation
analysis are conducted, after which Principal
Component Analysis (PCA) is applied to minimize
dimensionality and identify the principal components
features the account for the most significant variance.
Finally, feature selection and model training are
undertaken to improve the predictive capabilities of
the model.
5.1 PCHF Process
Step 1: Data to standardize with zero mean and unit
variance.
Step 2: Apply PCA to find the most significant
components.
Step 3: Select components explaining at least 95%
of the variance.
Step 4: Train and evaluate models on the reduced
dataset.
The PCHF technique helps focus on the critical
variables influencing heart failure, enabling robust
and efficient prediction models that are easier to
interpret and apply in clinical settings. Feature
selection identifies the most relevant features for
heart disease prediction, improving the classifier's
performance and interpretability.
5.2 Bagging Classifier
Bagging, or bootstrap aggregation, serves as an
effective ensemble learning approach designed
primarily to mitigate variance in noisy datasets. This
approach selects random chunks of data with
replacement, enabling certain data points to be picked
more than once. Once these diverse samples are
generated, individual models are trained
independently on each one. In regression tasks, the
final prediction is generated by averaging the results,
whereas in classification tasks, a majority vote is used
(
J. Magn.Jpn., 1987). Notably, the Random Forest
algorithm can be viewed as a sophisticated extension
of bagging, as it incorporates feature randomness
along with the principles of bagging to construct an
uncorrelated ensemble of decision trees. This
combination not only enhances the robustness of the
model but also improves overall accuracy. Bagging is
particularly beneficial in addressing overfitting in
both classification and regression scenarios. Its major
goal is to improve the accuracy and performance of
machine learning algorithms by producing diverse
subgroups of the original dataset and fitting
appropriate classifiers or regressors to each subgroup.
By aggregating the predictions from multiple models,
bagging effectively reduces variance, thereby
enhancing the model’s stability. This technique plays
a crucial role in navigating the bias-variance trade-
off, as it diminishes variance without substantially
increasing bias. As such, bagging is widely
recognized for its effectiveness in managing
overfitting, especially when applied to decision tree
algorithms in various classification and regression
tasks (
Y. Yorozu et al.,).
5.3 BernouliNB
To effectively analyze heart disease, we utilize
datasets that encompass various features such as age,
cholesterol levels, BP and exercise-induced angina,
among others. A prudent approach is to transform
continuous features into binary values based on
established thresholds. For instance, we can designate
cholesterol levels as 1 if they exceed a threshold (e.g.,
200 mg/dL), and 0 otherwise. Similarly, we can
categorize age as 1 if it is above a specified age (e.g.,
50 years), and 0 otherwise. Regarding resting blood
pressure, we can label it as
1 if it is above 130 mmHg,
and 0 otherwise. In addition to these transformations,
it's essential to encode categorical features, such as
sex and chest pain type, using one-hot encoding for
clarity in analysis. For our target
variable, we
will define it as 1 to indicate the presence of heart
disease and 0 to denote its absence. With this
preprocessed binary dataset, we can proceed to train
the Bernoulli Naive Bayes (Bernoulli) model (
J.
Magn.Jpn., 1987)
. This model effectively calculates the
likelihood of each feature being either 0 or 1 for the
two distinct classes: the presence or absence of heart
disease. For any new patient's binary feature set, the
model will compute the posterior probabilities for
each class in accordance with Bayes' theorem, thereby
assisting in informed decision- making.
𝑷(𝒀|𝑿) =
𝑷(𝑿|𝒀)𝑷(𝒀)
𝑷(𝑿)
(1)
Where:
• P(X|Y): Likelihood of the data given the
class.
• P(Y): Prior probability of the class.
• P(X): Evidence (normalizing constant).
The model predicts the class with the highest
posterior probability.
ICRDICCT‘25 2025 - INTERNATIONAL CONFERENCE ON RESEARCH AND DEVELOPMENT IN INFORMATION,
COMMUNICATION, AND COMPUTING TECHNOLOGIES
624

6 RESULTS AND DISCUSSION
6.1 Prediction of Accuracy
WiReL: This technique is a neural network-based
model, which involves weight initialization and
rectified linear units (ReLU) for activation. After
training the model, use the test dataset to predict heart
disease outcomes (positive or negative). Calculate the
accuracy by comparing the predicted results to the
actual outcomes in the test set
J. Wang.
𝐴𝑐𝑐𝑢𝑟𝑎𝑐𝑦 =
(2)
The accuracy achieved by WiReL in heart disease
prediction depends on the quality of the dataset and
the hyperparameter tuning. Typically, WiReL can
outperform traditional algorithms like logistic
regression or decision trees, achieving higher
accuracy rates by minimizing errors during training
and testing.
6.2 Confusion Matrix
False Positives (FP): This term refers to instances
where an individual is mistakenly identified as having
heart disease. In such cases, the actual class indicates
"no" (the patient does not have heart disease), while
the predicted class indicates "yes" (the patient is
forecasted to have heart disease). For example, if it
turns out that the patient did not survive, but the
prediction suggested otherwise, this would represent
a false positive.
False Negatives (FN): This situation occurs when
an individual who genuinely has heart disease is
inaccurately predicted to be healthy. Here, the actual
class is "yes" (the patient does have heart disease),
whereas the predicted class is "no" (the patient is
forecasted to be healthy). For instance, if the actual
outcome reveals that the patient survived, but the
prediction indicated that they would not, this
exemplifies a false negative. True Positives (TP): This
concept describes cases where an individual with
heart disease is accurately identified as such. These
are the accurately predicted positive outcomes, with
both the actual and predicted classes indicating "yes"
(the patient has heart disease).
True Negatives (TN): This term pertains to
situations where an individual who does not have
heart disease is correctly recognized as not having it.
These represent correctly predicted negative
outcomes, where both the actual and predicted classes
indicate "no" (the patient does not have heart disease).
For example, if the actual outcome shows that the
there is no survival rate for patient, and the prediction
affirms this finding, it illustrates a true negative.
𝑇𝑟𝑢𝑒𝑃𝑜𝑠𝑖𝑡𝑖𝑣𝑒𝑅𝑎𝑡𝑒
(
𝑇𝑃𝑅
)
=𝑇𝑃/
(
𝑇𝑃 + 𝐹𝑁
)
(3)
𝐹𝑎𝑙𝑠𝑒 𝑃𝑜𝑠𝑖𝑡𝑖𝑜𝑛 𝑟𝑎𝑡𝑒(𝐹𝑃𝑅) = 𝐹𝑃/(𝐹𝑃 + 𝑇𝑁) (4)
Accuracy: This statistic measures the fraction of total
predictions that are right, indicating how frequently
the model correctly detects accountable and non-
accountable. The computation of accuracy is as
follows:
𝐴𝑐𝑐𝑢𝑟𝑎𝑐𝑦 = (𝑇𝑃 + 𝑇𝑁)/(𝑇𝑃 + 𝑇𝑁 + 𝐹𝑃 + 𝐹𝑁) (5)
𝑃𝑟𝑒𝑐𝑖𝑠𝑖𝑜𝑛 = 𝑇𝑃/(𝑇𝑃 + 𝐹𝑃) (6)
While accuracy is a clear performance metric that
indicates the ratio of correctly predicted observations
to total observations, it is important to note that it
performs best when the dataset is balanced, which
implies that the false positive and false negative
values are equal.
Precision: This measure represents the proportion of
optimistic forecasts that are really correct. It
addresses the question: how many of the patients
identified as survivors actually did? An accuracy
score of 0.788 indicates a strong degree of precision,
with a decreased rate of false positives.
𝑅𝑒𝑐𝑎𝑙𝑙 = 𝑇𝑃/(𝑇𝑃 + 𝐹𝑁) (7)
Recall: This reflects the percentage of positive
observed values that are correctly anticipated. Recall
essentially identify genuine defaulters. Recall, also
known as sensitivity.
The F1 Score is a weighted average of
accuracy recall and recall classification is a
supervised learning technique used in machine
learning and statistics, where a computer program
examines input data and then uses what it has learned
to classify fresh observations.
General Formula:
𝐹− 𝑀𝑒𝑎𝑠𝑢𝑟𝑒=2𝑇𝑃/(2𝑇𝑃+𝐹𝑃+𝐹𝑁) (8)
𝐹1 − 𝑆𝑐𝑜𝑟𝑒 𝐹𝑜𝑟𝑚𝑢𝑙𝑎:
𝐹1 𝑆𝑐𝑜𝑟𝑒 = 2 ∗ (𝑅𝑒𝑐𝑎𝑙𝑙 ∗ 𝑃𝑟𝑒𝑐𝑖𝑠𝑖𝑜𝑛)/ (𝑅𝑒𝑐𝑎𝑙𝑙 +
𝑃𝑟𝑒𝑐𝑖𝑠𝑖𝑜𝑛) (9)
This dataset may have numerous categories may be
Weight Initialization-Based Rectified Linear Algorithm for Accurate Prediction of Chronic Heart Disease Compared with PCHF Feature
Engineering Technique
625

binary in nature, such as identifying if a person is
male or female or whether an email is considered
spam. Speech recognition, handwriting analysis,
biometric identification, and document classification
are a few prominent examples of classification jobs.
In the context of supervised learning, algorithms use
labeled data to gain knowledge. Once the algorithms
have a thorough grasp of the data, they can find
underlying patterns and correlations to give new,
unlabeled data the proper classifications.
7 CONCLUSIONS
The proposed endeavor started with data cleaning and
processing, then moved on to missing value analysis,
model development, and evaluation. Finally, the
research compares the WiReL algorithm with the
Principal Component Heart Failure (PCHF) Feature
Engineering Technique, and established that
prediction of heart disease using WiReL proved to be
more accurate than the PCHF approach. WiReL
focuses on optimal weight initialization and enhanced
learning mechanisms using rectified linear activation.
It generally achieves high accuracy due to its ability
to handle complex, non-linear patterns in data
effectively. It excels in datasets with sufficient size
and feature richness. PCHF leverages dimensionality
reduction through principal component analysis
(PCA), which simplifies the dataset by focusing on its
most important components. While it performs well
in reducing overfitting and computational
complexity, it might lose some detailed relationships
in the data, slightly impacting predictive accuracy.
WiReL often achieves higher accuracy compared to
PCHF, especially in larger and more complex
datasets.
8 FUTURE WORK
Focus on integrating WiReL and PCHF with
other machine learning or deep learning
techniques, such as ensemble methods, to
leverage the strengths of both algorithms for
improved accuracy and robustness. Develop a
real-time heart disease prediction system that
incorporates WiReL or PCHF into wearable
health devices or cloud-based platforms for
continuous monitoring and early warning.
REFERENCES
A. Saboor, M. Usman, S. Ali, A. Samad, M. F. Abrar, and
N. Ullah, “A method for improving prediction of
human heart disease using machine learning
algorithms,” Mobile Inf. Syst., vol. 2022, pp. 1–9, Mar.
2022.
A. M. Qadri, A. Raza, K. Munir, and M. S. Almutairi,
“Effective feature engineering technique for heart
disease prediction with machine learning,” IEEE
Access, May 30, 2023.
B. Smith, “An approach to graphs of linear forms
(Unpublished work style),” unpublished.
C. J. Kaufman, Rocky Mountain Research Lab., Boulder,
CO, private communication, May 1995.
C. A. U. Hassan, J. Iqbal, R. Irfan, S. Hussain, A. D.
Algarni, S. S. H. Bukhari, N. Alturki, and S. S. Ullah,
“Effectively predicting the presence of coronary heart
disease using machine learning classifiers,” Sensors,
vol. 22, no. 19, p. 7227, Sep. 2022.
D. K. Chohan and D. C. Dobhal, “A comparison-based
study of supervised machine learning algorithms for
prediction of heart disease,” in Proc. Int. Conf. Comput.
Intell. Sustain. Eng. Solutions (CISES), May 2022, pp.
372–375
E. H. Miller, “A note on reflector arrays (Periodical style—
Accepted for publication),” IEEE Trans. Antennas
Propagat., to be published.
G. O. Young, “Synthetic structure of industrial plastics
(Book style with paper title and editor),” Plastics, 2nd
ed. vol. 3, J. Peters, Ed. New York: McGraw-Hill, 1964,
pp. 15–64.
H. Poor, An Introduction to Signal Detection and
Estimation. New York: Springer-Verlag, 1985, ch. 4.
J. Magn.Jpn., vol. 2, Aug. 1987, pp. 740–741 [Dig. 9th
Annu. Conf. Magnetics Japan, 1982, p. 301].
J. Wang, “Fundamentals of erbium-doped fiber amplifiers
arrays (Periodical style—Submitted for publication),”
IEEE J. Quantum Electron., submitted for publication.
M. Young, The Techincal Writers Handbook. Mill Valley,
CA: University Science,1989.
P. Rani, R. Kumar, N. M. O. S. Ahmed, and A. Jain, “A
decision support system for heart disease prediction
based upon machine learning,” J. Reliable Intell.
Environments, vol. 7, no. 3, pp. 263–275, Sep. 2021.
S. Sarah, M. K. Gourisaria, S. Khare, and H. Das, “Heart
disease prediction using core machine learning
techniques A comparative study,” in Advances in Data
and Information Sciences. Springer, 2022, pp. 247–260.
W.-K. Chen, Linear Networks and Systems (Book style).
Belmont, CA: Wadsworth, 1993, pp. 123–135.
Y. Yorozu, M. Hirano, K. Oka, and Y. Tagawa, “Electron
spectroscopy studies on magneto-optical media and
plastic substrate interfaces (Translation Journals
style),” IEEE Transl.
ICRDICCT‘25 2025 - INTERNATIONAL CONFERENCE ON RESEARCH AND DEVELOPMENT IN INFORMATION,
COMMUNICATION, AND COMPUTING TECHNOLOGIES
626
