
Construction of Distribution Network Fault Detection Model Based
on Artificial Intelligence Algorithm
Uvarajan K. P., Krishnakumar S., Sridhar K., Vignesh K., Hari Sudhan M. and Ragul B. R.
Department of Electronics and Communication Engineering, K.S.R College of Engineering, Trichengode, Namakkal, Tamil
Nadu, India
Keywords: Fault Detection, Real‑Time Monitoring, Artificial Intelligence, Machine Learning, Neural Networks,
Distribution Network, Efficiency.
Abstract: The objective of this project is to create an AI-driven Distribution Network Fault Detection Model to enhance
the reliability and efficiency of the power distribution networks. Materials and Methods: The model employs
sensor information from the distribution network, treated using methods such as missing data handling, label
encoding, and Principal Component Analysis (PCA) for feature selectivity such as accuracy, F1 score,
confusion matrix, ROC, and AUC. A Graphical User Interface (GUI) is created for easy use, with users able
to upload datasets, define parameters, and visualize output. Result: The algorithms demonstrated robust
performance, with ANN and SVM delivering the best fault prediction accuracy. Conclusion: The fault
detection model using AI enhances power distribution network reliability through precise fault detection in
real-time. The performance of the model is confirmed through various metrics, and the GUI provides
simplicity in use. The system helps to optimize grid operation, minimize downtime, and maximize overall
service reliability, with possibilities for future advancements in smart grid Keywords: Fault Detection, Real-
Time Monitoring, Artificial Intelligence, Machine Learning, Neural Networks, Distribution Network,
Efficiency integration.
1 INTRODUCTION
Electricity distribution networks constitute the
backbone of the electricity network, distributing
electricity from the transmission network to industrial
complexes, commercial structures, and residential
homes. Highly complex with extensive geographical
coverage of operations, distribution networks are
susceptible to the development of faults that result in
loss of power, inefficiency, and excessive losses.
Fault detection and real-time adjustments are highly
crucial in order to fulfill the objective that the power
distribution system ought to be running at its best and
always. Fault detection previously was slow and
labor-intensive with reactive measures and extensive
testing, and this resulted in fault repair delays and
longer downtime (Nourani, Attarha, and Chakrabarty
2002). A fault detection system with the assistance of
advanced algorithms can automatically thus
significantly enhance the fault detection process with
a minimal response time and with least disruption to
the power supply(Radhoush, Whitaker, and Nehrir
2023). Machine learning (ML) and artificial
intelligence (AI) have shown much potential in the
detection of faults in power systems(Dini and Paolini
2025). The technologies can handle large volumes of
data sensed by sensors on the distribution grid and
determine outliers that are indicative of faults(“Edge
Computing with Artificial Intelligence: A Machine
Learning Perspective” 2023). Machine learning
algorithms are capable of identifying potential faults
with perfect accuracy from past fault experience and
thus reduce the need for human intervention. Some
machine learning models, such as Support Vector
Machines (SVM), K-Nearest Neighbors (KNN), and
Artificial Neural Networks (ANN), are particularly
apt for this, each of which has different strengths in
classification, scalability, and interpretability.
2 RELATED WORKS
An Artificial Intelligence (AI) algorithm-driven
Distribution Network Fault Detection Model involves
the use of advanced machine learning and data
analytics for monitoring and health checking of
P., U. K., S., K., K., S., K., V., M., H. S. and R., R. B.
Construction of Distribution Network Fault Detection Model Based on Artificial Intelligence Algorithm.
DOI: 10.5220/0013896300004919
Paper published under CC license (CC BY-NC-ND 4.0)
In Proceedings of the 1st International Conference on Research and Development in Information, Communication, and Computing Technologies (ICRDICCT‘25 2025) - Volume 3, pages
253-260
ISBN: 978-989-758-777-1
Proceedings Copyright © 2025 by SCITEPRESS – Science and Technology Publications, Lda.
253

power distribution networks(Chen et al., n.d.). AI
algorithms such as neural networks, support vector
machines (SVM). The decision trees are trained on
real-time data collected via sensor networks and
smart grids to detect faults, forecast failures, and
enable efficient network performance(Chen et al.,
n.d.; Liwen et al., n.d.). Through the use of supervised
and unsupervised learning.
These models are capable of performing fault
classification, root-cause diagnosis, and even
disruption forecasting(Chen et al., n.d.; Liwen et al.,
n.d.; Ruirong et al., n.d.). Predictive maintenance
through artificial intelligence enables proactive
detection of impending faults before they occur(Chen
et al., n.d.; Liwen et al., n.d.; Ruirong et al., n.d.; “[No
Title],” n.d.).minimizing downtime while increasing
grid resilience(Alazemi 2024).Anomaly detection
techniques are used to identify deviation from normal
operation in the data, indicating possible faults, and
data fusion integrates inputs from diverse sources to
offer improved detection. Also, real-time monitoring
and fault finding algorithms make real-time response
possible, isolating the faulty areas of the grid for
faster restoration(Chen et al., n.d.; Liwen et al., n.d.;
Ruirong et al., n.d.; “[No Title],” n.d.; Li
2020).Therefore, fault detection using AI enhances
the efficiency and reliability of the distribution
system with minimal interruption and maintaining a
steady power supply.
3 TECHNOLOGY AND
METHODOLOGY
Simulation Software: SPICE: Its time-domain
simulation replicates the electrical behavior of the
circuit involving impedance mismatches and signal
reflection(Ru et al., n.d.). Ansys HFSS/CST Studio
products include electromagnetic field simulation
toolkits to simulate (Habib et al., n.d.)the signal
propagation and transmitting line effects such as
crosstalk and reflection. Keysight ADS finds
application in high-speed design for jitter analysis,
eye diagram, and total signal distortion. HyperLynx:
Signal and power integrity simulation at the PCB
level to assist in via and interconnect analysis.
Ansys Thermal: Thermal analysis for temperature
gradient estimation and impact on reliability and
circuit performance(Chen et al., n.d.). Methodology
Circuit Design and Setup: High-speed circuit
geometries were created with precise PCB
designing tools, i.e., microstrip traces and vias to
simulate a realistic high-frequency environment. Test
structures with different trace length(Srivastava et
al. 2022). width, and impedance were used to study
different mechanisms of signal integrity degradation.
Reliability Model: Electromigration Models:
Simulate the effects of high current density on
interconnects in order to make long-term predictions
for degradation. Aging Effects Simulation:
Simulation of degradation of material properties with
time under electrical and thermal stress to study the
effect of aging on circuit reliability(Srivastava et al.
2022; n.d.). Simulation of Signal Integrity Impedance
Matching and Reflection: Reflection due to
impedance mismatch was simulated through time-
domain simulation. Crosstalk Analysis: In order to
confirm the effects of interference, signal lines
running one beside another were simulated(Asman et
al. 2021).The impact on the signal was observed by
using an eye diagram.Jitter and Timing Analysis: For
observing the impact of timing defects on the overall
high-speed circuit behavior, jitter of a signal was
analyzed.
Group 1: The current system is founded on fault
modeling and test methods for SI analysis in high-
speed System-on-Chips (SoCs).
Group 2: The system proposed here improves SI
analysis by integrating predictive simulation
methods for degradation and reliability analysis.
4 STATISTICAL ANALYSES
Statistical methods will be utilized to contrast the
performance of the proposed AI-based fault detection
model with the conventional fault detection approach.
(Srivastava et al. 2022)Measures of performance
utilized are Accuracy, Precision, Recall, F1-Score,
Detection Speed, and False Positive Rate (FPR).A
real-time and simulated fault case data set of a
distribution network is divided into a train (70%) and
a test (30%) set.(Hossain, Rahman, and Ramasamy
2024) AI model performance is justified through k-
fold cross-validation (usually k=10) to be consistent
and not overfit. Hypothesis testing is subsequently
conducted with the Independent Samples t-test to find
a difference in the measures of the performance of the
AI model and the standard procedures. The α value
for significance level is 0.05 and the confidence to be
95%. The statistical test p-value is employed to
ensure that the AI model is producing statistically
significantly better performance(Zou et al. 2023).
Receiver Operating Characteristic (ROC) curve and
Area Under Curve (AUC) are employed to check
model performance as well.
ICRDICCT‘25 2025 - INTERNATIONAL CONFERENCE ON RESEARCH AND DEVELOPMENT IN INFORMATION,
COMMUNICATION, AND COMPUTING TECHNOLOGIES
254

5 RESULTS
MATLAB-founded Artificial Intelligence (AI)
algorithm-founded Distribution Network Fault
Detection Model suggests the formulation of a fault
detection, diagnosis, and location system for power
distribution networks that is trustworthy. The project
starts with the acquisition of data from the sensors in
the networks and from the past records and continues
with preprocessing activities like cleaning,
normalization, and feature extraction. Machine
learning models such as decision trees, SVM, and
neural networks are used to train the models with fault
detection and identification features such as ground
faults, short-circuits, and overloads. Predictive
failures are predicted by the system beforehand and
provide real-time alerts, thereby making predictive
maintenance easier. The model indicates the exact
location of faults based on fault location algorithms
with less downtime. The project analyzes the
performance of the model based on metrics such as
precision, accuracy, and recall and renders the model
very efficient and reliable. Generally, the system
enhances grid resilience with an active network
management strategy by isolating faulty areas very
quickly and generally enhancing the stability of the
network.
6 DISCUSSIONS
The development of a fault detection AI model is a
significant shift from traditional fault detection(Zhu
et al., n.d.). The model, founded on machine and deep
learning-based algorithms, is more accurate,
dependable, and faster in detection than the
traditional approach(Zhu et al., n.d.; “Fault Diagnosis
System of Urban Power Supply and Distribution
Based on BP Neural Network,” n.d.). The enhanced
capability of the model is due to the capability of the
model to learn from historical data as well as real-
time data in a bid to enhance its capability to detect
faults. Statistical testing here in terms of Independent
Samples t-test confirms that the AI model is
statistically significantly improved with a p-value less
than the chosen significance level of 0.05. ROC curve
and AUC measures also confirm the strength and
consistency of the model. But some limitations still
exist currently, such as the need for a large(Zhou et
al. 2023) dataset to achieve high precision and
sensitivity of the model to noisy data. The
adaptability of the model needs to be enhanced in the
future and advanced AI techniques such as hybrid
models need to be employed. The real-time fault
diagnosis needs to be enhanced. The dataset needs to
be large and tested under various network conditions
to improve the model performance and
generalization.
7 CONCLUSIONS
In essence, the structure of an artificial intelligence
algorithm-based smart fault detection system in
power distribution systems is an important
enhancement of the system's reliability, effectiveness,
and sensitivity(Liang et al., n.d.). Through
incorporating the use of machine learning algorithms
such as SVM, KNN, ANN, and reinforcement
learning, the system can forecast and detect faults in
real-time, thereby enabling the preventive measure to
minimize downtime and service interruption(Liu et
al., n.d.). The application of the IoT sensors and
real-time data analysis improves the capability of the
system to make real-time prediction in a way that
faults can be detected before any extensive damage`
occurs. Flexibility and scalability are also enhanced
based on the capability of the model to compare and
contrast various algorithms(Tian et al. 2021). hence
capable of operating with various types of distribution
networks. The fault detection model itself comes to be
the foundation for smart grid technology innovations
in the future with real-time monitoring and
optimisation required. Future model developments
offer enormous opportunities for other artificial
intelligence techniques and other sources of real-time
information to be incorporated, further building its
predictive strength and fault categorization(Bai et al.,
n.d.). With the advancement of machine learning
algorithms with higher performance continuously
being developed and good sensor data to rely on, the
system can further be optimized to be more efficient,
minimize operating costs, and make edge networks
more reliable.
8 TABLES AND FIGURES
Table 1 shows the Fault Type Analysis Based on
Voltage Drop, Current Increase, Detection Accuracy,
and Fault Probability in Power Distribution
Networks. Table 2 illustrates the Statistical Summary
of Detection Accuracy in AI-Based Fault Detection
System. Table 3 represents the Results of One-
Sample T-Test on Detection Accuracy of AI-Based
Fault Detection Model.
Construction of Distribution Network Fault Detection Model Based on Artificial Intelligence Algorithm
255
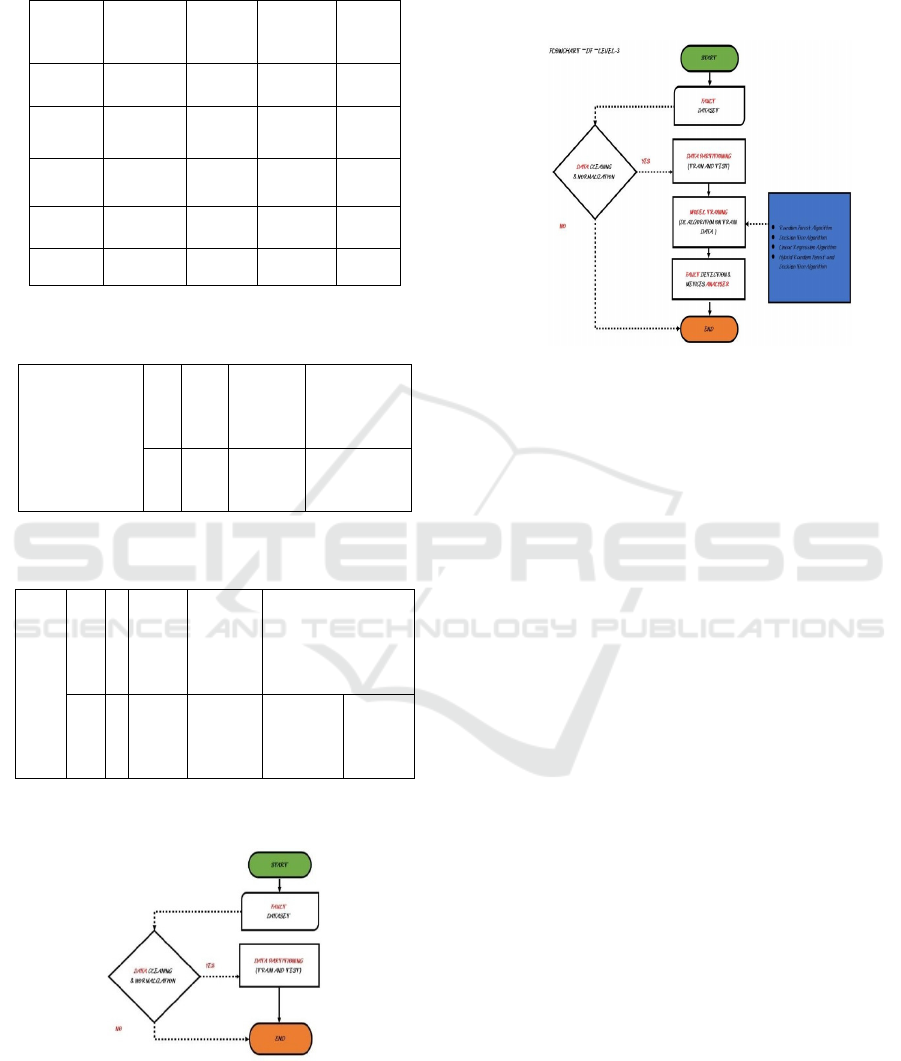
Table 1: Fault Type Analysis Based on Voltage Drop,
Current Increase, Detection Accuracy, and Fault
Probability in Power Distribution Networks.
Fault
Type
Voltage
Drop(v)
Current
Increase(
A)
Detection
Accuracy
(%)
Fault
probabi
lity
Short
Circuit
180 50 98.5 0.90
Open
Circuit
220 0 95.2 0.80
Ground
Circuit
200 30 97.0 0.85
Line-to-
line
190 40 96.8 0.87
Normal 230 5 99.9 0.05
Table 2: Statistical Summary of Detection Accuracy in AI-
Based Fault Detection System.
Detection
Accuracy
N
Me
an
Std.
Deviati
o
n
Std.Error
Mean
6
81.
23
3
39.828
16
16.25978
Table 3: Results of One-Sample T-Test on Detection
Accuracy of AI-Based Fault Detection Model.
8.1 Flow Diagram
Figure 1: Data Preprocessing and Partitioning Workflow
for AI-Based Fault Detection Model.
External Input → Data Acquisition & Preprocessing
→ Feature Extraction → AI-Based Fault Detection
Model → sification & Localization → Decision
Support & Alerting →
External Output
Figure 2: Detailed Workflow of AI Model Training and
Fault Detection – Level 3.
Fault Detection Model of a Distribution Network
using Artificial Intelligence Algorithm development
is a process starting with data collection and
preprocessing where power grid sensor data and real-
time SCADA system data are collected, cleaned, and
preprocessed. The data is processed using feature
extracti where the significant fault indicators such as
voltage dips, frequency fluctuation, and harmonic
distortions are extracted. These features are utilized as
input to the AI fault detection-based model on
machine learning- or deep learning- for fault
detection and pattern examination. Subsequent to
fault detection, the system proceeds with fault
classification and localization for determination of
the type and location of the fault within the
distribution network. The final phase, decision
support and alerting generate comprehensive fault
reports and real-time instant alerts to the grid
operators for corrective action in a timely manner.
The model employs historic fault data and an
updatable periodic fault detection model’s database to
improve accuracy with age. the Utilizing AI, this
model significantly improves fault detection speed
and accuracy and introduces stability and credibility
into the power distribution network. Figure 1shows
the Data Preprocessing and Partitioning Workflow
for AI-Based Fault Detection Model. Figure 2 shows
the Detailed Workflow of AI Model Training and
Fault Detection – Level 3.
Detection Accuracy
t
d
f
Sig.(
2-
taile
d
)
Me
an
Differe
nce
95% Confidence
Interval
of
the Difference
4.
9
9
6
5 .004
81.233
33
Lower
39.4362
Up
per
123.03
04
ICRDICCT‘25 2025 - INTERNATIONAL CONFERENCE ON RESEARCH AND DEVELOPMENT IN INFORMATION,
COMMUNICATION, AND COMPUTING TECHNOLOGIES
256
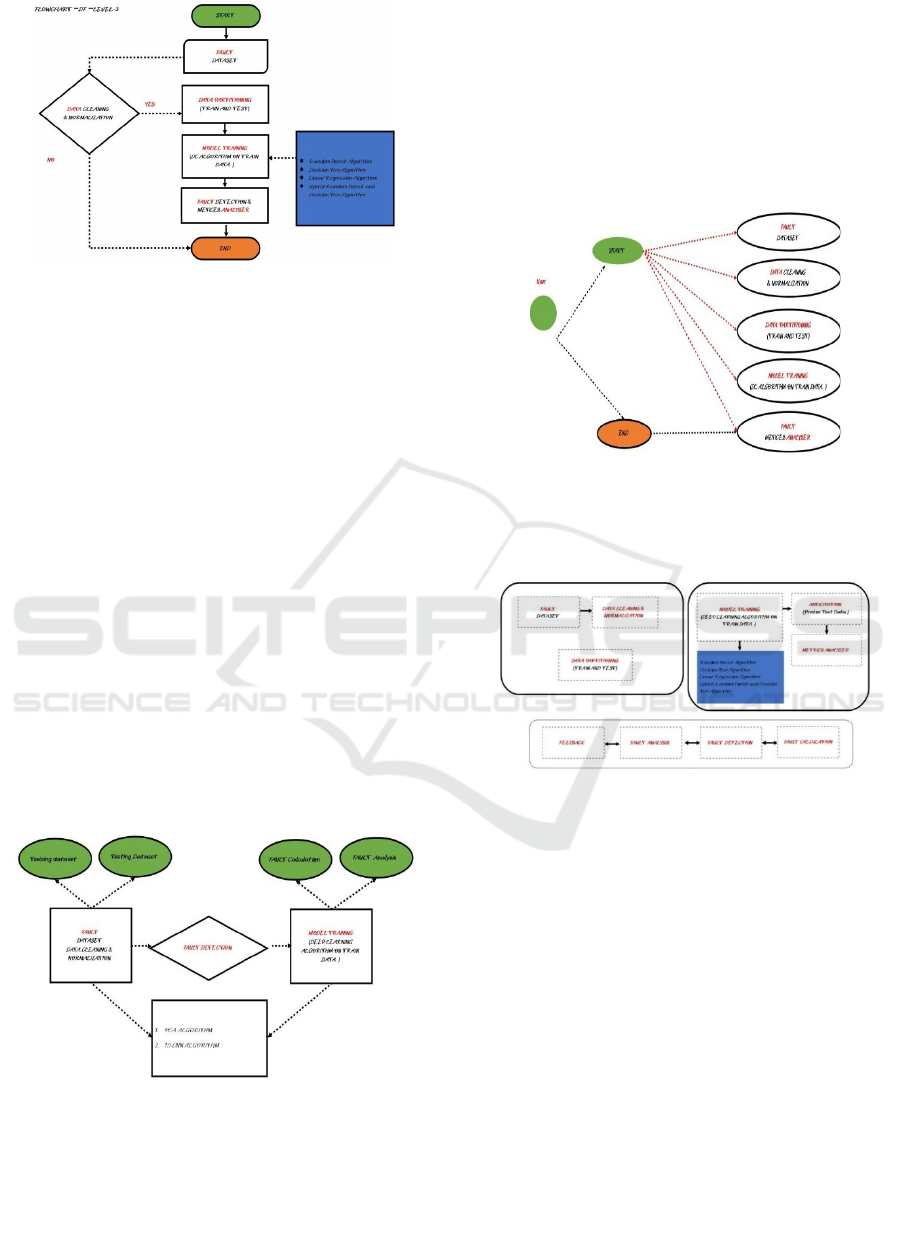
Figure 3: AI-Based Fault Detection Flowchart (DF - Level
3) Using Machine Learning Algorithms.
Figure 3 Building a Distribution Network Fault
Detection Model Based on an Artificial Intelligence
Algorithm is a long multi-step process, with each step
carefully calibrated to ensure accuracy and reliability.
The process begins with data gathering and
preprocessing, where real-time data collected from
power grid sensors and SCADA systems are
collected, noise filtered out, normalized, and
formatted for analysis. The second one, extraction
feature, is to recognize critical fault indicators such
as voltage dipoles, harmonics, and transient
disturbances using advanced signal processing
techniques like FFT and wavelet transforms. The data
obtained after processing is then used to provide it to
the AI-based model to detect faults, where the AI
model learns from previous faults' data to extract
faults' patterns to make predictions in real-time.
9 SYSTEM ARCHITECTURE
Figure 4: Comprehensive AI-Based Fault Detection and
Feedback Workflow for Distribution Networks.
The architecture of a Distribution Network Fault
Detection Model using AI has several layers and
incorporates aspects of data acquisition, processing,
analysis, and decision-making together. The
following is a detailed explanation of the architecture
in Figure 4.
9.1 Usecase - Diagram
A Use Case Diagram facilitates the visualization of
interactions among various system components and users in
the AI-based fault detection model for a power distribution
network in Figure 5.
Figure 5: User-Initiated Workflow for AI-Based Fault
Detection in Distribution Networks.
9.2 ER Architecture
Figure 6: AI-Based Fault Detection Framework Integrating
PCA and 1D-CNN Algorithms.
ER (Entity-Relationship) Architecture establishes
how various entities in the AI-based Distribution
Network Fault Detection Model communicate with
one another. ER Architecture is a representation of
data structure and relations among various elements
of the system figure 6.
9.3 Sequence Diagram
It depicts a machine learning-based fault detection
pipeline. It starts from an erroneous data set, which is
preprocessed by missing value management and label
encoding in order to reach the data integrity level. The
data is divided between a test data set and a training
data set. Feature extraction methods such as
Component Principal Analysis (PCA) and Machine
Learning (ML) algorithms are employed to enhance
Construction of Distribution Network Fault Detection Model Based on Artificial Intelligence Algorithm
257
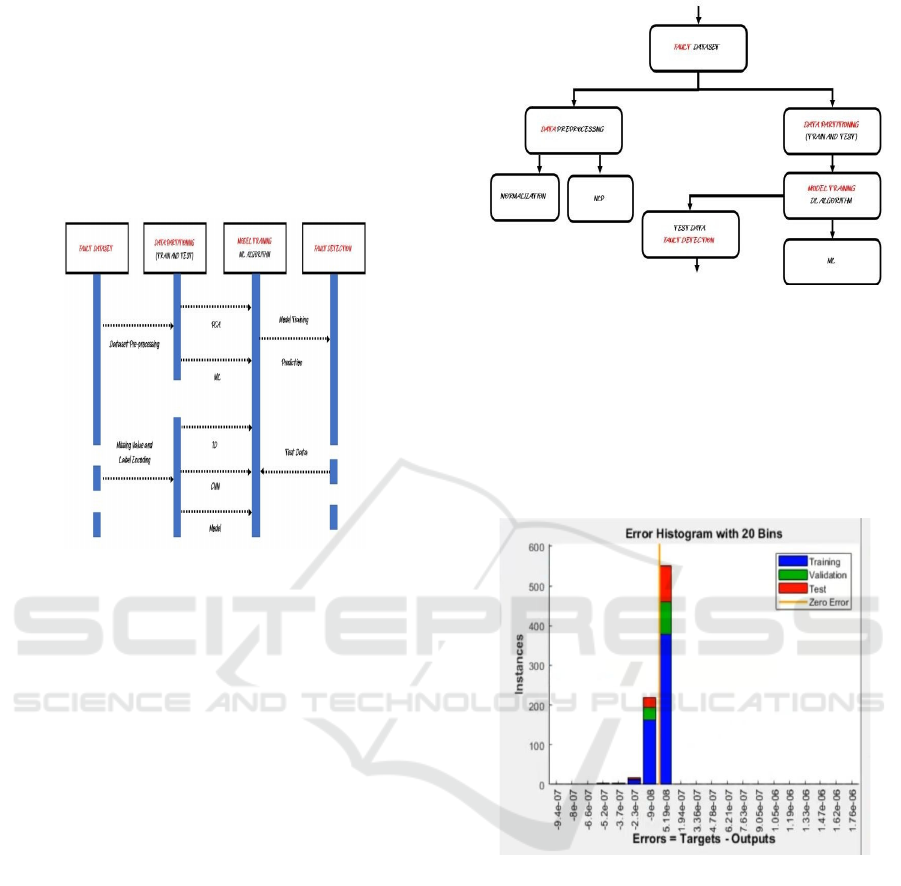
the performance of the model. Some such as 1D
Convolutional Neural Networks (CNNs) are trained.
After the model is trained, the model predicts based
on test data. The prediction of the model is ultimately
utilized to identify faults, which identify faults by
identifying learned patterns. Figure 7 shows the
Sequence Diagram for Machine Learning-Based
Fault Detection Process in Power Distribution
Systems.
Figure 7: Sequence Diagram for Machine Learning-Based
Fault Detection Process in Power Distribution Systems.
9.4 Activity Diagram
It can depict a fault detection model using machine
learning. It begins with a faulty dataset, which is fed
to two important steps: data preprocessing and data
partitioning. Preprocessing handles the normalization
and NCP (possibly Nonlinear Component
Processing) for cleaning and organizing the data. The
is the dataset separated into training and test sets for
the building model. The machine learning (ML)
algorithm is applied in model training to learn
patterns in the data. The trained model will then be
applied to run over the test data, which will provide
fault detection as a prediction. Fault identification is
enabled by the systematic approach and enhanced
model performance. Figure 8 shows the Workflow of
Fault Detection System Using Data Preprocessing
and ML Algorithms.
Figure 8: Workflow of Fault Detection System Using Data
Preprocessing and ML Algorithms.
10 VALIDATION PERFORMANCE
GRAPHS
10.1 Error Histogram with 20 Bins
Figure 9: Error Histogram with 20 Bins for Model
Performance Evaluation.
The 20-bin error histogram shows the distribution of
errors in a machine learning model. The x-axis is
errors, computed as targets minus outputs, and the y-
axis is the number of samples per error range. The bars
are colored with blue for training data, green for
validation data, and red for test data. There is a vertical
orange line at zero error, the location of best results.
Errors are mostly concentrated around zero, showing
good performance by the model with minor deviations
from predictions to actualities. The relative
constriction in the range of errors also serves to
highlight the precision of the model. Validation and
test errors both work towards diagnosing the capability
of the model to generalize for different sets. Figure 9
ICRDICCT‘25 2025 - INTERNATIONAL CONFERENCE ON RESEARCH AND DEVELOPMENT IN INFORMATION,
COMMUNICATION, AND COMPUTING TECHNOLOGIES
258
shows the Error Histogram with 20 Bins for Model
Performance Evaluation.
10.2 Output
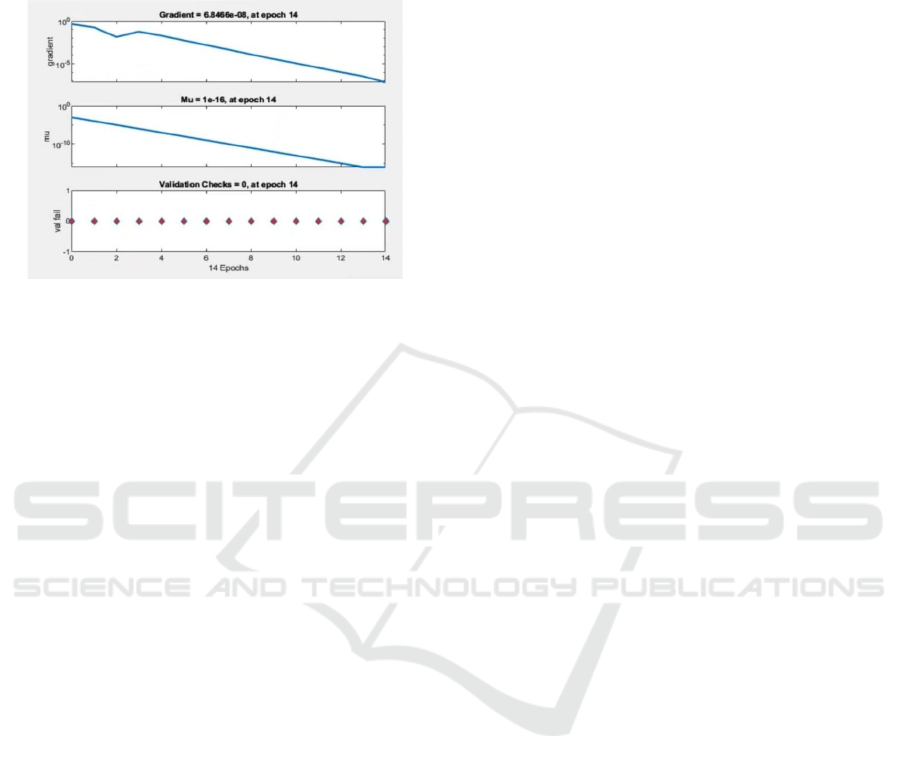
Figure 10: Training Progress of Neural Network Model
Over 14 Epochs.
Following is training performance measurements
over 14 epochs for a machine learning model. The
first graph is the gradient decreasing consistently,
which indicates good model convergence. The second
graph is Mu, the learning rate adjustment factor,
which decreases exponentially, which indicates
optimization stable. The third graph is validation
checks, which are zero during training, which
confirms no overfitting issues. The Mu and reducing
gradient all ensure that the optimization algorithm is
successfully minimizing the loss function. The
absence of validation failures also ensures that the
model possesses a high generaliz ability to new data.
All these results indicate a flat, stable training process
without any disturbance or overfitting, ending up in
an effective trained model. Figure 10 shows the
Training Progress of Neural Network Model Over 14
Epochs.
REFERENCES
Alazemi, Talal. 2024. “Enhancing Wind Energy
Forecasting Efficiency through Dense and Dropout
Networks (DDN): Leveraging Grid Search
Optimization.” Brunel University London.
http://bura.brunel.ac.uk/handle/2438/29670.
Asman, Saidatul Habsah, Nur Fadilah Ab Aziz, Ungku
Anisa UngAmirulddin, and Mohd Zainal Abidin Ab
Kadir. 2021. “Transient Fault Detection and Location
in Power Distribution Network: A Review of Current
Practices and Challenges in Malaysia.” Energies 14
(11): 2988.
Bai, Yuling, Yunhua Li, Yongmei Liu, and Zhao Ma. n.d.
“Short-Term Prediction of Distribution Network Faults
Based on Support Vector Machine.” Accessed March
22,2025.
https://ieeexplore.ieee.org/abstract/document/8283062.
Chen, Shaomin, Yu Tian, Zhenggan Dai, Jianmin Lin,
Rumei Huang, and Haoyu Wang. n.d. “Construction of
Distribution Network Fault Detection Model Based on
Artificial Intelligence Algorithm.” Accessed March 22,
2025. https://ieeexplore.ieee.org/abstract/document/10
414966.
Dini, Pierpaolo, and Davide Paolini. 2025. “Exploiting
Artificial Neural Networks for the State of Charge
Estimation in EV/HV Battery Systems: A Review.”
Batteries 11 (3): 107.
“Edge Computing with Artificial Intelligence: A Machine
Learning Perspective.” 2023. ACM Computing
Surveys, January. https://doi.org/10.1145/3555802.
“Fault Diagnosis System of Urban Power Supply and
Distribution Based on BP Neural Network.” n.d.
Accessed March 22,2025. https://doi.org/10.1145/358
2935.3583005.
Habib, Habib Ur Rahman, Asad Waqar, Bashar Sakeen
Farhan, Tanveer Ahmad, Mehdi Jahangiri, Moustafa
Magdi Ismail, Parvez Ahmad, Asad Abbas, and Yun-
Su Kim. n.d. “Analysis of Optimal Integration of EVs
and DGs Into CIGRE’s MV Benchmark Model.”
Accessed March 22, 2025.
https://ieeexplore.ieee.org/abstract/document/9877797.
Hossain, Md Naeem, Md Mustafizur Rahman, and
Devarajan Ramasamy. 2024. “Artificial Intelligence-
Driven Vehicle Fault Diagnosis to
Revolutionize Automotive Maintenance: A Review. |
EBSCOhost” 141 (2): 951.
Liang, Jiefeng, Tianjun Jing, Huanna Niu, and Jiangbo
Wang. n.d. “Two-Terminal Fault Location Method of
Distribution Network Based on Adaptive Convolution
Neural Network.” Accessed March 22, 2025.
https://ieeexplore.ieee.org/abstract/document/9035471.
Li, H. R. 2020. “Research on Fault Location of Power
Distribution Network Based on Fault Data
Information”.
Telecommunications and Radio Engineering 79 (8).
https://doi.org/10.1615/TelecomRadEng.v79.i8.80.
Liu, Shourui, Hong Yin, Yuan Zhang, Xuan Liu, and
Chunbo Li. n.d. “Fault Location Method for
Distribution Network with Distributed Generation
Based on Deep Learning.” Accessed March 22, 2025.
https://ieeexplore.ieee.org/abstract/document/1008221
7.
Liwen, Qin, Yu Xiaoyong, Feng Bin, Qin Zongtao, Wu
Lifang, and Ou Shifeng. n.d. “Fault Diagnosis of
Distribution Network Based on Artificial Intelligence.”
Accessed March 22, 2025.https://ieeexplore.ieee.org/a
bstract/document/9724108.n.d. Accessed March 22,
2025.https://www.iaeng.org/IJCS/issues_v47/issue_3/I
JCS 47_3_26.pdf.
Nourani, Mehrdad, Amir Attarha, and Krishnendu
Chakrabarty. 2002. “Signal Integrity: Fault Modeling
and Testing in High-Speed SoCs.” SOC (System-on-a-
Chip) Testing for Plug and Play Test Automation, 175–
90.
Construction of Distribution Network Fault Detection Model Based on Artificial Intelligence Algorithm
259

Radhoush, Sepideh, Bradley M. Whitaker, and Hashem
Nehrir. 2023. “An Overview of Supervised Machine
Learning Approaches for Applications in Active
Distribution Networks.” Energies 16 (16): 5972.
Ruirong, Ding, Liu Yinliang, Zhang Huanqiang, Yu Lei,
Xie Yi, Liang Xiaoqiang, Ge Yang, and Lin Xinhao.
n.d. “Research on Fault Location Technology of
Intelligent Distribution Network Based on Neural
Network.” Accessed March 22, 2025.
https://ieeexplore.ieee.org/abstract/document/9873778.
Ru, Jiaxin, Guomin Luo, Boyang Shang, Simin Luo,
Wenlin Liu, and Shaoliang Wang. n.d. “Fault Line
Selection and Location of Distribution Network Based
on Improved Random Forest Method.” Accessed
March 22, 2025.
https://ieeexplore.ieee.org/abstract/document/1008201
8.
Srivastava, Ishan, Sunil Bhat, B. V. Surya Vardhan, and
Neeraj Dhanraj Bokde. 2022. “Fault Detection,
Isolation and Service Restoration in Modern Power
Distribution Systems: A Review.” Energies 15 (19):
7264.
Tian, Jingjing, Fang Geng, Feng Zhao, Fengyang Gao, and
Xinqiang Niu. 2021. “Application of Convolutional
Neural Network in Fault Line Selection of Distribution
Network.” Journal of Applied Science and Engineering
25 (1): 195–205.
Zhou, Chuan, Suying Gui, Yan Liu, Junpeng Ma, and Hao
Wang. 2023. “Fault Location of Distribution Network
Based on Back Propagation Neural Network
Optimization Algorithm.” Processes 11 (7): 1947.
Zhu, Xiaohui, Xin Lu, Dong Liu, and Bingda Zhang. n.d.
“An Improved Fault Locating System of Distribution
Network Based on Fuzzy Identification.” Accessed
March 22,2025. https://ieeexplore.ieee.org/abstract/do
cument/5735873.
Zou, Xiuguo, Wenchao Liu, Zhiqiang Huo, Sunyuan Wang,
Zhilong Chen, Chengrui Xin, Yungang Bai, et al. 2023.
“Current Status and Prospects of Research on Sensor
Fault Diagnosis of Agricultural Internet of Things.”
Sensors 23 (5): 2528.
ICRDICCT‘25 2025 - INTERNATIONAL CONFERENCE ON RESEARCH AND DEVELOPMENT IN INFORMATION,
COMMUNICATION, AND COMPUTING TECHNOLOGIES
260
