
Application of MPPT Techniques Using Intelligent and Conventional
Control Strategies
Jo
˜
ao T. Sousa
1 a
and Ramiro S. Barbosa
1,2 b
1
Department of Electrical Engineering, Institute of Engineering – Polytechnic of Porto (ISEP/IPP), 4249-015 Porto,
Portugal
2
GECAD - Research Group on Intelligent Engineering and Computing for Advanced Innovation and Development,
ISEP/IPP, 4249-015 Porto, Portugal
Keywords:
MPPT, Photovoltaic Systems, Fuzzy Logic Controller, Genetic Algorithm, P&O, Incremental Conductance,
Solar Energy.
Abstract:
This paper presents a comparative study of five MPPT (Maximum Power Point Tracking) algorithms applied
to photovoltaic (PV) systems under both uniform and dynamic environmental conditions. The analyzed algo-
rithms include two conventional methods, Perturb & Observe (P&O) and Incremental Conductance (InC), as
well as a fuzzy logic controller (FLC) and two hybrid strategies enhanced by genetic algorithms (P&O+GA
and InC+GA). A unified simulation framework in MATLAB/Simulink was used to ensure fair benchmarking,
employing identical panel configurations, irradiance/temperature profiles, and converter parameters. Each al-
gorithm was tested using predefined parameters such as step size, initial duty cycle, and operating bounds.
Additionally, an EMA (Exponential Moving Average) filter was applied to the hybrid algorithms to reduce
high-frequency measurement noise. Evaluation metrics include Mean Absolute Error (MAE), Integral Ab-
solute Error (IAE), Mean Squared Error (MSE), Integral Squared Error (ISE), convergence time, and energy
conversion efficiency. Results demonstrate that hybrid methods deliver superior performance in noisy and
fast-changing conditions, while FLC maintains stable performance with reduced oscillations. This work aims
to support the selection of suitable MPPT techniques for real-world PV systems, balancing computational
complexity and control effectiveness.
1 INTRODUCTION
Given the increasing global emphasis on sustainable
and renewable energy solutions, photovoltaic (PV)
energy plays a crucial role in the transition towards
a low-carbon future. The urgency of the climate
crisis, coupled with the depletion of fossil fuel re-
serves, has accelerated the deployment of solar tech-
nologies across diverse applications—from residen-
tial rooftops to large-scale utility plants. PV systems
are particularly valued for their scalability, modular-
ity, and ability to provide clean energy with minimal
environmental impact.
The overall efficiency of a PV system is closely
tied to its capability to continuously operate at the
MPP (Maximum Power Point), which varies with en-
vironmental conditions such as solar irradiance, tem-
perature, and partial shading. These factors introduce
a
https://orcid.org/0009-0000-6775-5844
b
https://orcid.org/0000-0001-7410-8872
non-linearities in the power-voltage (P–V) curve, of-
ten resulting in multiple local maximum. Under
such conditions, reliably identifying and tracking the
GMPP (Global Maximum Power Point) becomes a
complex control problem. This challenge has made
MPPT (Maximum Power Point Tracking) algorithms
an indispensable component of modern PV systems.
Historically, classical MPPT methods such as Per-
turb & Observe (P&O) and Incremental Conductance
(InC) have been favored for their simplicity and low
cost. Nonetheless, they exhibit limited adaptabil-
ity, oscillations around the MPP (Maximum Power
Point), and suboptimal performance under dynamic
or mismatched conditions. Advanced strategies in-
cluding Fuzzy Logic Controllers (FLC) and hybrid
approaches integrating classical methods with Ge-
netic Algorithms (GA) have been developed to en-
hance convergence, minimize steady-state oscilla-
tions, and improve robustness under partial shading.
This study comparatively evaluates five MPPT algo-
154
Sousa, J. T. and Barbosa, R. S.
Application of MPPT Techniques Using Intelligent and Conventional Control Strategies.
DOI: 10.5220/0013894100003982
Paper published under CC license (CC BY-NC-ND 4.0)
In Proceedings of the 22nd International Conference on Informatics in Control, Automation and Robotics (ICINCO 2025) - Volume 1, pages 154-165
ISBN: 978-989-758-770-2; ISSN: 2184-2809
Proceedings Copyright © 2025 by SCITEPRESS – Science and Technology Publications, Lda.

rithms P&O, InC, FLC, P&O+GA, and InC+GA, ad-
dressing the need for broader and more rigorous as-
sessments as most prior works consider only a few
methods under idealized conditions.
To overcome these limitations, this work delivers
a thorough comparative evaluation of five widely used
MPPT techniques, tested under both uniform and par-
tial shading conditions within a unified and modu-
lar MATLAB/Simulink environment. A key strength
of this study lies in the adoption of diverse perfor-
mance indicators, including MAE, IAE, MSE, ISE,
efficiency, and convergence time. In addition, every
test condition is carefully specified in terms of irra-
diance and temperature, ensuring full reproducibility
and transparency in the experimental methodology.
To enable a rigorous and fair comparison, a unified
benchmarking strategy was adopted. All algorithms
were implemented under identical simulation condi-
tions, including converter parameters, sampling rate,
and environmental inputs. The key configuration pa-
rameters defined for each algorithm, include the ini-
tial duty cycle, perturbation step size, input variables,
and control structure.
The remainder of this article is structured as fol-
lows. Section 2 presents a review of the literature.
Section 3 details the modeling of the photovoltaic
system and simulation environment. Section 4 de-
scribes the buck converter topology and control strat-
egy. Section 5 provides an overview of the im-
plemented MPPT algorithms, encompassing conven-
tional, fuzzy, and hybrid techniques. Section 6 defines
the test cases, including both uniform irradiance and
partial shading conditions. Section 7 introduces the
performance evaluation metrics. Section 8 presents
the simulation results and comparative analysis. Sec-
tion 9 discusses the main findings and implications.
Finally, Section 10 concludes the work and outlines
possible directions for future research.
2 RELATED WORK
Recent studies have focused on improving MPPT be-
yond classical methods. Remoaldo and Jesus (2021)
showed that integrating fuzzy logic with P&O accel-
erates convergence under rapid irradiance changes.
Katche et al. (2023) highlighted the limitations of
conventional algorithms in partial shading conditions
(PSC), where multiple local maxima hinder tracking.
Aligned with this perspective, soft computing and
evolutionary algorithms have gained prominence in
MPPT control. According to Rezk et al. (2017),
FLC (Al-Majidi et al., 2018) and adaptive neuro-
fuzzy inference systems (ANFIS) (Belhachat and
Larbes, 2017; Mumtaz et al., 2018) effectively ad-
dress the nonlinear, time-varying behavior of PV ar-
rays. Meanwhile, bio-inspired algorithms—including
GA (Shaiek et al., 2013), cuckoo search (CS) (Ahmed
and Salam, 2014), ant colony optimization (ACO)
(Titri et al., 2017), bee colony algorithm (BCA)
(Benyoucef et al., 2015), bat-inspired optimization
(BAT) (Kaced et al., 2017), and memetic salp swarm
algorithm (Yang et al., 2019)—enhance GMPP detec-
tion by avoiding local optima, a key advantage under
PSC and fluctuating irradiance.
Classical MPPT methods like P&O and InC are
widely used for their simplicity (Lapsongphon and
Nualyai, 2021; Sharma et al., 2023), but intelligent
strategies such as FLC (Al-Majidi et al., 2018) im-
prove stability. More recently, hybrid schemes with
metaheuristics, especially GA (Shaiek et al., 2013;
Rezk et al., 2017), have been proposed to enhance
convergence under partial shading.
3 PHOTOVOLTAIC SYSTEM
DESCRIPTION
The PV system models were developed in MAT-
LAB/Simulink to evaluate the performance of MPPT
algorithms under realistic and non-uniform condi-
tions. Two configurations were implemented: (i) a
panel with a single bypass diode, representing the ac-
tual SOLARPOWER XUNZEL 30W 24V module;
and (ii) an extended model consisting of three cell
groups connected in series, each with an independent
bypass diode, enabling simulation of PSC.
Figure 1 illustrates the complete Simulink model
used for both configurations.
The electrical characteristics of the PV panel were
obtained from the manufacturer’s datasheet and are
listed in Table 1. These parameters were used to gen-
erate the I-V and P-V curves shown in Figure 2, with
the MPP highlighted in red.
Table 1: Electrical specifications of the SOLARPOWER
XUNZEL 30W 24V PV module.
Parameter Value
Max. power (P
max
) 29.88 W
No. of cells (N
cell
) 72
Open-circuit voltage (V
oc
) 43.20 V
Short-circuit current (I
sc
) 0.92 A
Voltage at MPP (V
mpp
) 36.00 V
Current at MPP (I
mpp
) 0.83 A
Temp. coef. of V
oc
(β
Voc
) −0.27 %/°C
Temp. coef. of I
sc
(α
Isc
) +0.05 %/°C
Temp. coef. of power (α
Psc
) −0.35 %/°C
Application of MPPT Techniques Using Intelligent and Conventional Control Strategies
155

Figure 1: Simulink model of the PV system, supporting both single-diode and PSC configurations.
Figure 2: I-V and P-V curves of the SOLARPOWER 30W
24V panel, indicating the MPP.
4 DC/DC BUCK CONVERTER
DESIGN
The DC/DC buck converter was carefully designed to
interface with the PV module while ensuring opera-
tion at the MPP. The design is based on standard ana-
lytical equations, and the model was implemented in
Simulink for evaluation. The electrical parameters of
the PV system, summarized in Table 2, were calcu-
lated using the following equations:
P
in
= V
mpp
× I
mpp
(1)
P
out
= η ×P
in
(2)
I
out
=
P
out
V
out
(3)
R
o
=
V
2
out
P
out
(4)
Table 2: Calculated buck converter parameters.
Parameter Value
Input voltage (V
in
) 36 V
Output voltage (V
out
) 20 V
Input power (P
in
) 29.88 W
Output power (P
out
) 26.89 W
Efficiency (η) 90%
MPP current (I
mpp
) 0.83 A
Output current (I
out
) 1.34 A
Load resistance (R
o
) 14.88 Ω
The buck converter topology is depicted in Fig-
ure 3. It consists of a controlled switch (S), a diode
(D), an inductor (L), and an output capacitor (C), de-
livering a regulated voltage to the load (R). The input
voltage from the PV module is stepped down to the
desired output level (V
out
= 20 V) while maintaining
the MPP operation.
ICINCO 2025 - 22nd International Conference on Informatics in Control, Automation and Robotics
156

−
+
v
in
D
L
C R
v
o
+
-
I
L
I
o
I
D
I
C
S
D
1
Figure 3: Topology of the DC/DC buck converter.
To ensure CCM (Continuous Conduction Mode)
and maintain low ripple, the converter key parame-
ters were derived using the following equations (Kaz-
imierczuk and Ayachit, 2016) (Texas Instruments,
2011):
D =
V
out
V
in
(5)
L
o
≥
(V
in
−V
out
) · D
f
s
· ∆I
(6)
C
o
≥
∆I
8 · f
s
· ∆V
(7)
Table 3 presents the final component values used
in simulation.
5 MPPT ALGORITHMS
OVERVIEW
This section outlines the five MPPT algorithms con-
sidered in this study, comprising two classical ap-
proaches (Perturb & Observe and Incremental Con-
ductance), one intelligent method based on Fuzzy
Logic (FL), and two hybrid strategies enhanced with
GA.
From a control perspective, the MPPT problem
can be formalized as a regulation task where the ma-
nipulated variable is the duty cycle of the DC/DC
converter, the controlled variable is the extracted PV
power, and the disturbances are primarily irradiance
and temperature variations. The objective is to contin-
uously adjust the duty cycle to maintain operation at
or near the MPP despite environmental changes. This
viewpoint highlights MPPT as a nonlinear and time-
varying control problem, where both steady-state ac-
curacy and dynamic adaptability are crucial.
5.1 Perturb & Observe (P&O)
The Perturb & Observe (P&O) algorithm is one of the
most widely adopted MPPT methods due to its sim-
plicity and ease of implementation. This method in-
troduces a small perturbation in the reference variable
Start
Measure V(k), I(k)
Calculate power
P(k) = V (k) · I(k )
P(k) = P(k − 1)
P(k) > P(k − 1)
V (k) > V (k −1) V (k) > V (k −1)
Increase
Duty Cycle
Decrease
Duty Cycle
Decrease
Duty Cycle
Increase
Duty Cycle
Return
No
YesNo
YesNo No Yes
Yes
Figure 4: Flowchart of the P&O MPPT algorithm (adapted
from (Lapsongphon and Nualyai, 2021)).
(typically voltage or current) and analyzes the result-
ing variation in output power.
The output power is computed as P(k) = V (k) ·
I(k) and compared with the previous sample. If ∆P =
P(k) − P(k − 1) > 0, the duty cycle is adjusted in the
same direction; otherwise, it is reversed. This iterative
process drives the system toward the MPP (Figure 4).
In this implementation, a fixed perturbation step
size of ∆ = 1.25 × 10
−4
is used, representing the in-
cremental change applied to the converter’s duty cycle
in each iteration. The initial duty cycle is set to D
init
=
0.5555, calculated based on the target output voltage
(20 V) and the PV module’s MPP voltage (36 V), us-
ing the ideal duty cycle relation D = V
out
/V
in
.
Previous voltage and power values (V
old
,P
old
) are
stored to evaluate the trend of the power response. Al-
though this method performs well under steady-state
conditions, it may suffer from oscillations around the
MPP and limited responsiveness under rapidly chang-
ing irradiance or temperature, due to its fixed and non-
adaptive step size.
5.2 Incremental Conductance (InC)
The Incremental Conductance (InC) algorithm im-
proves MPPT accuracy by analyzing the instanta-
neous slope of the P-V curve. Starting from the power
expression P = V ·I, its derivative with respect to volt-
age is given by:
dP
dV
=
d(V I)
dV
= I +V ·
dI
dV
(8)
At the MPP, the derivative is zero, leading to the
Application of MPPT Techniques Using Intelligent and Conventional Control Strategies
157

Table 3: Buck converter parameters used in simulations.
Component Value Purpose
Duty cycle (D) 0.5555 Voltage conversion ratio
Inductor (L
o
) 1658.71 µH Ensures CCM for ∆I = 0.268 A
Capacitor (C
o
) 1675 µF Achieves ∆V = 1 mV voltage ripple
Switching frequency ( f
s
) 20 kHz Trade-off between switching losses and transient response
Current ripple (∆I) 0.268 A 20% of I
out
to stabilize MPPT control
Voltage ripple (∆V ) 1 mV 0.005% of V
out
to ensure voltage precision
condition:
dP
dV
= 0 ⇒
dI
dV
= −
I
V
(9)
This relation serves as the core criterion for identi-
fying the MPP. If the condition
dI
dV
+
I
V
= 0 is satisfied,
the system is considered to be operating at the MPP.
Otherwise, the sign and magnitude of the expression
determine whether the operating point lies to the left
or right of the MPP.
In practical implementations, the derivatives are
approximated using discrete differences as ∆I/∆V .
The algorithm then evaluates whether this approxi-
mation satisfies the MPP condition within a tolerance,
i.e.,
∆I
∆V
+
I
V
< ε (10)
with a typical stopping threshold ε = 10
−6
. If satis-
fied, the duty cycle remains unchanged; otherwise, it
is adjusted accordingly. This logic is illustrated in the
flowchart shown in Figure 5.
Start
Measure V(k), I(k)
Calculate ∆V, ∆I
∆V = V (k) −V (k−1)
∆I = I(k) − I(k−1)
∆V = 0
∆I
∆V
= −
I(k)
V (k)
∆I
∆V
> −
I(k)
V (k)
∆I = 0
∆I > 0
Decrease
Duty Ratio
Increase
Duty Ratio
Decrease
Duty Ratio
Increase
Duty Ratio
Return
YesNo
No No
YesNo No Yes
Yes Yes
Figure 5: Flowchart of the InC MPPT algorithm (adapted
from (Lapsongphon and Nualyai, 2021)).
As with P&O, this algorithm uses a fixed perturba-
tion step size of ∆ = 1.25 × 10
−4
, an initial duty cycle
D
init
= 0.5555, and predefined duty bounds. How-
ever, it requires storage of previous current and volt-
age measurements to compute ∆I and ∆V .
Although more complex than P&O, the InC
method reduces steady-state oscillations and exhibits
better tracking performance under rapidly changing
environmental conditions.
5.3 Fuzzy Logic Controller (FLC)
The Fuzzy Logic Controller (FLC) introduces an
intelligent rule-based mechanism that emulates hu-
man decision-making in non-linear and dynamic sys-
tems. The FLC developed in this study follows the
Mamdani inference model and comprises three main
stages: fuzzification, rule-based inference, and de-
fuzzification.
5.3.1 Fuzzification
Two normalized inputs are considered: the power
slope error (E) and its derivative (dE), calculated as:
E =
P(k) − P(k − 1)
V (k) −V (k − 1)
, dE = E(k) −E(k − 1) (11)
These quantities are normalized to the [−1,1]
range using saturation functions:
E
norm
= sat
E
0.5
, dE
norm
= sat
dE
0.2
(12)
Triangular membership functions are employed
for both inputs, dividing the universe of discourse into
five linguistic labels (Figure 6): Negative Large (NL),
Negative Small (NS), Zero (Z), Positive Small (PS),
and Positive Large (PL). These functions are defined
by:
µ(x,a, b,c) = max
min
x − a
b − a
,
c − x
c − b
,0
(13)
ICINCO 2025 - 22nd International Conference on Informatics in Control, Automation and Robotics
158
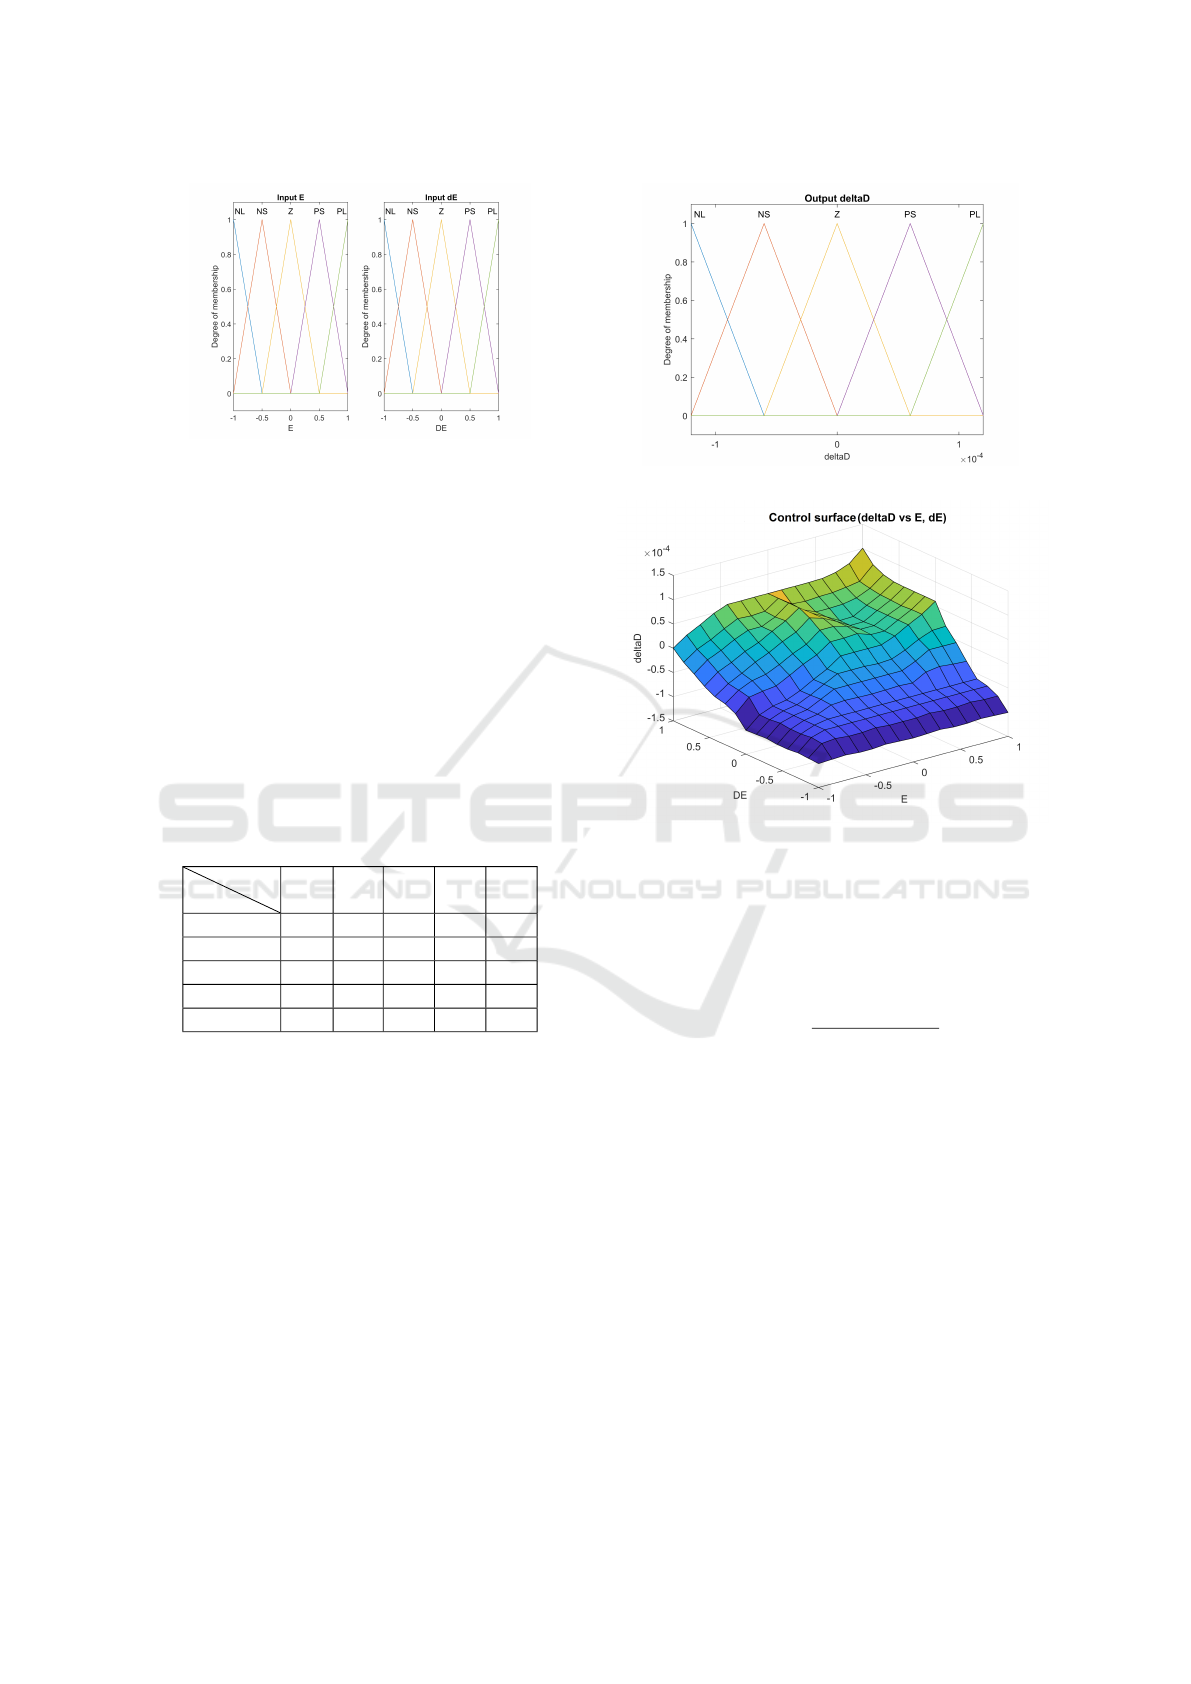
Figure 6: Triangular membership functions for the input
variables: error (E) and derivative of the error (dE).
Listing 1: Mamdani implication operator in code.
w = min (muE( i ) , muDE( j ) ) ;
5.3.2 Inference Mechanism
The fuzzy rule base is built on a 5 × 5 grid, map-
ping the combinations of E and dE to the variation
in duty cycle ∆D. The Mamdani inference method is
applied, using the min operator to determine the acti-
vation weight of each rule:
Table 4 shows the complete rule base used to de-
fine the control actions.
Table 4: Fuzzy rule base for ∆D (duty cycle variation) using
linguistic variables.
E
dE
NL NS Z PS PL
NL PL PL PS PS Z
NS PL PS PS Z NS
Z PS Z Z Z NS
PS Z NS NS NS NL
PL NS NS NL NL NL
Examples of rule definitions include:
• IF E is NL AND dE is NL THEN ∆D is PL
• IF E is Z AND dE is Z THEN ∆D is Z
• IF E is PL AND dE is PL THEN ∆D is NL
This configuration ensures that strong deviations
from the MPP lead to larger duty cycle adjustments,
whereas near-optimal conditions result in smaller or
null changes, promoting stability.
The rule base values ∆D
i j
and the associated
weights w
i j
determine the fuzzy output surface, which
is visualized in Figure 7.
5.3.3 Defuzzification
The defuzzification stage employs the Center of Grav-
ity (COG) method, which computes the crisp output
(a) Output membership functions
(b) Control surface
Figure 7: (a) Output fuzzy sets for ∆D and (b) resulting
fuzzy control surface.
as the weighted average of all rule consequences:
∆D
output
=
5
∑
i=1
5
∑
j=1
w
i j
· ∆D
i j
5
∑
i=1
5
∑
j=1
w
i j
(14)
where:
• w
i j
= min (µ
E
(i),µ
˙
E
( j)) is the rule activation
weight;
• ∆D
i j
is the output action for rule (i, j) based on
the fuzzy rule base.
The FLC provides effective tracking of the MPP
under varying irradiance and temperature, with lower
oscillations compared to conventional methods, albeit
with slightly increased computational complexity due
to rule evaluation and inference mechanisms.
Application of MPPT Techniques Using Intelligent and Conventional Control Strategies
159
5.4 Hybrid Algorithms (InC+GA and
P&O+GA)
Hybrid approaches integrate classical MPPT tech-
niques (P&O and InC) with Genetic Algorithms (GA)
to overcome the limitations of fixed step size and im-
prove adaptability under complex environmental sce-
narios.
In both hybrids, the GA dynamically optimizes the
perturbation step size ∆ within a bounded range of
[0.00005,0.0002], aiming to maximize output power
while minimizing high-frequency oscillations. The
fitness function is defined as:
Fitness = V
pv
· I
pv
− 5 · ∆ (15)
where the penalty term ensures that smaller step sizes
are favored if they maintain high power output.
The configuration of the GA used for step-size op-
timization in both hybrid methods is summarized in
Table 5.
Table 5: Genetic Algorithm parameters used in hybrid
MPPT approaches.
Parameter Value
Population size 50 individuals
Number of generations 5
Selection method Tournament (size = 3)
Crossover type Random factor α
Mutation rate 30%
An exponential moving average (EMA) filter is
applied to voltage and current measurements to sup-
press measurement noise (Martins et al., 2019)(Tajiri
and Kumano, 2012):
x
f
(k) = α · x(k) + (1 − α) · x
f
(k − 1) (16)
where x represents the measured signals V
pv
and
I
pv
, and α = 0.01 is the smoothing coefficient.
The hybrid P&O+GA algorithm retains the stan-
dard perturbation logic but applies the optimized ∆
opt
from GA at each cycle, as illustrated in the flowchart
in Figure 8. Similarly, InC+GA applies the incremen-
tal conductance logic, using the GA-tuned step size.
These hybrid methods significantly enhance track-
ing performance, particularly under PSC, achieving
high efficiency with minimal error metrics.
5.5 Benchmarking Configuration
To ensure a rigorous and equitable assessment of all
MPPT algorithms presented in this work, a unified
benchmarking methodology was employed. Each al-
gorithm was implemented within the same simulation
environment, leveraging identical photovoltaic and
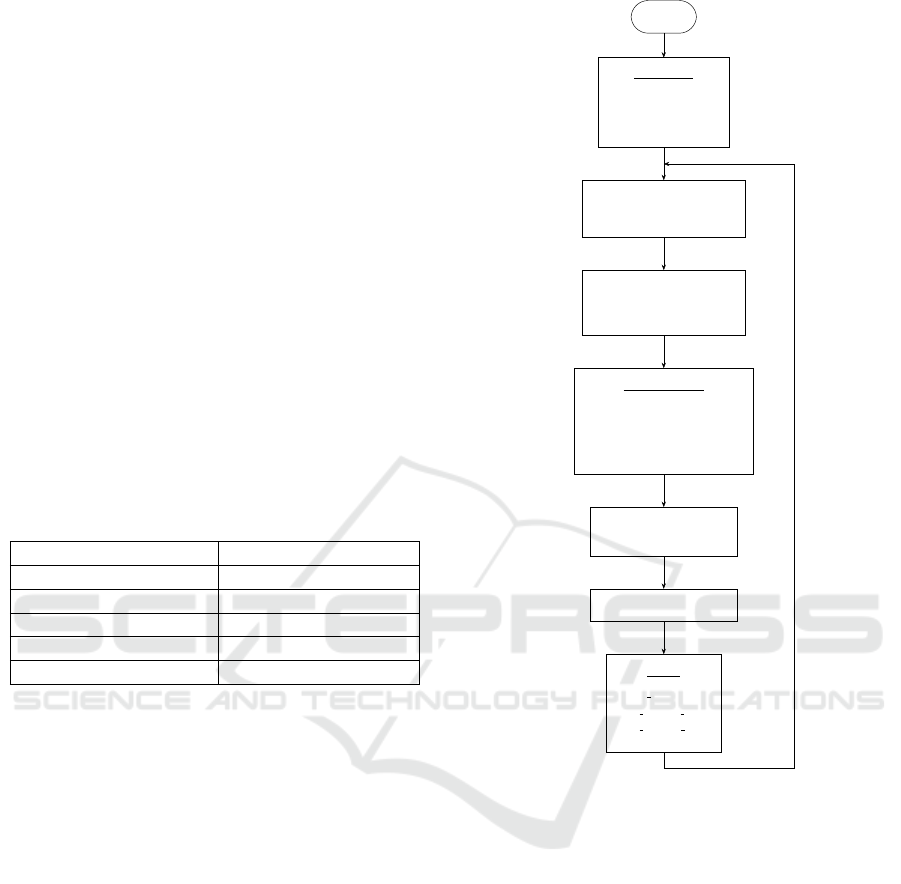
Start
Initialization
Calculate P
pv
(k) = V
pv
× I
pv
GA Optimization
- Evaluate fitness: P - ∆ × 5
- Tournament selection
- New ∆
opt
- Crossover and Mild mutation
Execute P&O algorithm
with new ∆
opt
Limit Duty Cycle
Update
duty old = duty
P old = P pv
V old = V pv
- Population = 50
- Generations = 5
- ∆ ∈ [0.00005, 0.0002]
Measure V
pv
(k), I
pv
(k)
Apply Filter to V
pv
(k), I
pv
(k)
Figure 8: Flowchart of the GA+P&O algorithm.
converter models, input profiles, and sampling condi-
tions. Table 6 details the core configuration param-
eters defined for each strategy, including the initial
duty cycle, perturbation step size, control approach,
and required input signals.
6 SIMULATION SCENARIOS
To evaluate the performance of the implemented
MPPT algorithms under realistic operating condi-
tions, a subset of representative scenarios was se-
lected from a broader test set. This selection bal-
ances coverage of typical, dynamic, and critical oper-
ating conditions while maintaining compactness suit-
able for the scope of this paper.
Two types of scenarios were considered: (i) con-
ventional operating conditions with a single bypass
ICINCO 2025 - 22nd International Conference on Informatics in Control, Automation and Robotics
160
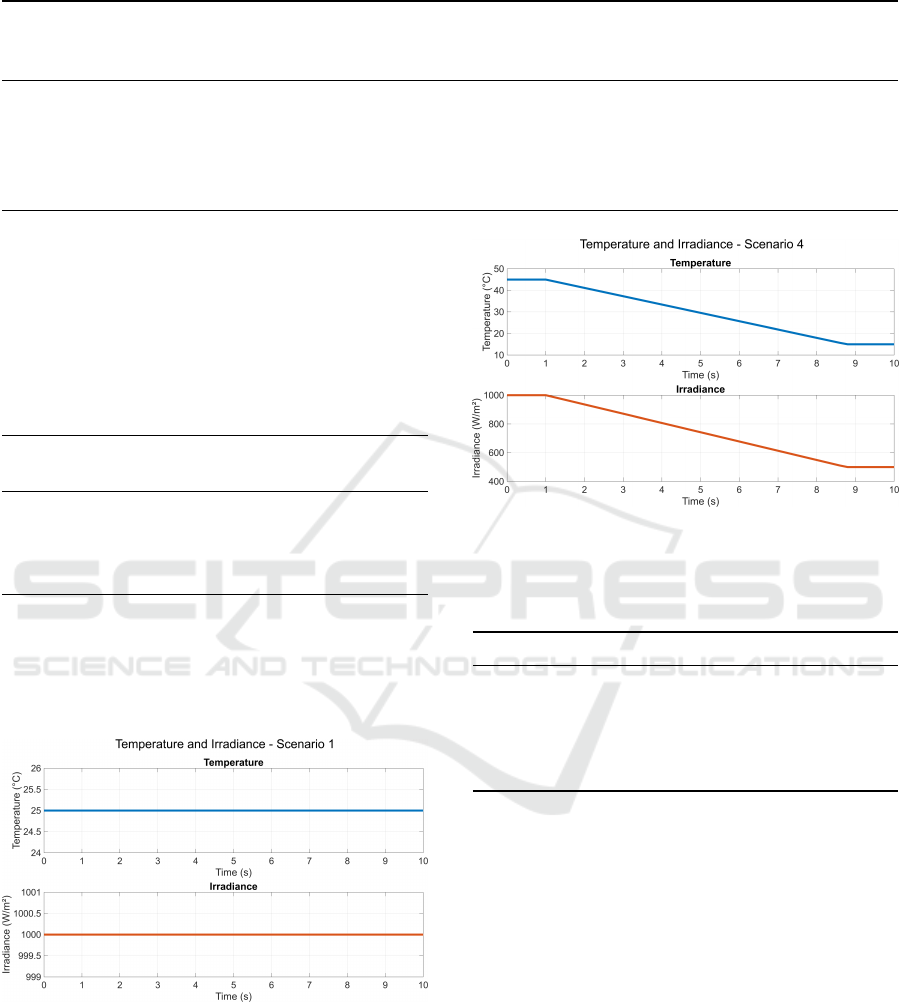
Table 6: Algorithm configuration parameters.
Algorithm Step Size
(adimensional, duty
cycle step) ∆
D
init
Bounds Tuning Inputs
(Volts,
Amperes)
P&O 1.25 × 10
−4
0.5555 0/1 Fixed V
pv
,I
pv
InC 1.25 × 10
−4
0.5555 0/1 Fixed V
pv
,I
pv
FLC N/A N/A 0/1 Rules V
pv
,I
pv
InC+GA [5.0 × 10
−5
, 2.0 × 10
−4
] 0.5555 0/1 GA V
pv
,I
pv
P&O+GA [5.0 × 10
−5
, 2.0 × 10
−4
] 0.5555 0/1 GA V
pv
,I
pv
diode, and (ii) PSC with three bypass diodes, each
protecting a series-connected group of cells.
Table 7 summarizes the selected cases for the sin-
gle bypass diode configuration, including one ideal
(uniform) and one dynamic case with simultaneous
variation of irradiance and temperature.
Table 7: Selected scenarios with single bypass diode.
Case Scenario Descrip-
tion
Fixed Parameters
S1 Uniform irradiance:
G = 1000 W/m
2
T = 25
◦
C
S2 Simultaneous varia-
tion of G and T
—
Figures 9 and 10 illustrate the irradiance and tem-
perature profiles for scenarios S1 and S2, respectively.
Scenario S1 represents a constant and ideal condition,
while S2 reflects a more realistic and challenging case
with time-varying environmental conditions.
Figure 9: Irradiance and temperature profile for scenario S1
(uniform condition).
Table 8 presents the selected PSC cases with three
cell groups, each affected by different irradiance val-
ues. Case S3 represents a moderately mismatched
condition with one shaded group, while Case S4 cor-
responds to a severely mismatched configuration with
all groups shaded at different levels.
Figure 10: Irradiance and temperature variation for sce-
nario S2 (dynamic condition with environmental changes
over time).
Table 8: Selected PSC scenarios with three bypass diodes.
Case PSC Configuration Fixed Parameters
S3 G =
[900, 1000, 200]
W/m
2
T = 25
◦
C
S4 G = [300, 200, 100]
W/m
2
T = 25
◦
C
Figures 11 and 12 show the irradiance conditions
for scenarios S3 and S4, respectively.
7 EVALUATION METRICS
To rigorously evaluate the behavior of the MPPT al-
gorithms under diverse operating scenarios, a set of
six performance indicators was selected. These met-
rics enable a multi-dimensional assessment by captur-
ing key aspects such as tracking accuracy, transient
behavior, stability, and overall energy efficiency.
7.1 Error-Based Indicators
Four distinct error metrics were adopted to quantify
the deviation between the theoretical maximum input
Application of MPPT Techniques Using Intelligent and Conventional Control Strategies
161
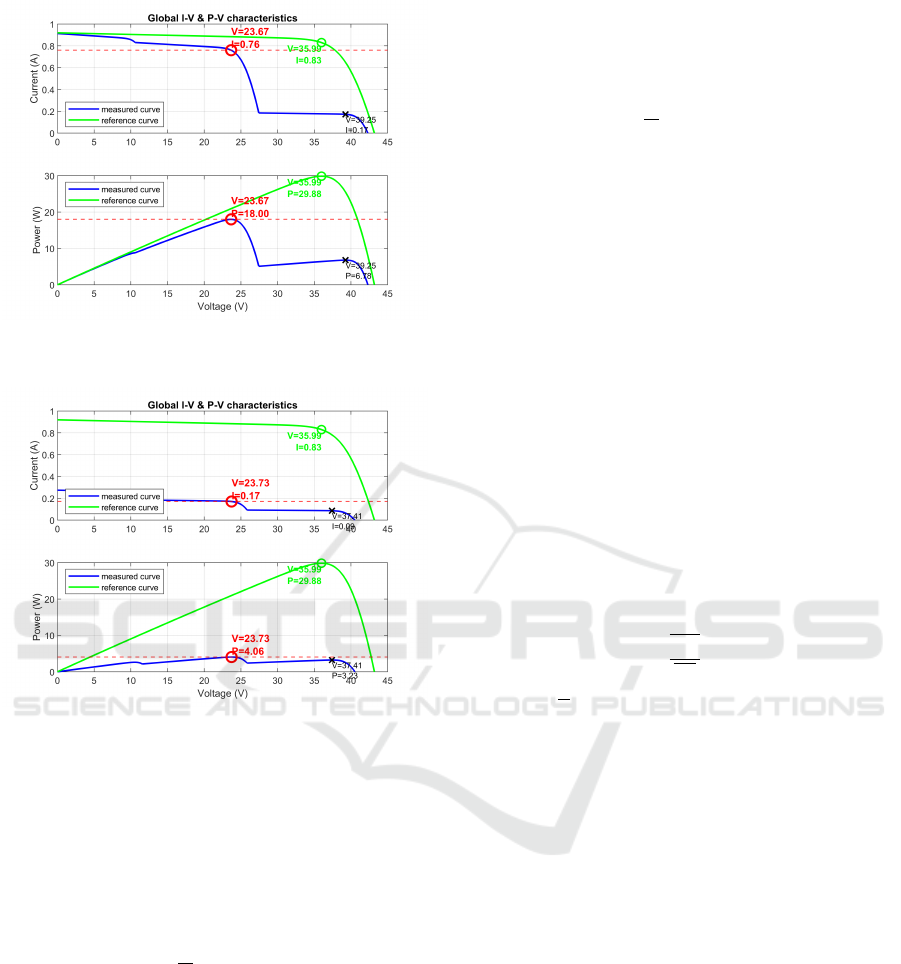
Figure 11: Irradiance profile for scenario S3 (moderate par-
tial shading with one significantly shaded cell group).
Figure 12: Irradiance profile for scenario S4 (severe mis-
match, with all three groups under different shading condi-
tions).
power provided by the PV panel (P
in
) and the actual
output power extracted by the converter (P
out
):
• Mean Absolute Error (MAE): Represents the
average magnitude of the absolute error over the
entire simulation interval:
MAE =
1
N
N
∑
t=1
|P
in
(t) − P
out
(t)| (17)
where N is the total number of samples. Lower
MAE values reflect better steady-state precision.
• Integral Absolute Error (IAE): Measures the
accumulated absolute deviation over time, high-
lighting sustained tracking inaccuracies:
IAE =
Z
T
0
|P
in
(t) − P
out
(t)|dt (18)
Particularly sensitive to long-term error persis-
tence, IAE is useful for evaluating algorithmic ro-
bustness during transitions.
• Mean Squared Error (MSE): Weighs deviations
more heavily by squaring the instantaneous errors,
thus penalizing larger discrepancies:
MSE =
1
N
N
∑
t=1
[P
in
(t) − P
out
(t)]
2
(19)
• Integral Squared Error (ISE): Integrates the
squared error over time, offering insight into the
temporal distribution of large tracking deviations:
ISE =
Z
T
0
[P
in
(t) − P
out
(t)]
2
dt (20)
This metric is especially pertinent in scenarios
such as partial shading, where abrupt power fluc-
tuations are more common.
7.2 Efficiency and Transient Response
Metrics
In addition to tracking accuracy, the energy extrac-
tion capability and dynamic response were assessed
through the following indicators:
• Energy Conversion Efficiency (η): Assesses the
algorithm’s effectiveness in harnessing the avail-
able power:
η =
P
out
P
in
× 100% (21)
where P denotes the average power over the ob-
servation period.
• Convergence Time (t
conv
): Refers to the time
taken for the system to reach and consistently
maintain steady-state operation. This parame-
ter was determined using MATLAB’s lsiminfo
function, with a settling threshold of 2%. Addi-
tional validation was performed through a mov-
ing average analysis of the power error signal to
ensure robustness against transient oscillations.
8 RESULTS
This section presents a comparative analysis of five
MPPT algorithms under distinct environmental con-
ditions. The selected algorithms include two classi-
cal techniques, Perturb & Observe (P&O) and Incre-
mental Conductance (InC), a fuzzy logic-based con-
troller (FLC), and two hybrid approaches enhanced
by genetic algorithms (P&O+GA and InC+GA). Per-
formance was assessed using six key metrics: MAE,
MSE, IAE, ISE, average efficiency (%), and conver-
gence time (s).
ICINCO 2025 - 22nd International Conference on Informatics in Control, Automation and Robotics
162
8.1 Scenario S1 – Constant Irradiance
and Temperature
In this baseline scenario (1000 W/m
2
, 25°C), the
hybrid controllers outperformed the classical tech-
niques by a significant margin. As shown in Table 9,
InC+GA and P&O+GA presented the lowest MSE
values (2.76), and reduced cumulative errors (IAE and
ISE), indicating precise and consistent tracking. The
FLC also delivered competitive results, with a no-
table efficiency of 95.37% and fast convergence. Con-
versely, P&O and InC showed higher steady-state er-
rors and lower efficiencies, confirming their limited
optimization capability under steady conditions.
Table 9: Performance metrics – Scenario S1 (1000 W/m
2
,
25°C).
Algorithm MAE
(W)
MSE
(W
2
)
IAE
(W·s)
ISE
(W
2
·s)
Eff.
(%)
Time
(s)
P&O 2.27 8.45 23.65 96.78 93.60 0.20
InC 2.27 8.42 23.65 96.77 93.63 0.20
FLC 1.30 3.49 13.57 45.56 95.37 0.24
InC+GA 1.31 2.76 13.64 33.88 95.31 0.38
P&O+GA 1.31 2.76 13.64 33.86 95.32 0.38
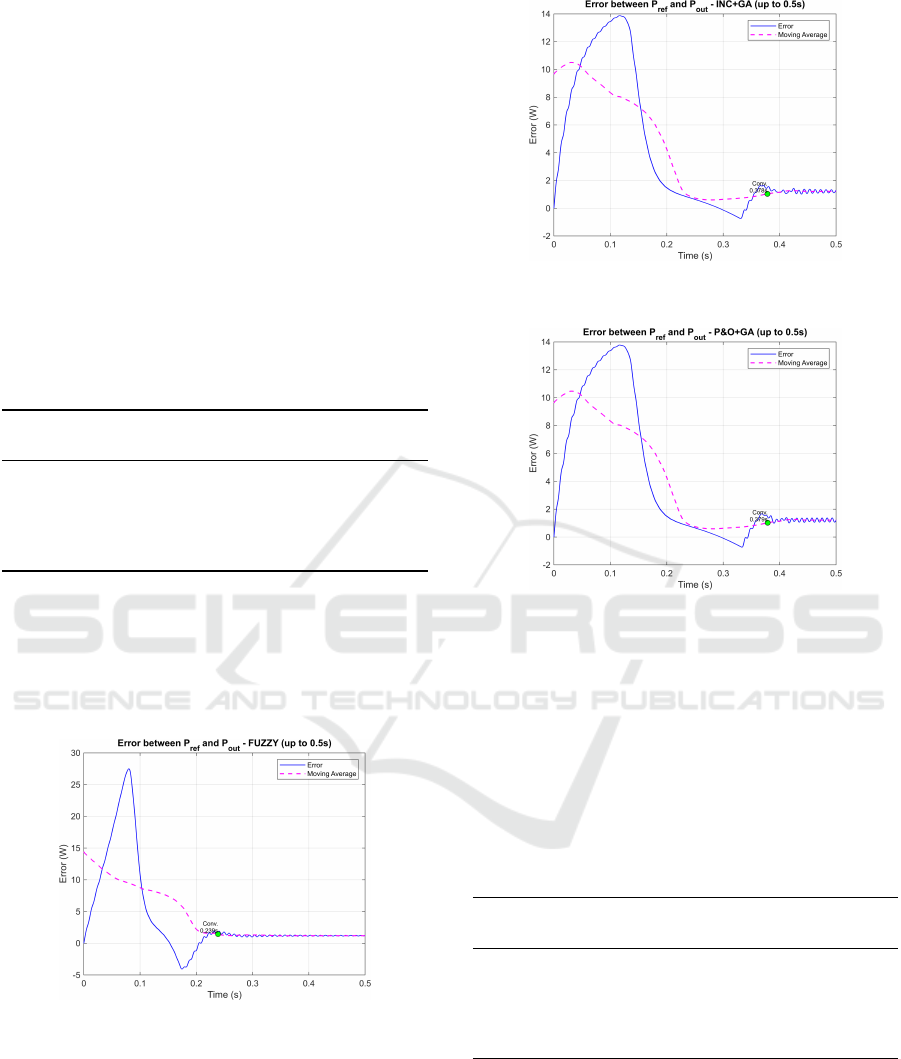
Furthermore, the convergence behaviors of the ad-
vanced approaches are illustrated in Figures 13, 14,
15, showing a smooth and fast reduction in the er-
ror between P
in
and P
out
, with minimal oscillations.
These results reinforce the superior dynamic response
observed in the quantitative metrics.
Figure 13: Error between P
re f
and P
out
for the FLC algo-
rithm under Scenario S1, highlighting convergence time.
8.2 Scenario S2 – Variable Irradiance
and Temperature
Under simultaneous fluctuations in irradiance and
temperature, the system’s dynamic behavior plays a
critical role in MPPT effectiveness. As reported in
Table 10, the hybrid algorithms maintained strong
Figure 14: Error between P
re f
and P
out
for the InC+GA al-
gorithm under Scenario S1, highlighting convergence time.
Figure 15: Error between P
re f
and P
out
for the P&O+GA al-
gorithm under Scenario S1, highlighting convergence time.
performance with MAE values around 1.26 and high
efficiencies close to 94%. FLC again showed good
adaptation with reduced tracking errors and a mod-
erate convergence time. Traditional methods lagged
behind, exhibiting slower response and reduced effi-
ciency due to their limited adaptability to non-linear
environmental variations.
Table 10: Performance metrics – Scenario S2 (variable G
and T).
Algorithm MAE
(W)
MSE
(W
2
)
IAE
(W·s)
ISE
(W
2
·s)
Eff.
(%)
Time
(s)
P&O 1.91 6.33 19.52 71.38 92.34 0.19
InC 1.88 6.23 19.54 71.49 92.57 0.19
FLC 1.23 3.07 12.70 38.77 94.05 0.23
InC+GA 1.26 2.84 13.00 33.07 93.87 0.37
P&O+GA 1.26 2.84 12.99 33.19 93.89 0.37
8.3 Scenario S3 – Partial Shading
(Moderate)
Partial shading introduces local maximum in the
power-voltage curve, making it particularly challeng-
ing for conventional MPPT techniques. In this mod-
erate PSC scenario (G = [900, 1000, 200] W/m
2
), hy-
Application of MPPT Techniques Using Intelligent and Conventional Control Strategies
163

brid methods clearly surpassed classical algorithms,
as shown in Table 11. Both InC+GA and P&O+GA
reached high efficiency levels (96.22%), while FLC
achieved the lowest MAE (0.62), confirming its suit-
ability for non-linear operating profiles. Classical
methods failed to monitoring local maximum, result-
ing in increased tracking errors.
Table 11: Performance metrics – Scenario S3 (PSC: [900,
1000, 200] W/m
2
).
Algorithm MAE
(W)
MSE
(W
2
)
IAE
(W·s)
ISE
(W
2
·s)
Eff.
(%)
Time
(s)
P&O 1.25 2.46 12.80 27.07 94.39 0.23
InC 1.25 2.46 12.80 27.08 94.39 0.23
FLC 0.62 0.89 6.46 11.11 96.30 0.19
InC+GA 0.64 0.77 6.58 9.57 96.22 0.41
P&O+GA 0.64 0.76 6.58 9.52 96.22 0.41
8.4 Scenario S4 – Partial Shading
(Severe)
The final test scenario introduces extreme partial
shading (G = [300, 200, 100] W/m
2
), producing mul-
tiple local maximum in the P-V curve. Table 12
highlights the superior reliability of the hybrid meth-
ods, with both InC+GA and P&O+GA yielding ef-
ficiencies near 92% and significantly lower error in-
dices (MAE ≈ 0.20). In contrast, classical and FLC-
based methods failed to maintain optimal tracking,
with overall efficiencies around 85%. These results
confirm the hybrid strategies resilience and accuracy
under highly non-uniform operating conditions.
Table 12: Performance metrics – Scenario S4 (PSC: [300,
200, 100] W/m
2
).
Algorithm MAE
(W)
MSE
(W
2
)
IAE
(W·s)
ISE
(W
2
·s)
Eff.
(%)
Time
(s)
P&O 0.58 0.57 6.18 6.40 85.55 0.38
InC 0.60 0.58 6.17 6.40 85.18 0.38
FLC 0.55 0.38 5.65 4.13 85.69 0.53
InC+GA 0.20 0.05 2.02 0.52 91.95 0.40
P&O+GA 0.20 0.05 2.03 0.56 91.93 0.40
9 DISCUSSION
The comparative results across Scenarios S1 to S4
reveal distinct performance trends among the tested
MPPT algorithms. Classical methods like P&O and
InC demonstrated consistent behavior and low imple-
mentation complexity but were limited in adaptabil-
ity, particularly under dynamic and partial shading
conditions. Their tracking precision degraded in Sce-
narios S2, S3, and S4, often failing to reach the global
maximum.
The FLC provided improved accuracy and stabil-
ity in both uniform and moderately variable condi-
tions. Its rule-based structure enabled better adapt-
ability than conventional algorithms. However, strug-
gled to accurately track the global peak under severe
partial shading (Scenario S4).
Hybrid approaches enhanced with genetic algo-
rithms (P&O+GA and InC+GA) consistently deliv-
ered the best overall results. These methods showed
high efficiency, minimal error metrics, and strong re-
silience under complex conditions, particularly in the
PSC scenarios.
Table 13 summarizes the main characteristics of
the five MPPT algorithms evaluated in this study.
10 CONCLUSIONS
This work presented a comprehensive comparative
analysis of five MPPT algorithms, P&O, InC, FLC,
P&O+GA, and InC+GA, evaluated under uniform,
dynamic, and partial shading conditions through
a unified MATLAB/Simulink framework. Results
demonstrated that hybrid methods enhanced by ge-
netic algorithms consistently outperform conven-
tional and fuzzy logic controllers, delivering supe-
rior efficiency, accuracy, and resilience, particularly
under severe partial shading. The FLC showed reli-
able tracking with reduced oscillations in moderately
variable conditions, while classical methods exhibited
limited adaptability, especially under complex operat-
ing scenarios.
A natural progression of this research involves
the integration of a bidirectional DC/DC converter,
specifically a Buck-Boost topology, which would en-
able both charging and discharging of an energy stor-
age system. This architecture would facilitate the
transition from a passive PV system to a hybrid
energy management solution, capable of supplying
loads autonomously during periods of low solar gen-
eration.
Additionally, future work could focus on the ex-
perimental validation of the proposed MPPT algo-
rithms under real-world operating conditions. This
would involve developing a physical prototype that
integrates photovoltaic panels, bidirectional convert-
ers, embedded controllers (e.g., microcontroller), and
appropriate sensors for current, voltage, irradiance,
and temperature measurement. Implementing the
control logic directly in embedded hardware would
allow for the assessment of real-time performance,
computational constraints, and resilience to distur-
ICINCO 2025 - 22nd International Conference on Informatics in Control, Automation and Robotics
164

Table 13: Qualitative comparison of MPPT algorithms.
Algorithm
Complexity
Conv. Speed
Stability
Adaptability
PSC Perf.
Sensors
P&O Low Fast Low Low Weak V, I
InC Medium Fast Low Low Weak V, I
FLC High Medium High Medium Good V, I
P&O+GA High Medium High High V.Good V, I
InC+GA High Medium High High V.Good V, I
bances such as measurement noise or sudden environ-
mental changes.
REFERENCES
Ahmed, J. and Salam, Z. (2014). A maximum power
point tracking (mppt) for pv system using cuckoo
search with partial shading capability. Applied En-
ergy, 119:118–130.
Al-Majidi, S. D., Abbod, M. F., and Al-Raweshidy, H. S.
(2018). A novel maximum power point tracking
technique based on fuzzy logic for photovoltaic sys-
tems. International Journal of Hydrogen Energy,
43(31):14158–14171.
Belhachat, F. and Larbes, C. (2017). Global maximum
power point tracking based on anfis approach for pv
array configurations under partial shading conditions.
Renewable and Sustainable Energy Reviews, 77:875–
889.
Benyoucef, A. s., Chouder, A., Kara, K., Silvestre, S., and
sahed, O. A. (2015). Artificial bee colony based algo-
rithm for maximum power point tracking (mppt) for
pv systems operating under partial shaded conditions.
Applied Soft Computing, 32:38–48.
Kaced, K., Larbes, C., Ramzan, N., Bounabi, M., and Dah-
mane, Z. e. (2017). Bat algorithm based maximum
power point tracking for photovoltaic system under
partial shading conditions. Solar Energy, 158:490–
503.
Katche, M. L., Makokha, A. B., Zachary, S. O., and
Adaramola, M. S. (2023). A comprehensive review
of maximum power point tracking (mppt) techniques
used in solar pv systems. Energies, 16(5):2206.
Kazimierczuk, M. K. and Ayachit, A. (2016). Laboratory
manual for pulse-width modulated dc-dc power con-
verters, second edition. Laboratory manual supple-
menting the second edition of the textbook.
Lapsongphon, C. and Nualyai, S. (2021). A comparison of
mppt solar charge controller techniques: A case for
charging rate of battery. pages 278–281.
Martins, J., Spataru, S., Sera, D., Stroe, D.-I., and Lashab,
A. (2019). Comparative study of ramp-rate control
algorithms for pv with energy storage systems. Ener-
gies, 12(7):1342.
Mumtaz, S., Ahmad, S., Khan, L., Ali, S., Kamal, T., and
Hassan, S. (2018). Adaptive feedback linearization
based neurofuzzy maximum power point tracking for
a photovoltaic system. Energies, 11(3):606.
Remoaldo, D. and Jesus, I. (2021). Analysis of a traditional
and a fuzzy logic enhanced perturb and observe algo-
rithm for the mppt of a photovoltaic system. Algo-
rithms, 14(1):24.
Rezk, H., Fathy, A., and Abdelaziz, A. Y. (2017). A
comparison of different global mppt techniques based
on meta-heuristic algorithms for photovoltaic system
subjected to partial shading conditions. Renewable
and Sustainable Energy Reviews, 74:377–386.
Shaiek, Y., Ben Smida, M., Sakly, A., and Mimouni, M. F.
(2013). Comparison between conventional methods
and ga approach for maximum power point tracking
of shaded solar pv generators. Solar Energy, 90:107–
122.
Sharma, A. K., Pachauri, R. K., Choudhury, S., Minai, A. F.,
Alotaibi, M. A., Malik, H., and M
´
arquez, F. P. G.
(2023). Role of metaheuristic approaches for imple-
mentation of integrated mppt-pv systems: A compre-
hensive study. Mathematics, 11(2):269.
Tajiri, H. and Kumano, T. (2012). Input filtering of mppt
control by exponential moving average in photovoltaic
system. pages 372–377.
Texas Instruments (2011). Basic calculation of a buck con-
verter’s power stage (rev. b). Application Report, re-
vised July 2011.
Titri, S., Larbes, C., Toumi, K. Y., and Benatchba, K.
(2017). A new mppt controller based on the ant colony
optimization algorithm for photovoltaic systems under
partial shading conditions. Applied Soft Computing,
58:465–479.
Yang, B., Zhong, L., Zhang, X., Shu, H., Yu, T., Li, H.,
Jiang, L., and Sun, L. (2019). Novel bio-inspired
memetic salp swarm algorithm and application to
mppt for pv systems considering partial shading con-
dition. Journal of Cleaner Production, 215:1203–
1222.
Application of MPPT Techniques Using Intelligent and Conventional Control Strategies
165
