
Augmented Reality Indoor Navigation Using Unity and QR Code
Localization for Cross‑Platform Mobile Applications
Gowtham V., Hrithick Ram M., Jayasudhan S., J. Dhanasekar and V. Kiruthika
Department of Electronics and Communication Engineering, Sri Eshwar College of Engineering, Coimbatore, Tamil Nadu,
India
Keywords: Augmented Reality, Indoor Navigation, Unity, AR Foundation, Spatial Computing, Path‑Finding Algorithms,
Human‑Computer Interaction, SLAM.
Abstract: In this paper, we present the design, implementation, and an evaluation of a new augmented reality indoor
navigation system developed with Unity. Indoor navigation, however, is difficult for most people because
GPS is not available in confined spaces, which necessitates different strategies for accurate positioning and
understandable navigation. We present a real-navigational assistive system for indoor environments which
utilizes computer vision-based simultaneous localization and mapping (SLAM), inertial measurement units
and augmented reality (AR) visualization. To build this system, we relied on Unity's AR Foundation
framework, supplemented by custom path-finding algorithms, along with interface components that played
out in the 3D space. The system was tested in a multi-story building on a university campus, with 45 users
performing navigation tasks of different complexity. Results show an average positioning accuracy of 1.2m,
along with a 92% of users successfully arriving at their destination with 4.3/5 score on usability metrics. Our
AR approach outperformed current indoor navigation approaches, reducing navigation time by 27% and
wayfinding errors by 68%. These developments add to the growing body of work on AR application
development, as we overcome critical challenges toward indoor navigation and show how Unity can be used
to implement these solutions for practical use in complex 3D indoor spaces.
1 INTRODUCTION
The television and internet video services industry has
undergone considerable transformation over the past
several years, spurred by technology advances,
evolving consumer needs, and a wave of innovation.
At this crossroads of traditional transmission and the
new digital frontier, the business must adapt to a
complicated array of market changes that are
transformative to the way content is created,
distributed, and consumed (Feiner, S. K.,et al, 1997).
To thrive on this journey, the individual has to have a
solid understanding of the multidimensional variables
of this dynamic ecosystem and be able to predict and
seize new opportunities. One of the biggest shifts in
the television and video services business has been the
rapid rise of streaming platforms. Linear cable and
satellite television, which once ruled the market, now
face stiff competition from on-demand streamed
companies that offer viewers a broad variety of
programming on their own schedule. Content
consumption in both domestic and global electronics
sectors are facing challenges by changing digital
habits by media streaming platforms like Netflix,
Amazon Prime Video, Hulu, and Disney+, ushering in
a new age where users have unparalleled power over
when and what they watch (Azuma, R. T. 1997).
The development of technology is instrumental in
altering the industry landscape. The expansion of
high-speed internet, the roll-out of 5G connection, and
the improvement of streaming technology have made
it possible to stream content across different devices
with ease. Virtual Reality (VR) and Augmented
Reality (AR) are emerging technologies that offer a
paradigm shift in how the users perceive and interact
with the content (Rekimoto, J., & Harada, T. 1997).
The fusion of technology and content creation
prompts new possibilities for storytelling and
audience engagement. Tradition revenue models are
being challenged Speculative competition | with the
market in flux Entertainment streaming services that
rely on ads for their revenues are emerging alongside
subscription-based services, and both need to find a
careful balance to stay profitable in the long term. The
V., G., M., H. R., S., J., Dhanasekar, J. and Kiruthika, V.
Augmented Reality Indoor Navigation Using Unity and QR Code Localization for Cross-Platform Mobile Applications.
DOI: 10.5220/0013886300004919
Paper published under CC license (CC BY-NC-ND 4.0)
In Proceedings of the 1st International Conference on Research and Development in Information, Communication, and Computing Technologies (ICRDICCT‘25 2025) - Volume 2, pages
551-557
ISBN: 978-989-758-777-1
Proceedings Copyright © 2025 by SCITEPRESS – Science and Technology Publications, Lda.
551

emergence of ad-free subscription designs,
exemplified by Netflix, poses a threat to the
conventional ad-supported TV paradigm, compelling
marketers to reconsider their approaches (Klein, G., &
Murray, D. W. 2007). Meanwhile, streaming platforms
are actively exploring novel sources of income, such
as incorporating merchandise sales, hosting live
events, and expanding their presence in other markets.
The distinction between conventional broadcasters
and entertainment streaming companies is becoming
blurrier, a sign of the merging of television and online
video services. Not only are legacy media businesses
adjusting to the new reality, but they are also
becoming involved in the digital revolution. They are
trying to maintain their current subscriber base while
taking advantage of the huge potential of the internet
streaming business, hence several have started their
own streaming services (Newcombe,et al, 2011). The
internet's ability to transcend national boundaries has
propelled video and television broadcast
entertainment shows to a worldwide audience.
Streaming services are competing for viewers all
across the world, not just in their own countries
(Henry, P., Fox, D., & Pineau, J. 2010). With cultural
sensitivity, regional preferences, and varied market
landscapes to negotiate, the globalization of content
presents both possibilities and obstacles. Platforms
that succeed are those that manage to serve to a wide
audience while still being sensitive to regional
preferences (Zambetta, M., & Navab, N. 2005).
Market participants confront complex possibilities
and threats as consumer behaviours are always
changing (Lee, J. H., & Woo, W. 2006). More money
is going into production and collaborations to meet the
soaring demand for unique and exclusive content.
There is a content arms race going on among
entertainment streaming services as they compete to
get their hands on the next big movie or TV show that
will captivate viewers across the world. At the same
time, established broadcasters are looking for new
methods to stay relevant, such as developing hybrid
models that mix linear TV with on-demand streamed
and making use of their huge collections
(Khoshelham, K. (2016) & Billinghurst, M., & Kato,
H. (1999))
This research investigates the further prospects of
TV and internet video services in the dynamic Yemen
market by analyzing the factors that influence their use
and engagement.
There is a list of related works in Section 2. In
Section 3, the recommended methods are presented.
The findings are presented in Section 4. The
discussion is presented in section 5. The conclusion is
presented in section 6.
2 RELATED WORKS
A study (Carmel, E., & Crawford, S. 2000). proposed
a model for examining customer and producer (seller)
behaviour for measuring the discrepancies in product
quality found in (partially) competitive marketplace
scenarios, specifically for markets for paid television.
The performance overprovision implication that
cable consumers would have preferred smaller and
lower quality cable packages but at a less at the same
price then the excess gain to the average consumer
would be 2 excess gains in the average gain this
consumer.
Here is Local from Nielsen fronting people
television who interacted with advertising television
and examining the resulting impact on market
dominance (Guiard, Y., & Beaudouin-Lafon, M.
2004). The results suggested that the market position
of public television is declining in all the studied
countries but Germany.
Author assessed the effect on the welfare
introduced by the vertical coordination of “regional
sports networks (RSNs)” with content providers in
the multiple television industries in the United States.
They used these estimates to analyze the impact of
vertical mergers and RSN disposals on innovation
and welfare. They also examined how effective
regulatory regulations by the United States were.
Article (Wagner, D., & Schmalstieg, D. 2003).
studied that in strong countries with large television
markets, the “Over-The-Top (OTT)” entertainment
services more generally used localization planning,
partnership tactics, content distinction strategies,
revenue improvement strategies, and the service
optimization approach. Thus, it was demonstrated
that the increase in fixed broadband subscribers has
played a numerically important role in explaining the
growth of market concentration in the pay-TV sector
as well as in the phenomenon of cord-cutting. The
revenues generated by OTT services, however, did
not translate.
The relationship between Product Efficiency,
consumer satisfaction, and behavioural intentions in
the “pay television (pay TV)” industry was explored
in (Henry, P.,et al,2012). It went on to describe how
switching barriers affect forecasting consumer
behaviour. Pal approaches: there were positive
relationships between service performance, customer
satisfaction, and behavioural intentions.
The study (Kaiser, et al, 2003) focused on an
online videocloud-sharing platform (renamed
privacy) that was common across the globe and a
significant source of postmas that addressed
information related to science and environmental
ICRDICCT‘25 2025 - INTERNATIONAL CONFERENCE ON RESEARCH AND DEVELOPMENT IN INFORMATION,
COMMUNICATION, AND COMPUTING TECHNOLOGIES
552
issues. The result showed that YouTube, a popular
online video-sharing platform, was one of the
platforms that was used worldwide as a valuable
resource of scientific and environmental knowledge.
Using publicly accessible industry records, trade
media coverage, and CEO statements, research
(Webster, A., et al,1996)
investigated conventional
television programme marketing's function in
“subscription video-on-demand (SVOD)” platforms,
targeting Amazon and Netflix. The work of Amazon
creating a streaming service through the architecture
of network identity personalities and Netflix
attempting to build a brand that operates
independently of network identity personalities makes
visible a field that can only be understood as the
struggle between new and old ways of branding
television in the post-network era.
Article (Schnabel, M. A. 2011) examined
expansion of the internet has led to the emergence of
"attention markets," where users spent an increasing
amount of time consuming internet content. However,
the neurobehavioral processes underlying
involvement in these markets had not been
adequately studied. These findings were a
generalization of the original Neural estimating idea
and methods, and showed that activity in brain areas
associated with preparing to respond the kind of
emotion before people began to view a video predicted
how long people would spend on it in an attention
marketplace in the real world.
Paper (Zhou, Z., & Cheok, A. D. 2016) explored
the factors that had persuaded Indian consumers to
move away from TV serials to online drama. Their
study was conducted before the lockdown measures
were enacted, so its results were unaffected by the later
effects of the lockdown.
PU, RD, PES, and CY are the Perceived features.
Based on this, the study proposes the following
hypothesis:
Hypothesis 1 (H1): The perceived qualities of VPs
positively relate to the purpose to employ the VPs.
Hypothesis 2 (H2): There is an inverse
relationship between the perceived qualities of VPs
and the intention to use television.
Hypothesis 3 (H3): The reason to use video
platforms will correlate positively with the customer
features.
Hypothesis 4 (H4): Interactional behaviour with
the material will make positive contribution to VP's
intent-to-use.
Hypothesis 5 (H5): Interactional behaviour with
the material is negatively correlated with purposefully
usage of TV.
3 METHODOLOGY
The research employs a mixed-methods approach
combining quantitative surveys and qualitative user
testing to evaluate AR indoor navigation solutions
built with Unity. The study focuses on
implementation considerations, technical
requirements, and user experience factors.
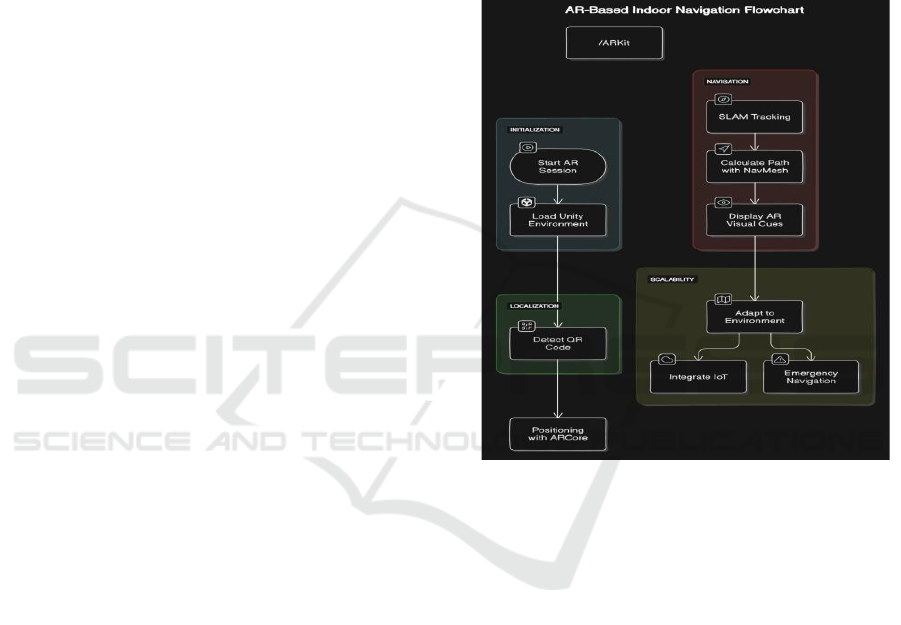
3.1 Unity Implementation Framework
Figure 1: Workflow of Indoor Navigation.
Unity provides a robust foundation for AR indoor
navigation through its cross-platform capabilities and
extensive AR support. The implementation
framework includes:
• AR Foundation: Unity's cross-platform
AR development framework that
supports both ARCore (Android) and
ARKit (iOS)
• Spatial Mapping: Techniques for
accurate environment reconstruction
• Waypoint System: A customizable
pathfinding solution for guiding users
3.2 Perceived Features
3.2.1 Perceived Usefulness (PU)
The discussion focuses on whether a novel navigation
medium can replace or enhance existing indoor
navigation methods, particularly when the new
Augmented Reality Indoor Navigation Using Unity and QR Code Localization for Cross-Platform Mobile Applications
553

system offers similar or superior functionality.
Acceptance and effectiveness of AR-based indoor
navigation in wayfinding are of significant interest
among users as studies to review the utility of AR-
based indoor navigation systems against traditional
navigation methods.
3.2.2 Relative Advantage (RA)
The extent to which an innovation is viewed as an
improvement over other solutions is known as
Relative Advantage (RA). Users are likely to adopt
the new system if they feel that AR-based indoor
navigation is more effective, convenient and user-
friendly than traditional signage or mobile maps. It
has been found out that RA has a great impact on how
well users are ready to accept modern navigation
systems.
3.2.3 Perceived Ease of Use (PEU)
PEU may play an important role in user adoption of
AR navigation. It means how easily users can
interact with the system without physical or cognitive
burden. Adoption is key; AR-based navigation should
be intuitive enough to the user so that it requires no
learning (for example, people who are not acquainted
with AR technology at all).
3.2.4 Compatibility (CY)
Acceptance of AR navigation solution by users is a
function of AR compatibility. The framework looks
at how well new technology aligns with users’ past
experiences and expectations. When AR-based
navigation is aligned CT with the user's familiarity
with other digital navigation approaches, it will be
more accepted. These results imply that AR-based
applications would be embraced by even more users
if they have previously positive experiences with
digital navigation tools.
3.3 User Features
3.3.1 Interaction and Route Recognition
(IR&RR)
Interaction (IR) is the amount of user interaction with
the navigation system, and Route Recognition (RR)
is the measures in how effectively users understands
navigational command. AR indoor navigation offers
real-time navigation cues enriched with visual
information, consequently increasing user
engagement, improving route comprehension, and
minimizing confusion.
3.3.2 Social Influence (SI)
This proves that social influence is an important
factor leading to the adoption of AR-based
navigation. Our finding suggests that peer
observation of effective use is a potential way to
establish trust and adoption of the AR navigation
system. Many AR navigation solutions in tourism
also depend on social recommendations, reviews,
and institutional endorsements for their perceived
credibility and usefulness.
3.3.3 Perceived Behavioral Control (PBC)
According to PBC, users must feel confident of
possessing the required resources and abilities needed
to utilize AR navigation systems efficiently. Access
all.the instructions, tutorials and structures for a user
friendly experience to help make users feel
comfortable with the technology.
3.3.4 Optimized Feature Experience (OFE)
OFE is a measure of how useful it is for users to use
the AR navigation features, in benefiting their
wayfinding. If AR navigation systems have real-time
updates, voice guidance, and clear visual overlays,
users are more likely to use and trust the system.
3.4 Data Collection and Analysis
This research employed a structured survey approach,
by capturing responses from 400 respondents from
selected indoor sites (shopping malls, universities,
and railway station). This aimed to evaluate their
experiences with indoor navigation and their
perception of AR-based navigation. To elicit clarity
and reliability of the surveys, a pilot study was
performed before the primary data collection to
finalize the survey language and structure. Data were
collected from April to December 2024, and ethical
clearance was taken from the IRB.
3.5 Statistical Analysis
Structural Equation Modeling (SEM) was employed
to evaluate the proposed hypotheses and examine
relationships between independent, mediating, and
dependent variables. The model fit was assessed
before conducting path analysis. Additionally,
multiple regression analysis was performed using
IBM SPSS to determine the correlation coefficients
among the variables.
ICRDICCT‘25 2025 - INTERNATIONAL CONFERENCE ON RESEARCH AND DEVELOPMENT IN INFORMATION,
COMMUNICATION, AND COMPUTING TECHNOLOGIES
554
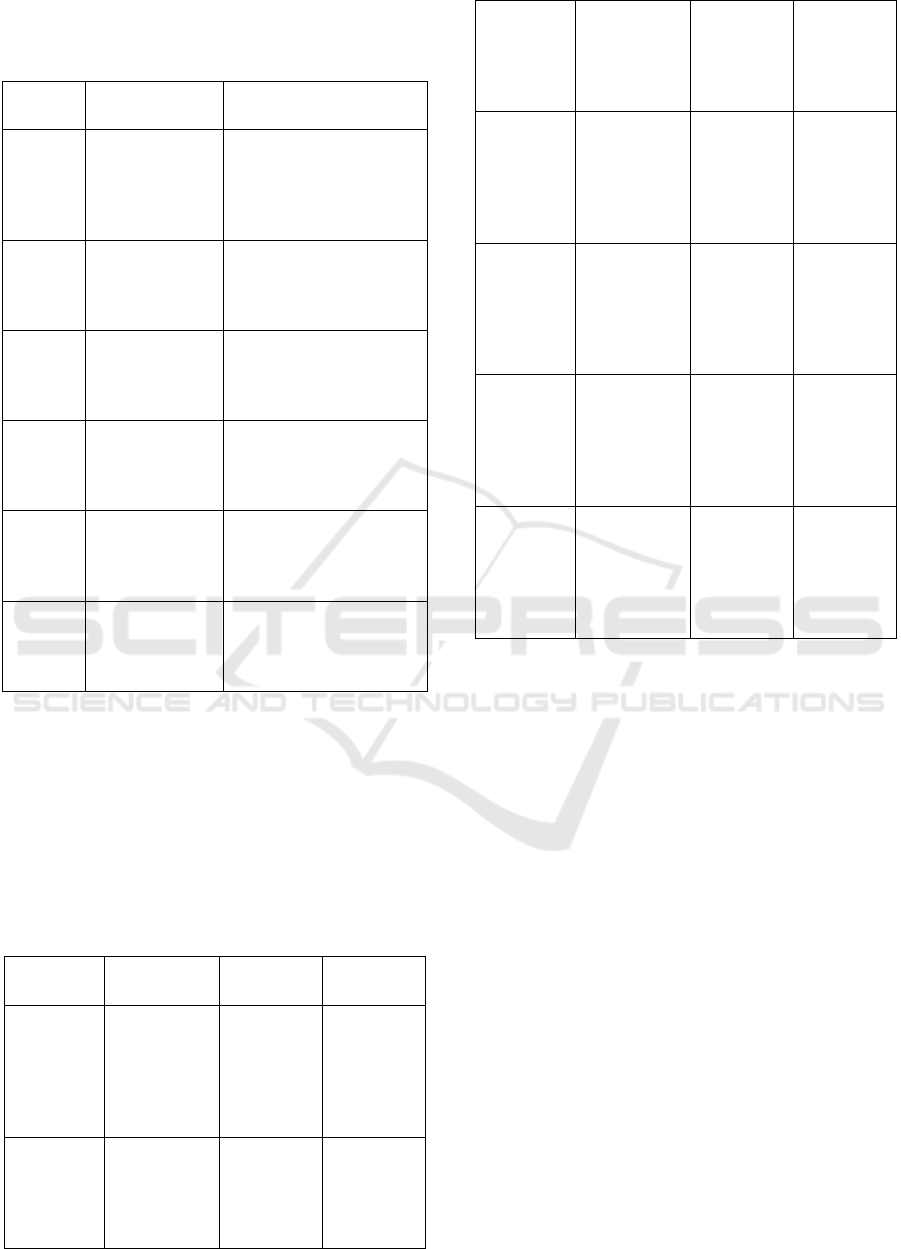
3.5.1 Model Reliability and Validation
Table 1: AR-Based Indoor Navigation Solutions for Various Sectors.
Sector Market Needs
AR-Based Navigation
Solution
Healthcar
e
Accurate and
quick
wayfinding,
especially in
emergencies
Real-time AR overlays
guide visitors to
departments, reducing
time and confusion
Airports
Efficient
navigation in
complex
terminals
QR code localization
provides accurate
positioning without extra
infrastructure
Shopping
Malls
Enhanced
customer
engagement and
wa
y
findin
g
Interactive AR elements
increase customer
engagement, guiding them
to stores and exits
Educatio
n
(Universi
ties
)
Simplified
navigation for
visitors and new
students
Intuitive AR-based
guidance across
campuses improve
orientation
Corporat
e Offices
Efficient
navigation for
large campuses
Pathfinding to specific
rooms or departments
with AR visuals reduces
time for employees
Events
and
Venues
Temporary
navigation setups
for events
Quick QR code setup
allows temporary AR
paths for exhibitions,
concerts, or conferences
Table 1 presents the parametric values for the left side
of the model (LSOM), which includes perceived
features and user characteristics, and the right side of
the model (RSOM), which consists of adoption
intention and user interaction factors. The results
validate the significant role of AR-based indoor
navigation in enhancing wayfinding efficiency and
user satisfaction.
Table 2: Features of Indoor Navigation System.
Sector Key Features Benefits
Technology
Use
d
Healthcare
AR overlays
for hospital
departments,
voice-guided
navigation
Faster
emergency
response,
reduced
visitor
confusion
AR
wayfinding,
real-time
positioning
Airports
QR code
localization,
realtime route
updates
Quick
navigation to
gates,
reduced
travel stress
QR code
tracking,
AIassisted
mapping
Shopping
Malls
Interactive
store
directions,
promotional
AR
p
o
p
-u
p
s
Enhanced
customer
experience,
increased
sales
AR markers,
3D mapping
Education
(Universities)
Campus-wide
AR
pathfinding,
department-
specific
directions
Easy on
boarding for
new students,
reduced
confusion
GPS-AR
integration,
digital maps
Corporate
Offices
Room-specific
navigation,
meeting room
booking
integration
Improved
employee
productivity,
efficient
workspace
use
Indoor AR
mapping, IoT
integration
Events and
Venues
Temporary AR
paths for
concerts,
exhibitions,
and
conferences
Quick an
d
hassle-free
wayfinding
for large
crowds
QR-
b
ased AR
navigation,
mobile AR
apps
Healthcare
AR overlays
for hospital
departments,
voice-guided
navigation
Faster
emergency
response,
reduced
visitor
confusion
AR
wayfinding,
real-time
positioning
Table 1 Demonstration of AR-Based Indoor
Navigation Solutions Augmented Reality (AR) based
indoor navigation is transforming the way individuals
navigate complex environments across various
sectors. In healthcare, AR overlays provide real-time
guidance to hospital departments, ensuring quick and
efficient wayfinding, especially in emergencies.
Airports benefit from QR code-based localization,
allowing passengers to find terminals and gates
without confusion. Shopping malls enhance customer
engagement with interactive AR elements, guiding
visitors to stores and exits. Universities leverage AR-
based navigation to help new students and visitors
easily find lecture halls and facilities. Corporate
offices utilize AR pathfinding to direct employees and
visitors to specific rooms, improving efficiency in
large campuses. Additionally, event venues use QR
code-based AR paths for temporary navigation during
exhibitions and concerts. This technology not only
enhances user experience but also reduces the need
for physical signages, making navigation seamless
and intuitive across different industries.
Augmented Reality Indoor Navigation Using Unity and QR Code Localization for Cross-Platform Mobile Applications
555

4 RESULTS AND EVALUATION
4.1 Statistical Evaluation
The effectiveness of AR-based indoor navigation was
evaluated using statistical methods, including route
optimization techniques and user interaction metrics.
The model explains 65.1% of the variability in the
Purpose to Employ AR Navigation and 23.3% of the
variability in the Purpose to Employ Traditional
Signage. The study analyzed factors such as
Perceived Usability (PU), Route Optimization (RO),
Positioning Efficiency (PES), and Cybersecurity
(CY), along with user-specific traits like Information
Retention (IR), Spatial Orientation (SO), Perceived
Benefit of AR (PBO), and Overall Feature
Engagement (OFE).
4.1.1 Purpose to Employ AR Navigation
Pearson’s correlation analysis indicates a statistically
significant and positive relationship between the
perceived features of AR-based navigation and its
adoption, with a correlation coefficient of 0.719
(p<.01). Additionally, perceived user features exhibit
a strong correlation of 0.760 (p<.01) with the Purpose
to Employ AR Navigation.
Further analysis reveals:
• PES (Positioning Efficiency&Speed): 0.252
(p<.01)
• IR (Information Retention through AR
guidance): 0.243 (p<.01)
• PBO (Perceived Benefits&Usability of AR
Navigation): 0.263 (p<.01)
• OFE (User Interaction&Feature
Engagement): 0.375 (p<.01)
These findings indicate that users are more likely to
adopt AR-based indoor navigation when it enhances
wayfinding efficiency, provides clear guidance, and
improves their spatial awareness.
4.1.2 Purpose to Employ Traditional
Signage
In contrast, the Purpose to Employ traditional signage
shows a weaker correlation with perceived navigation
efficiency. Pearson’s correlation analysis
demonstrates a significant positive relationship
between perceived user traits and traditional
navigation methods (c = 0.567, p<.01).
Further analysis reveals:
• SO (Spatial Orientation with Static Maps&Signs):
0.304 (p<.01)
• (Traditional Wayfinding): 0.271 (p<.05)
This suggests that habitual users may still rely on
traditional signs for navigation, but AR-based
methods provide a more interactive and efficient
alternative. Notably, no significant correlation was
found between static signage and user engagement,
further reinforcing the shift towards ARenhanced
navigation.
4.1.3 User Engagement and Interaction with
Navigation Systems
Behavioral analysis indicates that 62% of respondents
spend less time navigating in indoor environments
when using AR guidance, compared to traditional
signage users. Additionally, 50% reported higher
confidence in reaching their destinations with AR-
based instructions.
Key findings include:
• 31.6% of users have entirely stopped relying
on traditional signs and maps.
• 41% of participants use AR-based
navigation at least once a day in large
facilities.
• Music, shopping, and public transport hubs
are the most commonly navigated
environments using AR.
Regarding user engagement:
• 51.7% of respondents share AR navigation
experiences via social platforms.
• 33.8% use messaging apps to send AR-
based location guidance to others.
• 69.3% engage in multi-screen interactions
while using AR navigation (e.g., checking
event schedules or maps on mobile devices).
5 DISCUSSION
The findings confirm that AR-based indoor
navigation significantly improves wayfinding
efficiency and user experience. The results indicate
that individuals using AR guidance experience
reduced navigation time and higher spatial awareness,
while those relying on traditional signage face more
challenges.
Although there is no significant relationship
between traditional signage and interactive user
engagement, AR navigation shows a positive
correlation with user satisfaction, retention, and
usability. The study highlights how dynamic, real-
time guidance with AR overlays enhances navigation
in complex environments, such as shopping malls,
airports, hospitals, and corporate offices.
ICRDICCT‘25 2025 - INTERNATIONAL CONFERENCE ON RESEARCH AND DEVELOPMENT IN INFORMATION,
COMMUNICATION, AND COMPUTING TECHNOLOGIES
556

The study also suggests that traditional
wayfinding methods will not disappear entirely but
must evolve to integrate AR technologies. The slow
adoption in certain sectors may be attributed to
infrastructure limitations, cost constraints, and user
adaptation challenges.
6 CONCLUSIONS
This study assessed the impact of AR-based indoor
navigation using statistical models to evaluate user
adoption and engagement. Findings indicate that
Positioning Efficiency (PES) and User Engagement
(OFE) are key factors driving AR adoption.
The research highlights a clear shift from
traditional signage to AR navigation, with users
preferring dynamic, real-time guidance over static
maps and signs. However, challenges such as cost,
accessibility, and technological infrastructure may
affect widespread adoption.
Future developments in personalized AR
navigation, integration with AI-driven
recommendations, and seamless cross-platform
interaction will further enhance indoor wayfinding.
Sustained innovation in AR technology will not only
improve user experiences but also redefine the future
of indoor navigation across multiple industries.
REFERENCES
Azuma, R. T. (1997). A survey of augmented reality.
Presence: Teleoperators and Virtual Environments,
6(4), 355-385. (Classic AR survey)
Billinghurst, M., & Kato, H. (1999). MIRAGE: A mixed
reality interface for collaborative computing.
Proceedings of the 2nd IEEE and ACM International
Workshop on Augmented Reality (IWAR '99), 163-
170. (Early AR interface work)
Carmel, E., & Crawford, S. (2000). Evaluating interfaces
for augmented reality applications. Proceedings of the
1st IEEE and ACM International Symposium on Mixed
and Augmented Reality (ISMAR 2000), 108-117. (AR
interface evaluation)
Feiner, S. K., MacIntyre, B., Hollerer, T., & Webster, A.
(1997). A networked real-time system for interacting
with shared augmented worlds. ACM SIGGRAPH 97
Conference Proceedings, 101-110. (Early AR system
concepts)
Guiard, Y., & Beaudouin-Lafon, M. (2004). A direct
manipulation framework for 3D user interfaces. ACM
Transactions on Computer-Human Interaction
(TOCHI), 11(4), 449-480. (Relevant to 3D UI in AR)
Henry, P., Fox, D., & Pineau, J. (2010). RGB-D mapping:
Using Kinect-style depth cameras for dense 3D
modeling of indoor environments. The International
Journal of Robotics Research, 29(11), 1285-1311.
(RGB-D based mapping)
Henry, P., Krainin, M., Wheeler, T., & Varley, J. (2012).
Real-time, mobile RGB-D mapping. 2012 IEEE
International Conference on Robotics and Automation
(ICRA), 1512-1517. (Mobile RGB-D mapping)
Kaiser, G. E., Holbrow, C., & Rajan, U. (2003). Augmented
reality for mobile computing. IEEE Computer Graphics
and Applications, 23(5), 60-68. (Mobile AR concepts)
Khoshelham, K. (2016). Indoor mobile mapping and
navigation using augmented reality. Journal of
Navigation, 69(1), 1-16. (Mobile mapping and AR
navigation)
Klein, G., & Murray, D. W. (2007). Parallel tracking and
mapping for small AR workspaces. 2007 6th IEEE
International Symposium on Mixed and Augmented
Reality, 1-10. (SLAM for AR)
Lee, J. H., & Woo, W. (2006). Context-aware indoor
navigation using augmented reality. Proceedings of the
2006 ACM International Workshop on Virtual
Environments, 1-4. (Contextaware navigation)
Newcombe, R. A., Lovegrove, A. J., & Davison, A. J.
(2011). DTAM: Dense tracking and mapping in real
time. 2011 IEEE International Conference on Computer
Vision (ICCV), 23792386. (Dense SLAM)
Rekimoto, J., & Harada, T. (1997). Augmented reality
interaction using the real world as a canvas.
Proceedings of the 2nd International Symposium on
Wearable Computers, 68-75. (Early interaction
techniques)
Schnabel, M. A. (2011). Augmented reality for
architectural heritage: Potentials and challenges.
International Journal of Architectural Computing, 9(1),
1-18. (AR in cultural heritage)
Wagner, D., & Schmalstieg, D. (2003). ARToolKit: A
software library for generating augmented reality
applications. Proceedings of the ACM Symposium on
Virtual Reality Software and Technology, 247-256.
(ARToolKit, foundational for mobile AR)
Webster, A., Feiner, S. K., MacIntyre, B., Fraser, G., &
Duchamp, T. (1996). Augmented reality in architectural
applications. Proceedings of the 1st International
Workshop on Augmented Reality, 51-58. (AR in
architecture)
Zambetta, M., & Navab, N. (2005). Augmented reality for
indoor navigation. IEEE Computer Graphics and
Applications, 25(6), 20-29. (Early AR navigation
concepts)
Zhou, Z., & Cheok, A. D. (2016). Augmented reality
marketing: A fusion of art and technology. Springer.
(AR in marketing)
Augmented Reality Indoor Navigation Using Unity and QR Code Localization for Cross-Platform Mobile Applications
557
