
A Systematic Approach of a Various Natural Acid‑Base Indicator on
Fruits Using CNN
Nithya C.
1
, Elarmathi S.
2
, Kavya G. S.
3
, Divya Bharathi G.
4
,
Kumarganesh S.
2
and Malathi Murugesan
5
1
Department of CSBS, Knowledge Institute of Technology, Salem 637504, Tamil Nadu, India
2
Department of ECE, Knowledge Institute of Technology, Salem 637504, Tamil Nadu, India
3
Department of BME, Paavai College of Engineering, Namakkal 637018, Tamil Nadu, India
4
Department of CSE, Mahendra Institute of Technology, Namakkal 637503, Tamil Nadu, India
5
Department of ECE, E.G.S. Pillay Engineering College, Nagapattinam 611002, Tamil Nadu, India
Keywords: Bayesian Optimization, Citrus, CNN Regression, Fluorescence, Fruits, MobileNetV2, Acid‑Base Indicators,
pH.
Abstract: To determine the ripeness of citrus fruits, one of the most widely used indicators of fruit development is the
Brix/acid ratio, which is the ratio of the fruit's sugar or soluble solids content to its acid content. A single
spectrum can be subjected to successive applications of a diverse set of statistical models known as SGFP.
These statistical models comprise particular models for differentiation of product categories, fruit type
differentiation amongst citrus varieties, separation of multiple fruit types, and characterization of
compositional differences between two sets of items that are otherwise highly similar. The Brix/acid ratio was
estimated using fluorescence spectroscopy, a technique that is not only fast and sensitive but also very
affordable. After the orange peels were removed, each peel's fluorescence value was calculated. The suggested
system is unusual in that it analyses the fluorescence spectrum using a convolutional neural network (CNN).
When performing fluorescence spectroscopy, a matrix known as an excitation and emission matrix (EEM)
can be created. For every excitation and emission wavelength, the fluorescence intensity is noted in this
matrix. A CNN was then used to perform a regression in order to determine the Brix/acid ratio of the juice
that was collected from the meat. To do this, the EEM was viewed as a picture (CNN regression).
1 INTRODUCTION
Various types of synthetic chemical indicators are
accessible for the different kinds of titrimetric
investigations. PH indicators are measures of acidity
and baseness. Acid-base indicators are chemicals
(dyes) whose colours vary when the pH of their
environment changes. They are often weak bases or
acids, which means they only dissociate and give ions
in solution to a small extent. Pure volumetric
analysis is one of the principal techniques of
quantitative methodologies. The equivalence point
calculation in titrimetry is often based on the end
point of the titration. One of the applications of this
kind of analysis is classical titrimetry, where the end
of a point is detected by adding some compounds to
the analyse solution that cause chromatic changes,
immediately after to each point. These compounds
are often called indicators. Different types of
titrimetric studies have several types of indicators,
most of which are either very weak organic acids or
very weak organic bases that respectively accept or
release electrons. Morimoto T, et al., 1994, Although
there are modern automated titration devices that
identify the equivalent point between reagaging
species, indicators are widely used for simple
titration in academic and research labs. Momin A.M.,
et al., 2010, Thus, the price of commercial indicators
is very high, and some have proved to have
deleterious effects on users as well as the risk of
polluting the environment. These properties
motivated the search for supplementary predictors
based essentially on natural forcings.
One of the most well-known and widely eaten
types of fruit all around the globe is citrus. Citrus
production was the second-highest of all fruits in
Japan in 2015, with Satsuma mandarin (Citrus unshiu
Marc.) being the most popular cultivar. Citrus must
330
C., N., S., E., S., K. G., G., D. B., S., K. and Murugesan, M.
A Systematic Approach of a Various Natural Acid-Base Indicator on Fruits Using CNN.
DOI: 10.5220/0013882600004919
Paper published under CC license (CC BY-NC-ND 4.0)
In Proceedings of the 1st International Conference on Research and Development in Information, Communication, and Computing Technologies (ICRDICCT‘25 2025) - Volume 2, pages
330-336
ISBN: 978-989-758-777-1
Proceedings Copyright © 2025 by SCITEPRESS – Science and Technology Publications, Lda.

not only be consistently available but also of an ever-
increasingly high quality to satisfy customer demand.
To begin, the harvest period of citrus should be
carefully decided by taking into consideration the
maturity of the fruit in order to satisfy demand. Reid
M.S. 2002, This is due to the fact that when citrus fruit
is harvested with a high degree of maturity, it is more
prone to being damaged by mechanical means or
infected by pathogens during the postharvest
handling process. On the other hand, if it hasn't been
matured properly, it won't have a pleasant taste or
look, and it may not even be sellable.
Cary P.R; Iglesias D.J, 2007, Changes in size,
shape, colour, hardness, and the Brix/acid ratio have
all been used frequently to determine the maturation
level of citrus fruit. Since brix and acidity measure the
quantity of sugar or soluble solids present and the
amount of acid present, respectively, they are
especially important parameters. Kimball D, 1991,
Their ratio, sometimes referred to as the Brix/acid
ratio, is one of the most widely used indicators to
assess the ripeness of fruit in addition to the quality
of the juice.
Figure 1: Sample Images of Forty Types of Fruits.
Kondo N, et al, 2000 The fruits were planted in a
revolving motor shaft at a speed of three revolutions
per minute (rmp), and a brief video recording of
twenty seconds was recorded for each class. These
stills are taken directly from the video. Because of the
different lighting circumstances, an algorithm was
used to eliminate the backdrop from each of the
photographs. The example photos of fruit that were
taken are shown in Figure 1. The exact calculation of
the Brix/acid ratio is used to identify the optimal time
to harvest the crop. In the past, the interior quality was
evaluated based on the characteristics of the object's
exterior, such as its dimensions, form, and mass, as
well as its colour. However, the Brix and acidity
levels could not be accurately estimated. Antonucci et
al. used a portable visible-near infrared (VIS-NIR)
spectrophotometer to determine the Brix and acidity
values; however, this method is very expensive.
Tamilarasi M, et al, 2024 Another method that has
recently gained popularity is fluorescence
spectroscopy, which is a rapid, sensitive, and cost-
effective technology.
The researchers Muharfiza et al. looked into the
viability of fluorescence spectroscopy as a method for
determining the stage of maturation reached by
Satsuma mandarins. The fluorescence features were
observed and measured throughout the phases of
development and maturation, and then contrasted
with the conventional maturity indicator known as the
Brix/acid ratio. Muharfiza; et al., 2017 According to
the findings of the research, the Brix/acid ratio was
linked to the fluorescence peaks of amino acids and
chlorophyll, and the peak intensity was useful for
estimating the Brix/acid ratio. However, as of yet, no
quantitative analysis of the accuracy of the Brix/acid
ratio calculation has been conducted. In addition, the
assessment was based on just two of the fluorescence
peaks that a citrus peel really possesses, despite the
fact that a citrus peel actually contains several
fluorescence peaks. In addition, the estimate accuracy
might be improved by taking into account data other
than the peaks of the fluorescence spectrum, such as
the shoulder, unevenness, and troughs of the spectrum
Wang, et al, 2010.
2 EXPERIMENTAL SETUPS
The purpose of this study is to develop an optimum
classification model that can recognise and
distinguish between the many kinds of fruits. Python
3.0 running on Windows 10 was used to build the
suggested model, and the system setup included an i7
CPU and 16 gigabytes of random access memory
(RAM). As can be seen in Figure 2, the model is
evaluated with a variety of records abstracted from a
2 by 2 confusion matrix.
• Macro Average: This macro average is
calculated by computing F-1 for each label and
then averaging the scores, ignoring the fraction
of the dataset that corresponds to the labels.
• Weighted Average: The one that calculates F-1
of each label and averages them weighted by the
proportion of the dataset represented by each
label.
A Systematic Approach of a Various Natural Acid-Base Indicator on Fruits Using CNN
331
2.1 Estimation of the Brix/Acid Ratio
with CNN Regression
In the present study, one of the most conventional
type of CNN was used. In this particular CNN, there
are three different types of layers the fully-connected
layer, pooling layer, and the convolution layer.
Sugiyama J, et al, 2013 CNN regression was
performed by moving the regression layer to the very
last layer to get the Brix/acid estimate. 1) Mean
square error refereed as a loss function. We then
adjusted the weight of each filter and bias to
minimize mean square error due to the difference
between the estimated and actual Brix/acid ratio and
the estimated value.
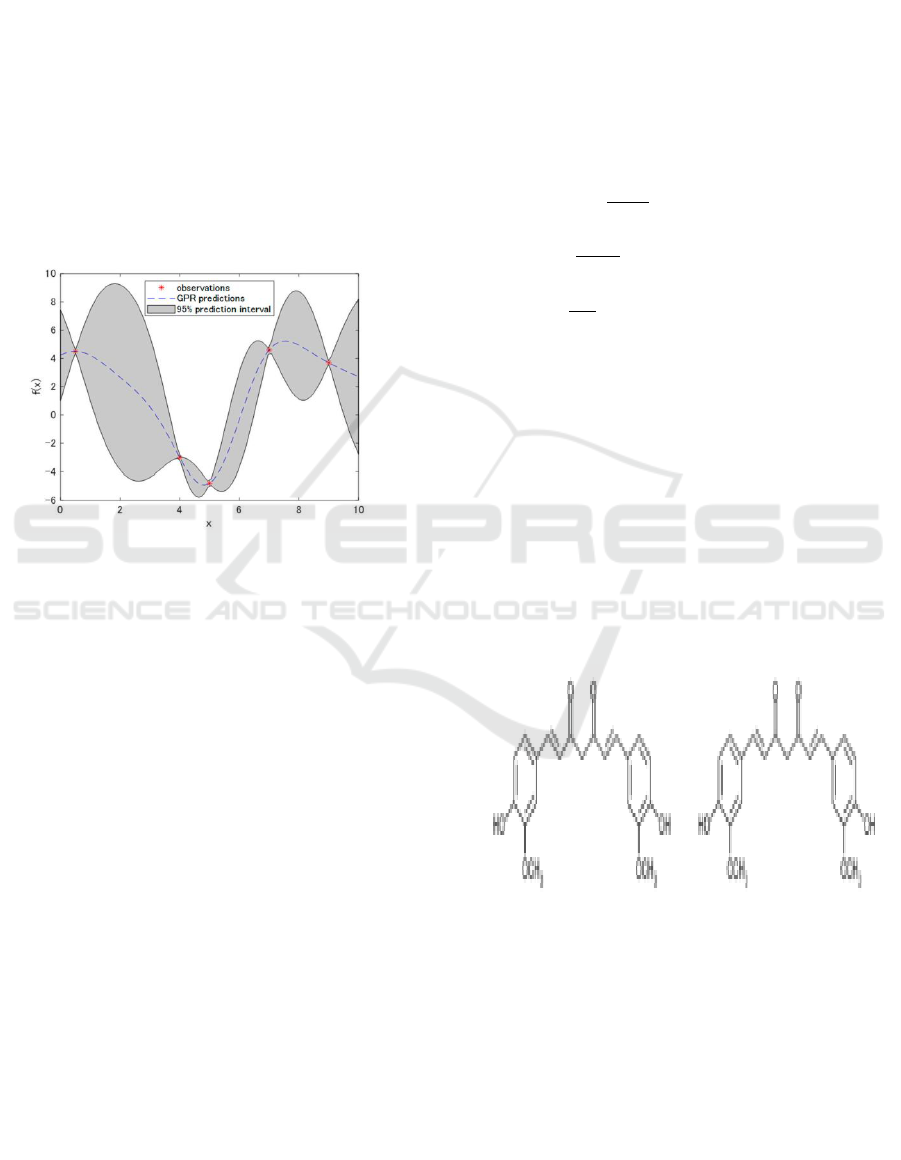
Figure 2: An Illustration of a Five-Observation Gaussian
Process Regression (Dotted Line). the 95% Prediction
Interval Is Shown by the Patched Area.
In Figure 2, a dotted line represents the results of the
predictions made using a Gaussian process
regression. Barbedo J.G.A, 2018 The estimated value
of the function with the most probable outcomes is
shown in this line. The area that has been patched
with grey may contain the function's value. This
illustrates that the percentage is 95%. The Gaussian
distribution may be described using each graph that
was extracted in the vertical direction for a particular
x value.
2.2 Flowers, Plants and Fruits
Materials
Red cabbage, tulip petals, rose petals, rosa
damascene, red onion skin, curcuma, cinnamon,
ginger, saffron, black pepper, red pepper, yellow
pepper, coffee, quince leaf, strawberry, sour berry,
cornelian cherry, carrot, green walnut, parsley,
coriander, borage, and allium ampeloprasum were
prepared from Agricultural Research Center of
Tabriz. Flowers, plant leaves and petals, and the skins
of fruits and vegetables are all included as examples
Suh, et al., 2018. After being rinsed completely under
running tap water and then cleansed with distilled
water, the samples were allowed to air dry before
being pulverised using a mechanical blender.
Then, the score with respect to the p-th region by
averaging the response over the modalities:
(1)
Given this threshold, the precision (P), recall (R) and
F1 score are computed as:
(2)
(3)
(4)
where T
P
is the numeral value of true positives
(correct detections), F
P
is the numeral value of false
positives (false detection), F
N
is the number of false
negatives (miss) and T
N
is the numeral value of true
negatives (correct rejection).
2.3 Chemicals Required
All of the chemicals were of analytical reagent quality
and were obtained from Sigma-Aldrich Chemical
(carbon tetrachloride, chloroform, ethanol, methanol,
toluene, and hydrochloric acid) and Merck (all other
compounds). Water that had undergone two
distillations was used to make each solution.
Figure 3: Chemical Construction of Curcumin in Enol (A)
and Keto (B).
2.4 Apparatus
Reagent bottle, weighing balance, spatulas, hot plate,
shaker, oven, electric blender, test tubes, test tube
support, droppers, 50 mL buretes, wash bottle,
beaker, spatula, pipettes, pipette filler, funnel, clamp
support, tissue, magnetic stirrer, watch glass,
volumetric cylinders of 25 mL and 50 mL, conical
ICRDICCT‘25 2025 - INTERNATIONAL CONFERENCE ON RESEARCH AND DEVELOPMENT IN INFORMATION,
COMMUNICATION, AND COMPUTING TECHNOLOGIES
332
flask, pH paper, magnetic stirrer, watch glass pH
meter (electronic - Switzerland model OHAUS2100),
measuring cylinders, and glass and calomel
electrodes.
2.5 Extraction Preparation of Flowers,
Plants and Fruits in Various
Solvents
To explore the extraction efficiencies of the five
organic solvents, two grams of the sample powder
were mixed with fifty millilitres of carbon
tetrachloride, chloroform, ethanol, methanol, and
toluene as solvents by stirring the mixture for forty-
eight hours. The solution was vigorously agitated and
stirred to ensure the entire component would
dissolve. The extract is filtered by suction through
strainer paper with the aid of a Buchner funnel and
collected in a filter flask. All aqueous abstract were
used after evaporation as natural pointer in
acidimetric and alkalimetric measurements. One-fifth
of the volume of the original abstract was extracted.
The extract was protected from light by storing it in a
container with a lid in the dark.
3 RESULTS AND DISCUSSION
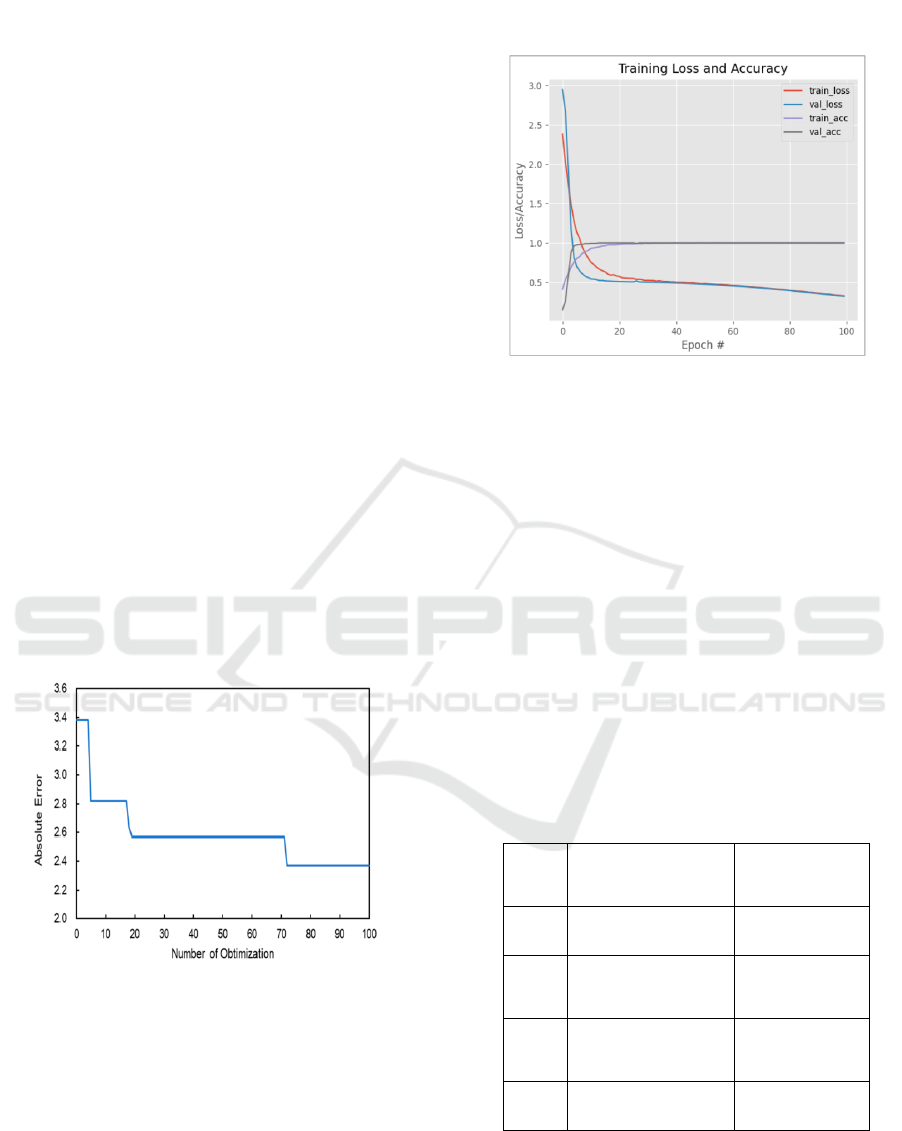
Figure 4: Relationship Between the Number of
Optimizations and the Brix/Acid Ratio Estimate's Smallest
Absolute Inaccuracy.
Figure 4 illustrates the relationship between the
minimal absolute error in the Brix/acid ratio and the
number of parameter modifications. As more
improvements were carried out, the estimate's lowest
absolute error decreased to a smaller value. Results
from the same optimization method were quite
similar when it was repeated.
Figure 5: Training Accuracy and Loss in Terms of Training
and Validation of Tl-Mobilenetv2 Model.
Figure 5 also includes a representation of the
suggested model's training loss. The illustration
shows that the training loss is relatively significant at
the beginning of the training phase since the model
has not yet been presented with the data. This is
illustrated in the image. But, with time the model
learns to understand the pictures and begins to recall
them; as a result, the training loss progressively
decreases. It is possible to see that the training loss
approaches 0.6 during the first 20 iterations and then
decreases noticeably with each subsequent iteration
beyond that point. The training loss has reached 0.3
by the time the 100th iteration has passed, which
indicates that the model has the qualities of a good
one.
Table 1: Assessment Value of Brix/Acid Ratio.
S. No
Assessment
Method
AEE of
Brix/Acid
Ratio
1.
Two peaks of poly
methoxy flavone
6.20
2.
Two peaks of
Tryptophan and
Chlorophyll
4.48
3.
PCR (Principal
Component
Regression)
4.03
4.
Proposed method
(CNN regression)
2.47
Together with the absolute error of the present CNN
regression and the previous estimate methods, Table
1 displays the absolute error of the Brix/acid ratio.
A Systematic Approach of a Various Natural Acid-Base Indicator on Fruits Using CNN
333
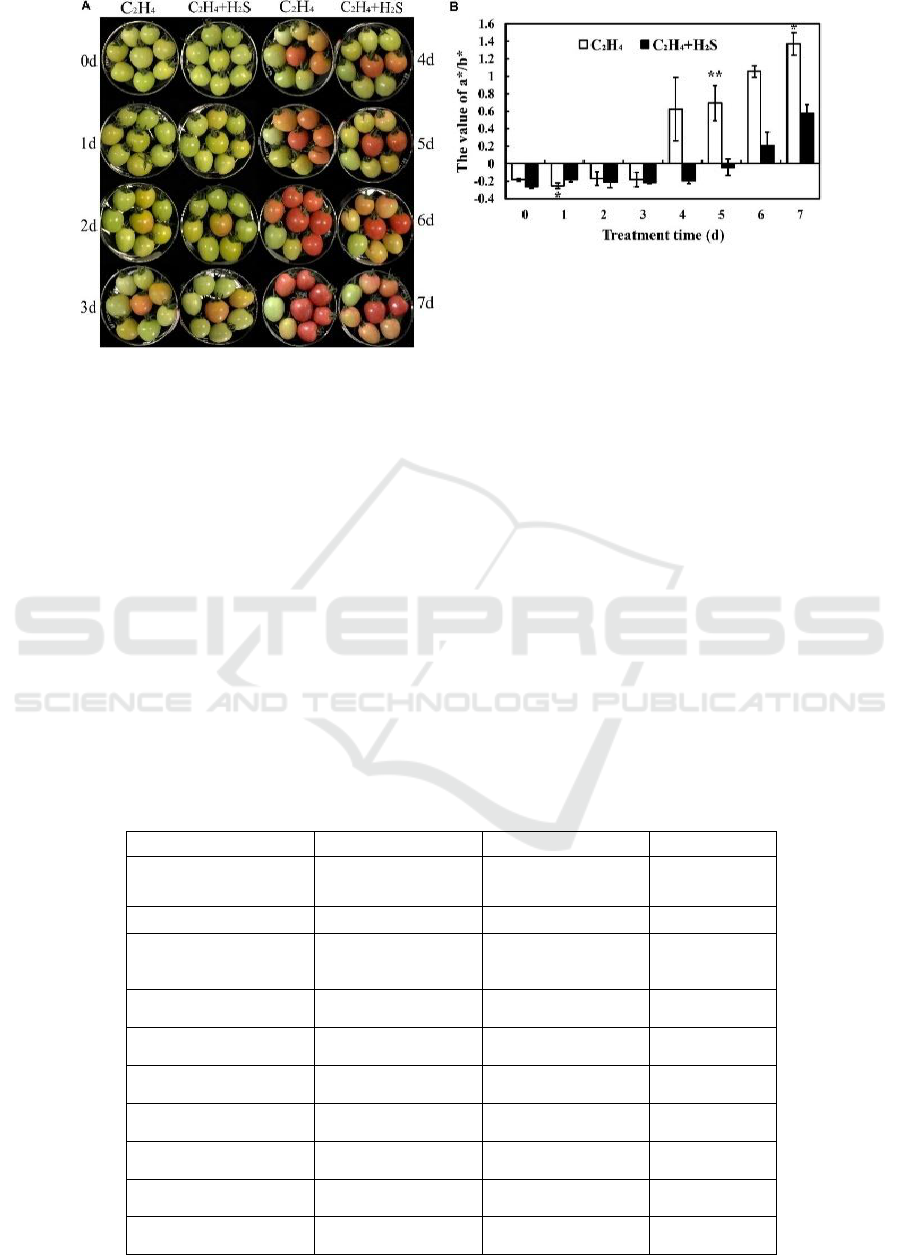
Figure 6: The Phenotypic Alteration of Post-Harvest Tomato Fruits Treated With C2h4 or C2h4-H2s.
(A) Morphological change of tomato fruit after
harvest. (B) The tomato post-harvest storage a/b
value regarding colour parameter changes after C2H4
or C2H4-H2S treatment. The magenta to green colour
range is represented by the a* value whereas the
yellow to blue colour range is represented by the b*
value. Values are the means standard deviations (n
= 3). All of the above experiments were performed at
room temperature and 85–90% relative humidity.
The symbols and * indicate a p 0.05 and p 0.01,
respectively, significant difference between C2H4
and C2H4-H2S.
Figure 6A depicts the colour change of tomato
fruit over the post-harvest storage period. On the 0th
day, all tomato fruits are clearly seen to be at the
green-yellow (G-Y, 30% yellow skin) stage. During
the first and second days, some C2H4-induced
tomatoes are in the green-orange (G-O, 50% orange
skin) stage, but tomato fruits are practically in the G-
Y stage due to the C2H4 + H2S co-treatment. The
colour change was indicated using an a/b value, as
seen in Figure 6B. Over the storage time, the a/b
values of the two treatment groups increased, whereas
the a/b value of the H2S + ethylene treatment group
remained lower than that of the ethylene treatment
alone. Hence, further H2S treatment may reduce
tomato colour change and postpone tomato fruit
ripening during post-harvest storage.
Table 2: The Factors Score of All the Metabolites by Principal Component Analysis in Tomato Fruits.
Metabolites
Component 1
Component 2
Component 3
Content of titratable acid
(C2H4 + H2S)
0.975
0.18
0.150
Protease activity (C2H4)
-0.95
0.12
0.272
Content of chlorophyll b
(C2H4 + H2S)
0.948
0.101
-0.25
Content of starch (C2H4
+ H2S)
0.939
0.156
-0.228
Content of titratable acid
(C2H4)
0.895
0.427
0.240
Content of Anthocyanidin
(C2H4 + H2S)
-0.88
0.191
0.276
Protease activity (C2H4
+ H2S)
-0.871
0.276
0.376
Content of total phenol
(C2H4 + H2S)
-0.806
0.535
0.133
Content of chlorophyll a
(C2H4)
0.796
0.522
-0.109
Content of reducing
sugar (C2H4)
0.783
0.420
-0.537
ICRDICCT‘25 2025 - INTERNATIONAL CONFERENCE ON RESEARCH AND DEVELOPMENT IN INFORMATION,
COMMUNICATION, AND COMPUTING TECHNOLOGIES
334

Content of reducing
sugar
(C2H4 + H2S)
0.776
0.252
-0.529
Content of total phenol
(C2H4)
-0.697
0.427
0.237
Content of chlorophyll
(C2H4)
0.69
0.645
0.267
Content of Anthocyanidin
(C2H4)
-0.633
0.581
0.445
Content of flavonoid
(C2H4 + H2S)
0.221
0.952
-0.274
This is a principal component analysis study
presented in Table 2 and seen in Figure 7. 77% of the
variance was provided by the first three components
(PC1, PC2, and PC3 with respective contribution
rates being 47.64, 38.42, and 6.3%. The major
components described by PC1 were TA, protease
activity and starch. The major contributor to PC2 was
Flavonoid, chlorophyll b, and amylase activity, while
ascorbic acid accounted for PC3.
Table 3: Anthocyanidic Compounds, Obtained from the Analysis in
the Uhplc-Esi-Q-Orbitrap-Ms / Ms.
Compound
Name
Fragment
Weight
(m/z)
Condensed
Formula
Retention
time
(Min)
Cyanidin -
Diglucoside
611.18
m/z
C
27
H
31
O
16
+
19.1 min
Cyanidin –
Monoglycoside
433.11
m/z
C
21
H
21
O
11
+
20.2 min
Pelargonidin –
Diglucoside
595.18
m/z
C
27
H
31
O
15
+
19.5 min
Cyanidin
287.06
m/z
C
15
H
11
O
6
+
19.1 min
Pelargonidin
271.06
m/z
C
15
H
11
O
5
+
19.5 min
Table 4: Values of Pk1 As a Function of Ph Stability in the Presence
of Oxygen and Light from the Extract Punica Granatum L.
Number
Ph
Absorbance
Pk1
1
6
0.455
a = Ain
2
6.5
0.461
b=Hin-
3
7
0.473
-
4
7.5
0.55
-
5
8
0.578
-
6
1.5
1.018
a = Ain
7
10
0.305
b=Hin-
The characterization of the extract of the fruit Punica
granatum L. was carried out using a UV-Vis
spectrophotometer, and the investigation of the
extract's stability in the presence of light lasted for a
period of seven days (Spectro quant Pharo 300). The
different performance analyses of a UHPLC system
are shown in Figures 9 and 10. And the PH scale is
shown in figure 11 below.
Table 5: Stability in the Presence of Light As a Function of the
Absorbance of the Two Glass Bottles (Colorless and Amber).
Colorless glass
bottle
Amber glass
bottle
Days
Dates
Absorbance
Absorbance
0
15-May-2017
0.77
0.77
1
16-May-2017
0.593
0.366
2
17-May-2017
0.495
0.439
3
18-May-2017
0.496
0.452
4
19-May-2017
0.565
0.452
5
20-May-2017
0.533
0.416
6
23-May-2017
0.497
0.371
4 CONCLUSIONS
A fluorescence measurement of extracted citrus peel
was carried out, and a regression using CNN was
executed in order to provide an accurate estimate of
the Brix/acid ratio of juice taken from the flesh. It was
decided to treat the EEM that was generated from the
fluorescence measurement as a picture, which made
the CNN regression possible. As a consequence of
this, the absolute error in the Brix/acid ratio was
assessed to be 2.48, which is a significant
improvement compared to the values produced by the
various other approaches in the earlier investigations.
Not only was this a suitable strategy for the
prediction, but we also did Bayesian optimization in
order to choose hyper-parameters in the deep neural
network. Both of these things contributed to the
A Systematic Approach of a Various Natural Acid-Base Indicator on Fruits Using CNN
335

accuracy of the forecast. Because of the optimization,
the parameters were able to be determined
automatically and accurately. This was made possible
by the optimization. In addition, it wasdiscovered that
the optimization process itself was responsible for the
high level of accuracy. In future work, a mobile-based
application will be further enhanced using a larger
number of different fruits, which aims to lead to a
wider range of fruit classification.
REFERENCES
Antonucci F, Pallottino F, Paglia G, Palma A, D’Aquino S,
Menesatti P, Non-destructive estimation of mandarin
maturity status through portable VIS-NIR
spectrophotometer. Food Bioprocess. Technol. 2011, 4,
809–813.
Barbedo J.G.A, Factors influencing the use of deep learning
for plant disease recognition. Biosyst. Eng. 2018, 172,
84–91.
Barbedo J.G.A, Impact of dataset size and variety on the
effectiveness of deep learning and transfer learning for
plant disease classification. Comput. Electron. Agric.
2018, 153, 46–53.
Cary P.R, Citrus Fruit Maturity; MPKV: Rahuri, India,
1974; p. 26.
Christensen J, Povlsen, V.T, Sorensen J, Application of
fluorescence spectroscopy and chemometrics in the
evaluation of processed cheese during storage. J. Dairy
Sci. 2003, 86, 1101–1107.
Deng, L.Hinton, G, Kingsbury, B. New types of deep neural
network learning for speech recognition and related
applications: An overview. In Proceedings of the 2013
IEEE International Conference on Acoustics, Speech
and Signal Processing (ICASSP), Vancouver, BC,
Canada, 26–31 May 2013; pp. 8599–8603
Iglesias D.J, Cercós M, Colmenero-Flores J.M Naranjo,
M.A, Ríos, G Carrera E, Ruiz-Rivero O, Lliso I,
Morillon R, Tadeo F.R, et al. Physiology of citrus
fruiting. Braz. J. Plant Physiol. 2007, 19, 333–362.
Itakura K, Hosoi F, Estimation of tree structural parameters
from video frames with removal of blurred images
using machine learning. J. Agric. Meteorol. 2018, 74,
154–161.
Kimball D, Citrus Processing: Quality Control and
Technology; Springer Science & Business Media: New
York, NY, USA, 1991; p. 55.
Kondo N, Ahmad U, Monta M, Murase H, Machine vision
based quality evaluation of Iyokan orange fruit using
neural networks. Comput. Electron. Agric. 2000, 29,
135–147.
Maggiori E, Tarabalka Y, Charpiat G, Alliez P,
Convolutional neural networks for large-scale remote-
sensing image classification. IEEE Trans. Geosci.
Remote Sens. 2017, 55, 645–657.
Miao S, Wang, Z.J, Liao, R. A CNN regression approach
for real-time 2D/3D registration. IEEE Trans. Med.
Imaging 2016, 35, 1352–1363. [CrossRef]
Ministry of Agriculture, Forestry and Fisheries. The
Situation Surrounding Fruits. Available online: http:
//www.maff.go.jp/j/seisan/ryutu/fruits/attach/pdf/index
-57.pdf (accessed on 20 November 2018).
Momin A.M, Kondo N, Ogawa Y, Shiigi T, Kurita M,
Ninomiya K, Machine vision system for detecting
fluorescent area of citrus using fluorescence image.
Proc. IFAC 2010, 43, 241–244.
Morimoto T, Chikaizumi S, Hashimoto Y, Intelligent
quality control of fruit storage factory. J. Shita 1994, 6,
191–196.
Muharfiza; Riza A.F.D, Saito Y, Itakura K, Kohno Y,
Suzuki T, Kuramoto M, Kondo N, Monitoring of
Fluorescence Characteristics of Satsuma Mandarin
(Citrus unshiu Marc.) during the Maturation Period.
Horticulturae 2017, 3, 51.
P. Elayaraja, Kumarganesh S, K. Martin Sagayam & J.
Andrew, (2024), “An automated cervical cancer
diagnosis using genetic algorithm and CANFIS
approaches” International Journal of Technology and
Health Care, 32 (4), pp. 1-17, https://content.iospres
s.com /articles/technology-and-health-care/thc230926.
Reid M.S., Maturation and maturity indices. In Postharvest
Technology of Horticultural Crops; University of
California Division of Agriculture and Natural
Resources Publication: Oakland, CA, USA, 2002; pp.
21–28.
Selvalakshmi B, Hemalatha K, Kumarganesh S &
Vijayalakshmi P (2025), Performance analysis of image
retrieval system using deep learning techniques.
Network: Computation in Neural Systems, 1–21.
https://doi.org/10.1080/0954898X.2025.2451388.
Sugiyama J, Tsuta M, Discrimination and quantification
thechnology for food using fluorescence fingerprint.
Nippon Shokuhin Kagaku Kogaku Kaishi 2013, 60,
457–465.
Suh, H.K, Ijsselmuiden J, Hofstee J.W, van Henten E.J,
Transfer learning for the classification of sugar beet and
volunteer potato under field conditions. Biosyst. Eng.
2018, 174, 50–65.
Tamilarasi M, Kumarganesh S, K. Martin Sagayam and
Andrew J, (2024) “Detection and Segmentation of
Glioma Tumors Utilizing a UNet Convolutional Neural
Network Approach with Non-Subsampled Shearlet
Transform” Journal of Computational
Biology, 31 (8) pp. 1-16, https://www.liebertpub.com
/doi/full/10.1089/cmb.2023.0339.
Wang, X, Cao, L, Yang S.T, Lu F, Meziani M.J, Tian L,
Sun K.W, Bloodgood, M.A.; Sun, Y.P. Bandgap-Like
strong fluorescence in functionalized carbon
nanoparticles. Angew. Chem. Int. Ed. 2010, 49, 5310–
5314.
ICRDICCT‘25 2025 - INTERNATIONAL CONFERENCE ON RESEARCH AND DEVELOPMENT IN INFORMATION,
COMMUNICATION, AND COMPUTING TECHNOLOGIES
336
