
Multi‑Disease Prediction System Using Machine Learning
Vasepalli Kamakshamma
1
, Gurram Mekhala Sumanth
2
, Kesava Reddy Gari Nithin Kumar Reddy
2
,
Bhumannagari Pallavi
2
and Chakala Sri Varshini
2
1
Department of CSE, Srinivasa Ramanujan Institute of Technology, Anantapur, Andhra Pradesh, India
2
Department of CSE (Data Science), Srinivasa Ramanujan Institute of Technology, Anantapur, Andhra Pradesh, India
Keywords: Machine Learning, Django, Web Application, User Interface, Awareness Blogs, Stroke, Diabetes, Depres-
sion, Linear Discriminant Analysis, Random Forest, Light GBM.
Abstract: The healthcare industry is currently experiencing a significant imbalance, with a high patient-to-doctor ratio,
posing challenges to effective patient care. In the age of healthcare digitization, using machine learning (ML)
to forecast diseases has become essential for accurately identifying and effectively treating a variety of med-
ical disorders. This paper examines how to use Django and machine learning to build a reliable multi-disease
prediction system for diseases such as stroke, depression in students, and diabetes. Based on user input fea-
tures, the system is trained to categorize and forecast the likelihood of various diseases using real-world med-
ical datasets. Both healthcare experts and non-technical individuals can profit from the system thanks to the
Django framework's smooth user interface. The paper also discusses crucial procedures including data pre-
processing, model selection, training, and deployment, emphasizing how crucial recall and dependability are
for predictive health solutions. By offering prompt medical action, it seeks to increase awareness of how these
technologies can transform early diagnosis, lower healthcare costs, and ultimately improve patient outcomes.
1 INTRODUCTION
Artificial intelligence (AI) and machine learning
(ML) have become revolutionary technologies in
today's quickly changing healthcare environment,
with the potential to greatly enhance patient care and
medical diagnostics. Disease prediction is one of the
most exciting and important uses of machine learning
in healthcare, where algorithms are trained to identify
trends in medical data and forecast the probability of
different illnesses. Different ML models can be
trained on a disease dataset and it could be used to
predict the probability of a person getting that disease,
eliminating the need of a doctor.
Stroke, Diabetes, and Depression in students are
among the leading health challenges globally. Early
detection and prevention are vital to reduce morbidity
and mortality. Building strong, dependable, and
intuitive systems that can manage several illnesses at
once is the difficult part, though. This is where
machine learning-powered multi-disease prediction
systems developed using Django are useful.
The best platform for implementing machine
learning models and giving users an easy-to-use
interface for making predictions is Django, a robust
Python web framework. We can construct an
application that enables people and healthcare
practitioners to make better decisions regarding
health risks by fusing the predictive power of
machine learning with the user-friendly web
development platform Django. The Multi disease
Prediction System demonstrates the potential of
leveraging machine learning to address critical health
challenges.
The modular nature of the system allows
scalability to include additional diseases in the future.
From data collection and model training to
deployment, this paper will examine the steps
involved in developing a multi-disease prediction
system and the possible benefits it could offer in
terms of bettering early detection, improving
healthcare outcomes, and lowering treatment costs.
The technological challenges of developing this
system, the potential of machine learning in
healthcare, and the concern to raise awareness among
people about these diseases will be covered in
subsequent parts.
This project also includes awareness articles
about the diseases the models are being made for.
These blogs/articles include information about how to
116
Kamakshamma, V., Sumanth, G. M., Reddy, K. R. G. N. K., Pallavi, B. and Varshini, C. S.
Multi-Disease Prediction System Using Machine Learning.
DOI: 10.5220/0013878600004919
Paper published under CC license (CC BY-NC-ND 4.0)
In Proceedings of the 1st International Conference on Research and Development in Information, Communication, and Computing Technologies (ICRDICCT‘25 2025) - Volume 2, pages
116-127
ISBN: 978-989-758-777-1
Proceedings Copyright © 2025 by SCITEPRESS – Science and Technology Publications, Lda.

identify those diseases, what are the symptoms, what
are the preventive measures for that disease, and if a
person has already contracted the disease, how to
keep it in control and prevent further damage to
oneself.
2 LITERATURE SURVEY
The usage of Machine Learning to predict diseases
has brought upon a great deal of improvement in the
healthcare industry, considering today’s really high
patient-to-doctor ratio. Although many previous
papers have discussed upon this topic of developing
and using ML models to predict diseases, many of
them just talked about how the models are trained for
different diseases, and not how a user can access
them. And those papers which did talk about a user
interface like a web application, there seems to be a
lack of usage of better libraries and frameworks to
develop those web applications. This literature survey
reviews existing research on disease prediction using
ML, more specifically focused on diseases like
stroke, diabetes, and student depression.
This section also highlights the gaps in previous
researches and how they can be overcome in this
paper. The method proposed by (K. Gauravet al.,
2023) includes the usage of various algorithms and
models like Random Forest (RF), Support Vector
Machine (SVM), and Long Short-Term Memory
(LSTM), etc. but a particular disease on which these
models were developed and tested on is not discussed.
And this particular paper (K. Gauravet al., 2023) does
not also discuss about how an end-user will be able to
use the model and interact with, for example an
interactive web application. The gaps in this paper (K.
Gauravet al., 2023) can be filled by tailoring models
to particular disease datasets, and developing an
interactive web interface for the ease of user to access
the models.
The second method proposed in the paper by (K.
Reshma et al., 2024) shows a multi-disease prediction
system and it employs the usage of a web application
developed using the streamlit library, allowing the
user to access multiple diseases on the same web
application. The models which have been discussed
in this paper include Support Vector Classifier (SVC),
and Logistic Regression. The diseases for which these
models have been trained are Diabetes (uses the SVC
model), Heart Disease (uses the Logistic Regression
model), and Parkinson’s disease (uses the SVC
model) with accuracies of 79%, 85%, and 89%
respectively. Although the current paper doesn’t
include models for Heart Disease and Parkinson’s
Disease, the model for Diabetes which is discussed in
the paper (K. Reshma et al., 2024) though an
improvement from the previous models made for the
same disease, this still could use some improvement
as its accuracy is just 79%. The method discussed in
the paper by (Sathya Sundaram M. et al., 2022)
developed a model for stroke prediction.
In this paper various models such as Random
Forest, Decision Tree, and Logistic Regression have
been trained and tested upon the stroke dataset and
Decision Tree has been chosen as the final model
which shows an accuracy of 95.5%. Although the
performance of this model is pretty good, the first gap
in this research papers is that the user interface has
been developed using tkinter which may provide a
clean interface, but cannot be deployed and thus does
not allow for people from all over the world to access
it. This can be solved by developing a web application
for the user interface which can be deployed on the
cloud, allowing for a wide range of users from
different parts of the world to access the ML model.
The application discussed in the paper can be further
improved by including multiple models for various
diseases, essentially making it a multi-disease
prediction system.
Just like the paper by K. Gaurav et al., this paper
by Dr. Nitish Das et al. Developed ML models on the
dataset from Kaggle which has 41 diseases as the
target, i.e., the models are trained on the dataset so
that they predict one among the 41 unique possible
diseases in the given dataset. The problem with this
kind of system is that its lack of ease of use by the
user, in the way that it requires the user to enter 132
input values to get a prognosis. And another problem
with the model trained on this dataset would be that
the model outputs any one of the 41 possible target
label, meaning that if a user is absolutely healthy, the
model is likely to falsely show that the user may have
a disease. Although the model is really accurate, it
still is not tailored to predicting one disease (binary
classification). Models trained to predict specific
diseases would have the chance to see and learn from
datasets with a greater number of records, whereas the
model in the paper (
N. Das et al.,2024) was trained on
just over 4,900 records.
The next paper by Kumar Bibhuti B. Singh et al.
(
K. B. B. Singh et al., 2024) discuss a multi-disease
prediction system for the diseases such as Heart
Disease, Parkinson’s Disease, and Diabetes. Multiple
models have been trained upon the datasets for these
diseases. Although Heart Disease and Parkinson’s
disease are out of the scope for this paper, the models
tested to predict Diabetes could use some
improvement as none of the tested models reached
Multi-Disease Prediction System Using Machine Learning
117
over 80% accuracy. Plus, the diabetes model does
require the user to visit a doctor or at least a medical
professional to get some of the input features such as
Insulin, etc. and does not let the user to self-diagnose.
The research paper by S. Yadav et al. discussed
models for diseases like Breast Cancer, Asthma,
Brain Cancer, Liver Disease, Heart Disease,
Infection, Diabetes, Kidney Disease, Lung Cancer,
Alzheimer’s, Anemia, Thyroid, Parkinson’s,
Alopecia, Gastric Cancer, and COVID-19. This paper
(
S. Yadav et al., 2022) compiled the work done by
various authors and compared the models developed
by them. It has no mention of how the user interacts
with and accesses the models, for example a web
application. Another paper reviewed is the paper by
F. Sahlan et al. This paper discusses about ML models
for prediction of mental health among university
students.
This paper trained and tested Decision Tree, K-
Nearest Neighbors, and Support Vector Machine for
this purpose. The best performing model in this paper
(
F. Sahlan, 2021) is the Decision Tree model with an
accuracy of 64% and a recall score of 62%. These
scores could be improved by choosing better models.
The final paper reviewed by us is the paper by G.
Sailasya et al. (
Sailasya and G. L. A. Kumari, 2021). In
this paper multiple models have been trained and their
performances have been evaluated on the stroke
prediction dataset. The trained models are Logistic
Regression, Decision Tree Classifier, Random Forest
Classifier, KNN Classifier, Support Vector Classifier,
and Naive Bayes Classifier. Out of these the model
which performs the best is the Naïve Bayes Classifier
with an accuracy of 82% and a recall score of 85.7%.
These scores could use some improvement, and
the model could perform a bit better. A UI has been
made to interact with the model using Flask. Another
improvement which could be made to the applications
made in the aforementioned papers is the addition of
awareness articles about the mentioned diseases in
respective research papers into the applications/user
interfaces, which the user can read and gain useful
knowledge on how to identify the disease, how to
prevent the disease, etc.
3 METHODOLOGY
This study discusses how a system has been built
using ML to predict stroke, depression in students and
diabetes. The methodology explains in detail the steps
taken to design and implement a reliable and user-
friendly system. Various key tools and techniques
were employed to make this possible, and to make
sure that the system delivers accurate and meaningful
results. The stages in the development of this system
are as follows:
3.1 Data Collection
This dataset has 5,110 records and it
has 12 columns namely:
Table 1: Features in the Stroke Prediction Dataset.
S. No. Column Name Descri
p
tion
1. i
d
Uni
q
ue identifie
r
2. gende
r
“Male” or “Female”
3. age Age of the patient
4. hypertension
0 if the patient doesn’t have hypertension, 1 if the patient
has h
yp
ertension
5. heart_disease
0 if the patient doesn’t have heart disease, 1 if the patient
has heart disease
6. ever
_
marrie
d
“No” or “Yes”
7. work_type
“children”, “Govt_job”, “Never_worked”, “Private”, or
“Self-em
p
lo
y
ed”
8. Residence
_
t
yp
e “Rural” or “Urban”
9. av
g_g
lucose
_
level Avera
g
e
g
lucose level in the bloo
d
10.
b
mi Body mass index
11. smoking_status “formerly smoked”, “never smoked”, or “smokes”
12. stroke (target) 1 if the patient had a stroke, 0 if he not
The datasets used in this system to train and test the
predictive Machine Learning models were sourced
from Kaggle. The dataset used for the first disease,
i.e., the stroke prediction dataset (Table 1)
(Fedesoriano, 2021) is sourced from Kaggle and it is
available in a .csv file format. The size of this file is
about 320 KB.
ICRDICCT‘25 2025 - INTERNATIONAL CONFERENCE ON RESEARCH AND DEVELOPMENT IN INFORMATION,
COMMUNICATION, AND COMPUTING TECHNOLOGIES
118
Table 2: Features in the Student Depression Prediction Dataset.
S. No. Column Name Description
1. id Unique identifier
2. Gender “Male” or “Female”
3. Age Age of the student
4. City City of the student
5. Profession Profession
6. Academic Pressure
Rating from 0 through 5 describing how much pressure a
student feels academically (0 being no pressure and 5 being the
hi
g
hest
)
7. Work Pressure
Rating from 0 through 5 describing how much pressure a
student feels work wise (0 being no pressure and 5 being the
highest)
8. CGPA CGPA of a student (Max: 10)
9. Study Satisfaction
Rating from 0 through 5 describing how satisfied a student
feels study wise (14 pt0 being no satisfaction and 5 being the
hi
g
hest
)
10. Job Satisfaction
Rating from 0 through 5 describing how satisfied a student
feels job wise (0 being no satisfaction and 5 being the highest)
11. Sleep Duration Less than 5 hours, 5-6 hours, 7-8 hours, or More than 8 hours
12. Dietary Habits Unhealthy, Moderate, or Healthy
13. Degree The student’s degree
14. Suicidal Thoughts Ever had suicidal thoughts? Yes or No
15. Study Hours How many hours a day a student study for
16. Financial Stress
Rating from 0 through 5 describing how stressed a student feels
financially (0 being no stress and 5 being the highest)
17.
Family History of Mental
Illness
Does the student’s family have any history of mental illness?
Yes or No
18. Depression (target) 1 if the student has depression, 0 if not
The dataset has 4,861 records for those patients who
don’t have stroke (label 0) and 249 records for those
patients who do have stroke (label 1).
The second dataset for predicting student
depression in Table 2, the student depression dataset
is sourced from Kaggle as well and is available in
a .csv file format whose size is 1.7 MB and has 27,901
records with 18 columns which are:
Multi-Disease Prediction System Using Machine Learning
119
Table 3: Features in the Diabetes Prediction Dataset.
S. No. Column Name Description
1. gender “Male” or “Female”
2. age Age of the patient
3. hypertension
0 if the patient doesn’t have hypertension, 1 if the
p
atient has h
yp
ertension
4. heart_disease
0 if the patient doesn’t have heart disease, 1 if the
p
atient has heart disease
5. smoking_history “never”, “former”, or “current”
6. bmi Body Mass Index
7. HbA1c_level Hemoglobin A1c level
8. blood_glucose_level Glucose level in the blood
9. diabetes 0 if the patient doesn’t have diabetes, 1 if they do
The third dataset (Table 3) used for this system is to
train and test the diabetes prediction model. This too
is sourced from Kaggle, the Diabetes prediction
dataset. This is a .csv file and its size are 3.8 MB, with
100,000 records and 9 columns namely:
3.2 Data Preprocessing
Several data preprocessing techniques have been
applied on the datasets collected to handle missing
values, for feature encoding, etc. First of all the
dataset is read into a Pandas dataframe using the
pandas.read_csv(“dataset_name.csv”) method and
then the .info() method is applied on the dataframe to
get some useful information about the columns in
the dataset, such as the datatype of the values in the
columns, number of non-null values, etc.
The first dataset to be preprocessed is the stroke
dataset (
Fedesoriano , 2021). First of all, the irrelevant
column which is the “id” column can be dropped from
the dataframe. The second step in this process is
applying feature encoding to all the columns which
have categorical data. This is due to the fact that
machine learning models can only learn from
numerical values. Label encoding can be used as the
feature encoding technique for the columns “gender”,
“ever_married”, “work_type”, “Residence_type”,
and “smoking_status”. This step converts the
categorical data in those columns into numerical data
so that the ML model can learn them. The next step is
to handle missing values in the “bmi” column. This
can be done using the mean imputer of sklearn library.
Now the dataset can be split up into the train set on
which the models will be trained, and the test set on
which the models will be evaluated. This is done in
the ratio of 80% and 20%. After this step, the training
set can be oversampled using SMOTE (Synthetic
Minority Oversampling Technique) to artificially
inflate the 1 class in the target variable. Then feature
scaling can be applied on the features of the both train
and the test datasets. For this, standardization
technique can be used. Now the train set is ready to
train the models.
The second dataset which is the student
depression dataset can be preprocessed in a similar
way as the previous one. Firstly, all the irrelevant
columns which don’t contribute to the prediction can
be dropped, such as “id”, “City”, “Profession”,
“Work Pressure”, and “Job Satisfaction”. Now label
encoding can be applied on the columns “Gender”,
“Sleep Duration”, “Dietary Habits”, “Degree”,
“Suicidal thoughts”, and “Family History of Mental
Illness”. This dataset (
N. Das et al., 2024) has some
missing values in the “Financial Stress” column
which could be handled using mode (most frequent)
imputation. Now the dataset can be split into train and
test datasets in the ratio 80% and 20% respectively.
Finally, the standardization technique can be applied
for feature scaling, and now the train and test sets are
ready to be used.
The final dataset to be preprocessed is the diabetes
dataset. For this, first of all the irrelevant columns are
analyzed and dropped from the dataset, which is the
“HbA1c_level”. The second step is label encoding
which can be applied on the columns “gender”, and
“smoking_history”. This dataset (
M. Mustafa, 2023)
has no missing values out of all 100,000 records so
the step of handling the missing values can be ignored
completely. The dataset can now be split into the train
and the test sets in the ratio of 80% and 20%, and
finally those two sets can be standardized to bring the
values of all the features on to the same scale, which
is a normal distribution with a mean 0 and a standard
deviation of 1. The train set can be used to train the
models, and test set can be used to evaluate their
performance.
ICRDICCT‘25 2025 - INTERNATIONAL CONFERENCE ON RESEARCH AND DEVELOPMENT IN INFORMATION,
COMMUNICATION, AND COMPUTING TECHNOLOGIES
120
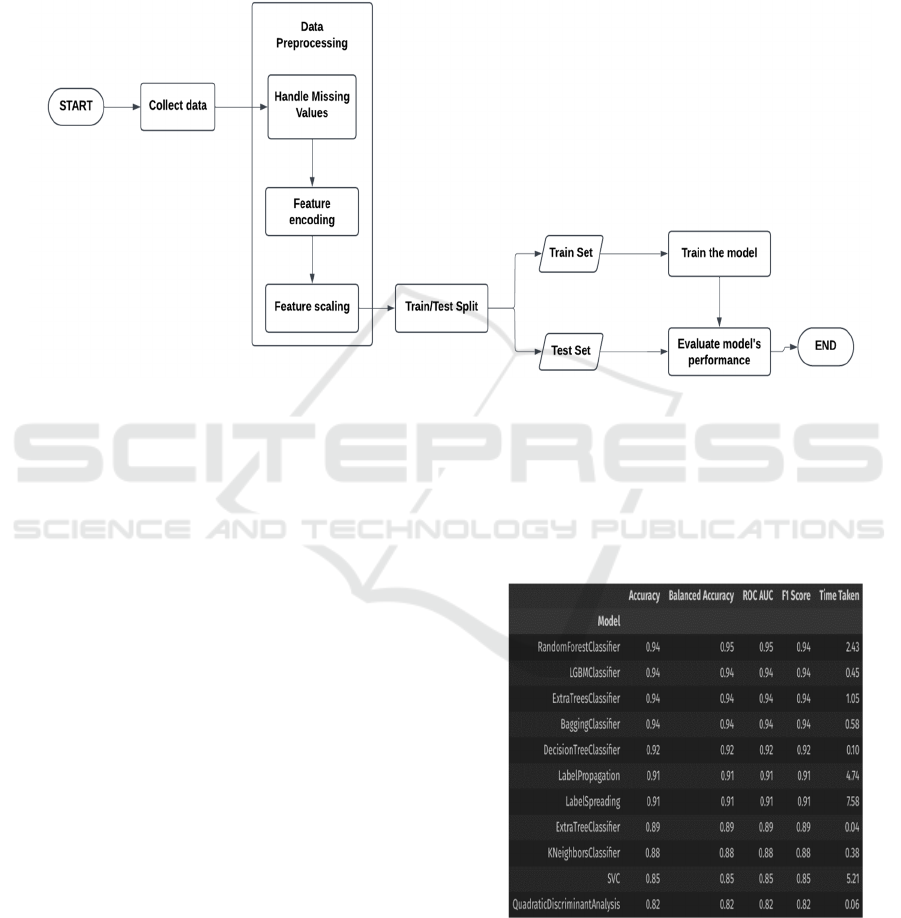
3.3 Training the Models
The second stage in developing this system after the
data has been preprocessed is training multiple
machine learning models on the preprocessed training
datasets, and evaluate their performance scores
(mainly recall, as the models being made by us are
disease prediction models, and it would be really
useful if the recall scores of the models are high, thus
reducing the number of false negatives, i.e. Type-II
errors made by the models), and among the multiple
trained models, the best performing one is chosen as
the final model for the prediction of that particular
disease.
Figure 1: Process Showing the Steps to Train and Test an ML Model.
The usage of the “lazypredict” library has been
employed to train multiple models on a training
dataset and get their performance scores (Figure 2) in
a nice table representation. First of all the
LazyClassifier class is to be imported from the
lazypredict.Supervised module. Then an instance of
that LazyClassifier class is created, say “clf”. After
this, the preprocessed train and test sets are passed
into the clf.fit() method which returns “models” and
“predictions”. On outputting the “models”, it shows
various models used by the LazyClassifier and their
performance scores. From this table of models, the
models which seem to perform good are selected for
that particular disease prediction, their
hyperparameters are tuned to get them to spit out even
better recall scores. This same step is followed for all
the diseases to get an idea of which models would
perform good on that particular disease and choose
those models to further try to improve their
performance, and then those tuned models are further
tested for their performance scores again, and finally
the best one among those is chosen for that particular
disease prediction, and that model would be ready to
be consumed in the web application. Figure 1 shows
the Process showing the steps to train and test an ML
model.
For the stroke prediction task, first of all the
LazyClassifier is applied on the train and test sets
which were obtained from the previous data
preprocessing step. From this, it was known that the
Random Forest Classifier, LGBM (Light Gradient
Boost Machine) Classifier, Gradient Boost Classifier,
and the Extra Trees Classifier models seemed to show
promising results.
Figure 2: Some of the Models Used by Lazy Classifier on
the Stroke Prediction Train Set.
So, these models were picked from the plethora of
models shown by LazyClassifier. Now these models
are trained again on the train set for stroke prediction
Multi-Disease Prediction System Using Machine Learning
121
which contained random 80% records from the
original raw dataset, and a point to be noted is that
this train set is already preprocessed, meaning that all
the missing values have been handled, categorical
data has been encoded into numerical values, and all
the features have been standardized (feature scaling).
After training these models on the train set, they are
evaluated for their performance scores against the test
set. These performance scores include Recall and
Accuracy.
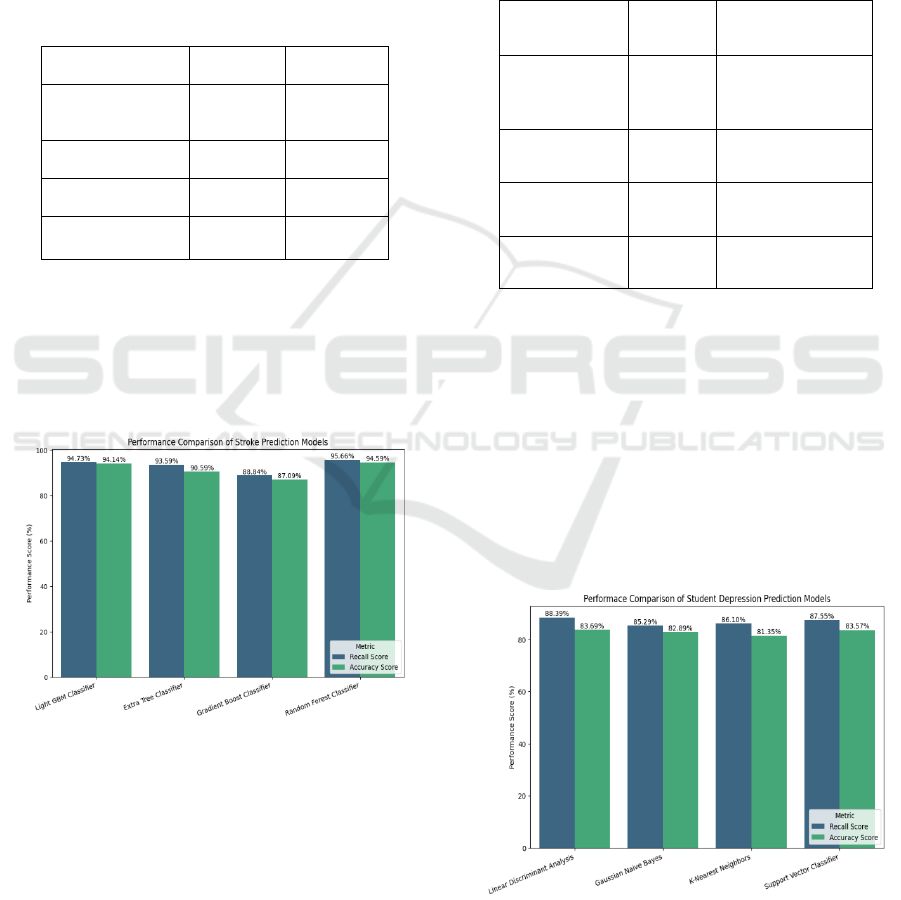
Table 4: Performance Scores of the Models Trained for
Stroke Prediction.
Model
Recall
Score
Accuracy
Score
Light Gradient
Boost Machine
Classifie
r
94.73% 94.14%
Extra Tree
Classifie
r
93.59% 90.59%
Gradient Boost
Classifie
r
88.84% 87.09%
Random Forest
Classifier
95.66% 94.59%
From this the best performing models are the Random
Forest Classifier and the Light Gradient Boost
Machine Classifier. Either one of them can be chosen
as the final model for the stroke prediction task. Table
4 showing the performance scores of the models
trained for stroke prediction.
Figure 3: Stroke Prediction Model’s Performance Compar-
ison.
The second model to be made is for the student
depression prediction task. Similar to the previous
task, to train a model for this task, firstly the
LazyClassifier is applied on to the preprocessed train
and test sets obtained from the data preprocessing
step. The train set for this task has 22,320 random
records from the original dataset which is about 80%
of it, and then the models are tested against 5,581
random records from the test set which are the rest
20% of the original dataset. Out of all the models
available, and trained and tested by the
LazyClassifier, only four seemed to show some good
performance scores, which are Linear Discriminant
Analysis (LDA) Classifier, Gaussian Naive Bayes
(NB) Classifier, K-Nearest Neighbors (KNN)
Classifier, and Support Vector Classifier (SVC).
Table 5: Performance Scores of The Models Trained for
Student Depression Prediction.
Model Recall
Score
Accuracy Score
Linear
Discriminant
Analysis
88.39% 83.69%
Gaussian Naive
Bayes
85.29% 82.89%
K-Nearest
Neighbors
86.10% 81.35%
Support Vector
Classifie
r
87.55% 83.57%
From these scores, it is apparent that the Linear
Discriminant Analysis Classifier, and the Support
Vector Classifier perform the best among all the
tested models with similar scores, so either one can
be used for the prediction of student depression.
Figure 3 shows the Stroke prediction model’s
performance comparison. Figure 4 shows the Student
depression prediction model’s performance
comparison
. Table 5 showing the performance scores
of the models trained for student depression
prediction.
Figure 4: Student Depression Prediction Model’s Perfor-
mance Comparison.
ICRDICCT‘25 2025 - INTERNATIONAL CONFERENCE ON RESEARCH AND DEVELOPMENT IN INFORMATION,
COMMUNICATION, AND COMPUTING TECHNOLOGIES
122
The final prediction model to be developed for this
system is the diabetes prediction. A similar process is
followed to develop a model for this too as the
previous two models. The LazyClassifier is applied
on to the diabetes prediction train set and test set. The
train set for this task has 80,000 records (80% of the
original raw dataset) and the test set for this task has
20,000 records (20% of the original raw dataset).
From the different models trained and tested by the
LazyClassifier, only the Random Forest Classifier
seemed to show some promising and somewhat
accurate results with moderate performance scores.
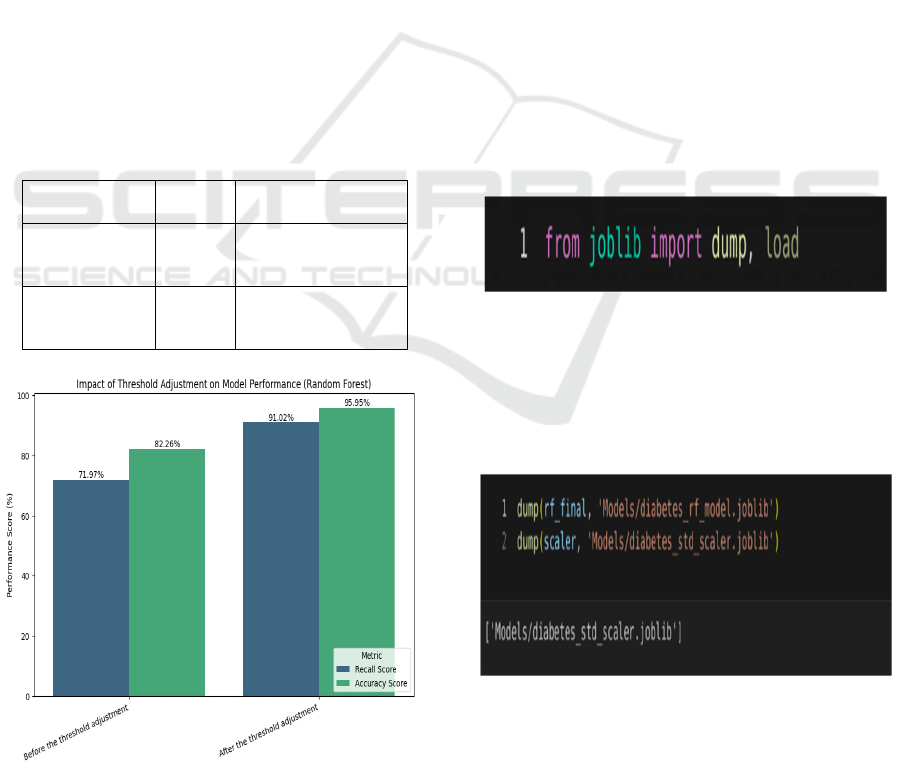
The recall score of this model has been further
brought up by lowering the prediction threshold for
the positive label (1) to 0.2. This means that if the
prediction probability for the class 1 is anything
greater than or equal to 0.2, the model outputs a
positive label prediction. Usually by default this
threshold would be set to 0.5 meaning that the
probability has to be greater than or equal to 50% for
the model to spit out a positive label prediction.
Figure 5 shows the Diabetes Model Performance
before and after threshold adjustment
Table 6: Significance of Threshold Adjustment for the Dia-
betes Prediction Model.
Recall
Score
Accuracy Score
Before the
threshold
ad
j
ustment
71.97% 82.26%
After the
threshold
adjustment
91.02% 95.95%
Figure 5: Diabetes Model Performance Before and After
Threshold Adjustment.
This model along with the previous two models are
ready to be saved, so that their performance scores
can be fixed, and after that they would be ready to be
integrated into the web application and used to make
predictions.
Table 6 shows the Significance of
Threshold Adjustment for The Diabetes Prediction
Model.
3.4 Saving the Models
The models which have been trained successfully can
now be saved into. joblib files using the “joblib”
library in Python. Saving models using “joblib” is
much faster and more efficient than using the “pickle”
library to save models into a .pkl file format. The.
joblib file is a serialized file format and is used to save
and load Python objects. This saving process can be
done using the joblib.dump(“filename.joblib”)
method and what it does is it essentially saves the
trained models (instances of their respective classes)
into a .joblib file. Each model and standard scaler can
be saved into different. joblib files.
These. joblib files can be loaded wherever we
want using the joblib.load(“filename.joblib”)
method, and the models and the standard scalers for
each model can be accessed.
Figure 6: Joblib Import Methods.
An example process of loading and saving the models
is shown following figures 6,7,8:
First import the methods from the joblib
library:Then save the models and the scalers with a
desired file name and into a desired directory:
Figure 7: Joblib Model Saving Example.
Now the saved models can be loaded and consumed
wherever needed.
Multi-Disease Prediction System Using Machine Learning
123
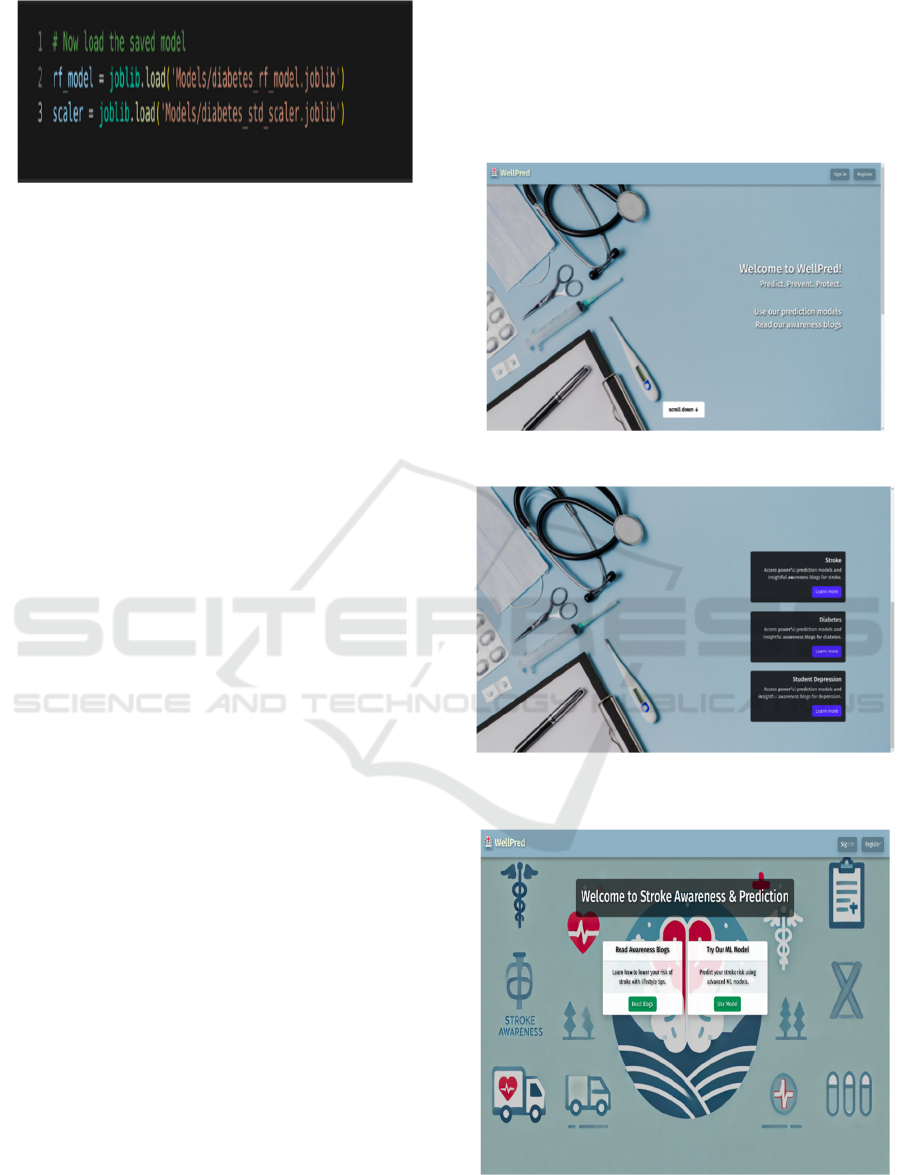
Figure 8: Joblib Model Loading Example.
3.5 Developing a User Interface
Now that the models for the three diseases, namely
stroke, diabetes, and student depression have been
successfully trained with good performance scores,
and have been saved into. joblib files, they’re ready
to be loaded in a user interface and ready to make
predictions by taking input from the user. This user
interface can be a web application with the following
components:
i. Backend
ii. Frontend
iii. Database
The backend of a web application is the part of the
application which handles all the logic, data
processing, and communication between the frontend
and the database or the server. This specific
application is developed in Django using Python as
the backend language. Django is a high-level Python
web framework that encourages rapid development
and clean, pragmatic design. It is widely used to build
secure and scalable web applications. The urls.py file
in the Django project maps URLs to specific views.
Some of the URLs in this project are “/login”,
“/register”, “/stroke/”, “/diabetes/predict”, etc. The
views.py file handles the business logic of requests
and prepares responses. This logic can be written in
the form of functions. This is also the file where the
trained ML models are consumed, input is taken from
the frontend with the help of HTML forms, the code
is run to predict the classification output, and the
output is further sent to some HTML pages.
The second part of this web application is the
frontend. This is the component of the web
application which the user interacts with, so it is
really important to make sure that the interface is
intuitive, easy to use, not cluttered, and as neat and
attractive as possible. This could be made possible by
using clean HTML code. HTML forms can be used to
take the input from the user and pass it on to the
backend where the disease prediction code is run.
CSS can be used to beautify the HTML pages and
make them look visually attractive. JS can also be
used to add any frontend logic, make the website
responsive, etc. Together HTML, CSS, and JS
constitute the frontend of this application, and
provide a clean interface for the user to interact with.
Figure 9 shows the Landing page of the web
application. Figure 10 shows the The user may choose
from the available models and blogs.
Figure 9: Landing Page of the Web Application.
Figure 10: The User May Choose from the Available Mod-
els and Blogs.
Figure 11: Page Showing the Stroke Awareness Blog and
the ML Model.
ICRDICCT‘25 2025 - INTERNATIONAL CONFERENCE ON RESEARCH AND DEVELOPMENT IN INFORMATION,
COMMUNICATION, AND COMPUTING TECHNOLOGIES
124
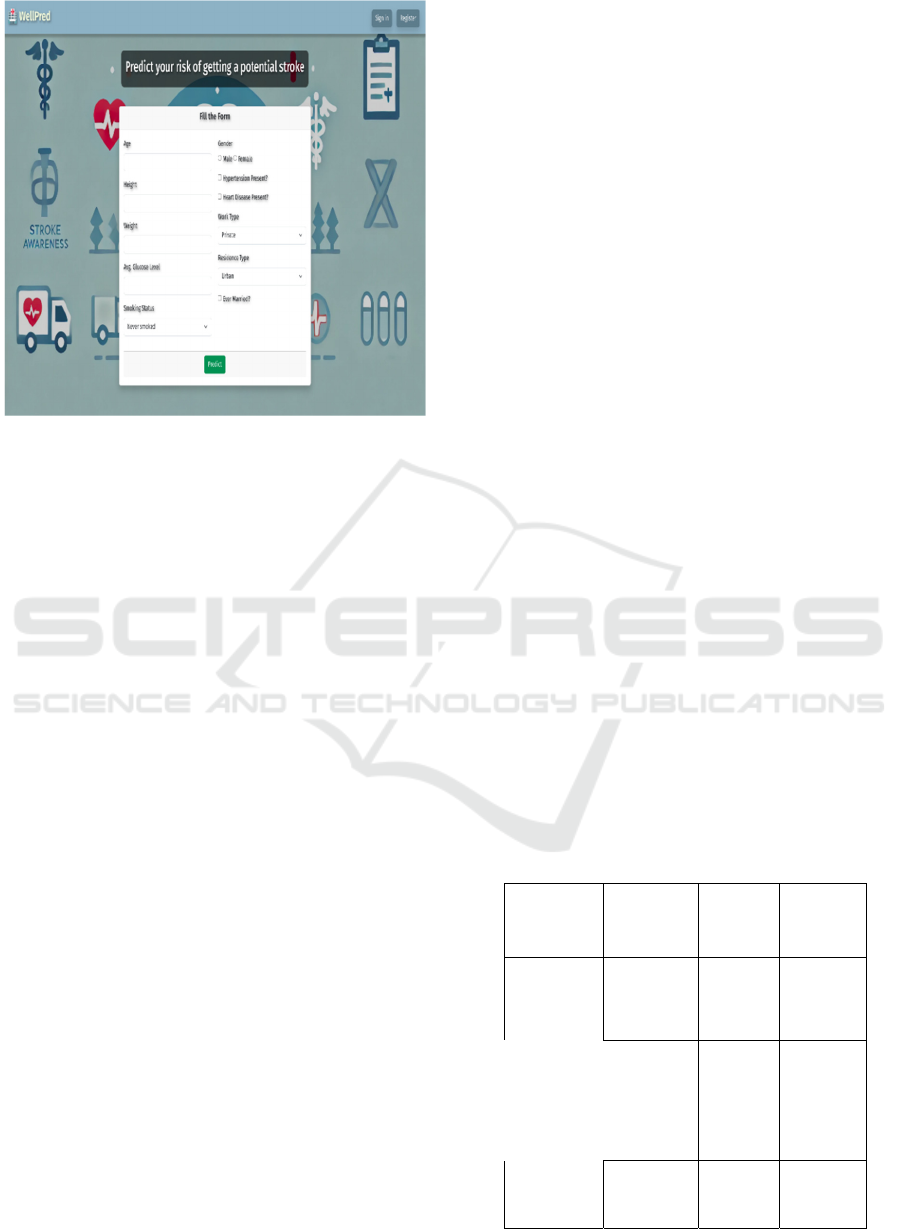
Figure 12: HTML Form to Take the User Input for Stroke
Prediction.
The user may choose any of the 3 available
models, then he will be prompted to another page
where he may choose to read the awareness blog on
that specific disease, or use the predictive model.
The last component of this web application is the
database which stores the user credentials such as
their email ID, password, name, etc. using which they
have registered into the website. The authentication
functionality has been added so that the user is able to
contact the developers via email by filling out another
simple HTML form and when they hit submit, the
user’s message along with the user’s basic details like
their name, and their email ID is sent to the
developers. The database used in this system is a
Django’s built-in SQLite3 database, which is a light-
weight database stored in a file with the “.sqlite3”
extension and it resides in the web application itself,
rather than in a separate dedicated server, optimizing
the query retrieval time. Figure 11 shows the Page
showing the stroke awareness blog and the ML
model. Figure 12 shows the HTML form to take the
user input for stroke prediction.
4 RESULTS
Thus, the models to predict stroke, student
depression, and diabetes have been trained on their
respective datasets and have been integrated with the
web application. This section will provide an
overview of the models chosen for each disease, their
performance scores.
For stroke prediction, Light Gradient Boost
Machine Classifier which is an algorithm based on
gradient boost for classification tasks. It showed a
promising recall score of 94.73% and an accuracy
score of 94.14%. Even the Random Forest Classifier
showed similar results.
To predict the probability of a student getting
depression based on his lifestyle choices, Linear
Discriminant Analysis Classifier has been used which
had a recall score of about 88.39% and an accuracy
score of 83.69%. The next best performing classifier
was the Support Vector Classifier which had recall of
87.55% and accuracy of 83.57%.
The last prediction task for this system is diabetes
prediction, for which the Random Forest Classifier
has been used which, before adjusting the threshold
gave recall and accuracy scores of about 71.97% and
82.26% respectively. After adjusting the threshold,
the recall and accuracy on the test set has been
observed to be increased to 91.02% and 95.95%
respectively.
After the models have been trained and tested to
choose the best one, they have been integrated into
the web application, and can interact with users, take
their inputs and spit out a binary classification output.
The web application also includes useful blogs to
raise awareness about the mentioned diseases.
Figures 13, 14 15 shows the Comparison of
performance scores (Recall and Accuracy) across
various machine learning models for diabetes,
depression, and stroke prediction tasks.
Table 7 shows
the Models used for each disease and their
performance scores. Table 8 shows the Gaps in
previous systems and the improvements in the current
system.
Table 7: Models Used for Each Disease and Their Perfor-
mance Scores.
Task
Model
Used
Recall
Accurac
y
Stroke
Prediction
Light
Gradient
Boost
Machine
94.73% 94.14%
Student
Depres-
sion Pre-
diction
Linear
Discrimin
ant
Analysis
88.39% 83.69%
Diabetes
Prediction
Random
Forest
91.02% 95.95%
Multi-Disease Prediction System Using Machine Learning
125
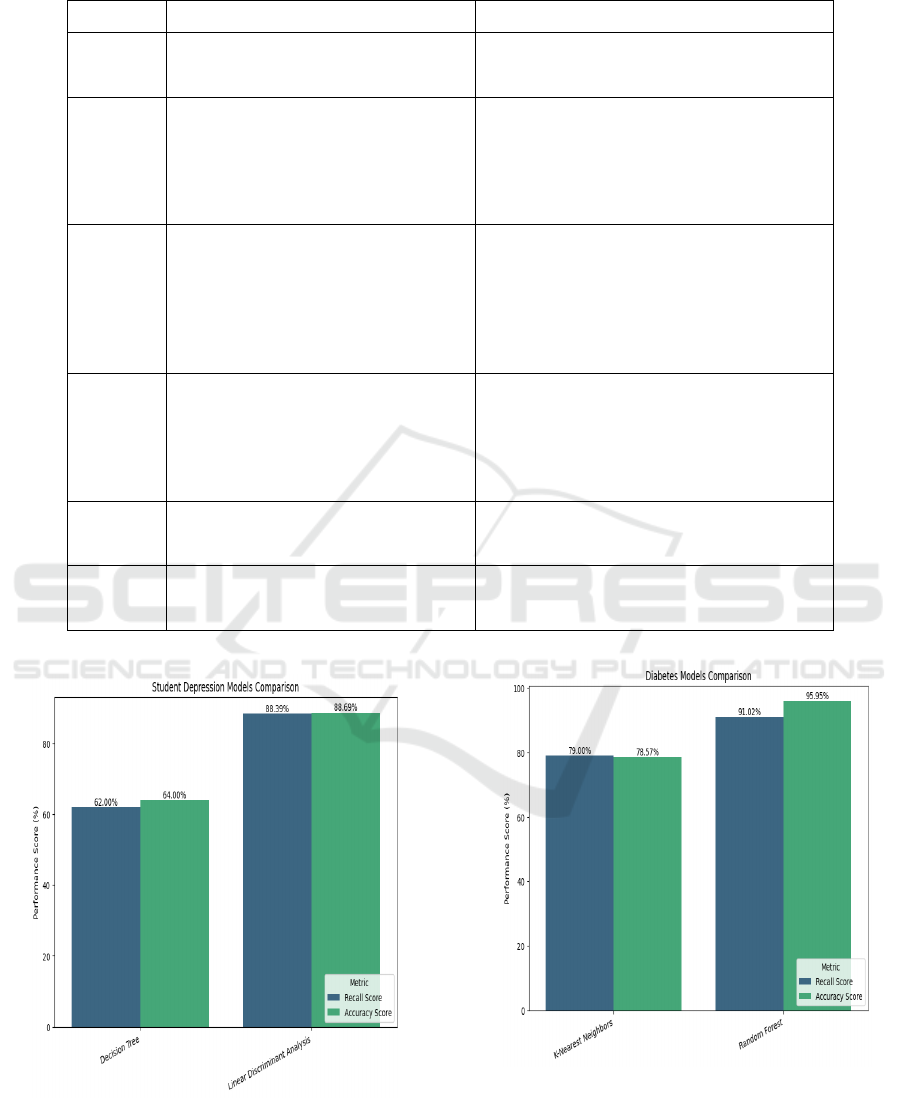
Table 8: Gaps in Previous Systems and the Improvements in the Current System.
Reference Identified Gap Proposed Improvement
K. Gaurav
et al.,
(2023)
• Mentioned nothing about how
the end user will use the
trained models.
• Developed a web application to
allow the users to interact with the
trained models.
K.
Reshma et
al., (2024)
• Diabetes prediction model
gave just 79% accuracy.
• Streamlit is used to develop
the web app which is hard to
customize and less flexible.
• Diabetes prediction model’s
accuracy was improved to be
95.95%.
• Django is used to develop the web
app which allows for better
customization and flexibilit
y
.
Sundaram
et al.,
(2022)
• Not a multi-disease prediction
system, model trained just for
stroke prediction.
• Tkinter is used to make a user
interface whose drawback is
that it can’t be deployed on
the cloud if needed.
• Multi-disease prediction system with
models for stroke, student depression
and diabetes.
• Django is used to make a user
interface which can be deployed on
the cloud if needed.
N. Das et
al., (2024)
• General disease prediction
system, not tailored to predict
specific diseases.
• Model expects 132 input
features.
• Multi-disease prediction system with
separate models trained for each
disease.
• No. of inputs expected vary by the
model, but no model expects more
than 15 features.
K. B. B.
Singh et
al., (2024)
• Best performing diabetes
model had an accuracy of
78.57%.
• Best performing diabetes model had
an accuracy of 95.95%.
S. Yadav
et al.,
(2022)
• No mention of how the user
interacts with the models.
• A user interface with Django has
been made for the user to interact
with the models.
Figure 13: Comparison of Performance Scores of Diabetes
Prediction Models.
Figure 14: Comparison of Performance Scores of Depres-
sion Prediction Models.
ICRDICCT‘25 2025 - INTERNATIONAL CONFERENCE ON RESEARCH AND DEVELOPMENT IN INFORMATION,
COMMUNICATION, AND COMPUTING TECHNOLOGIES
126
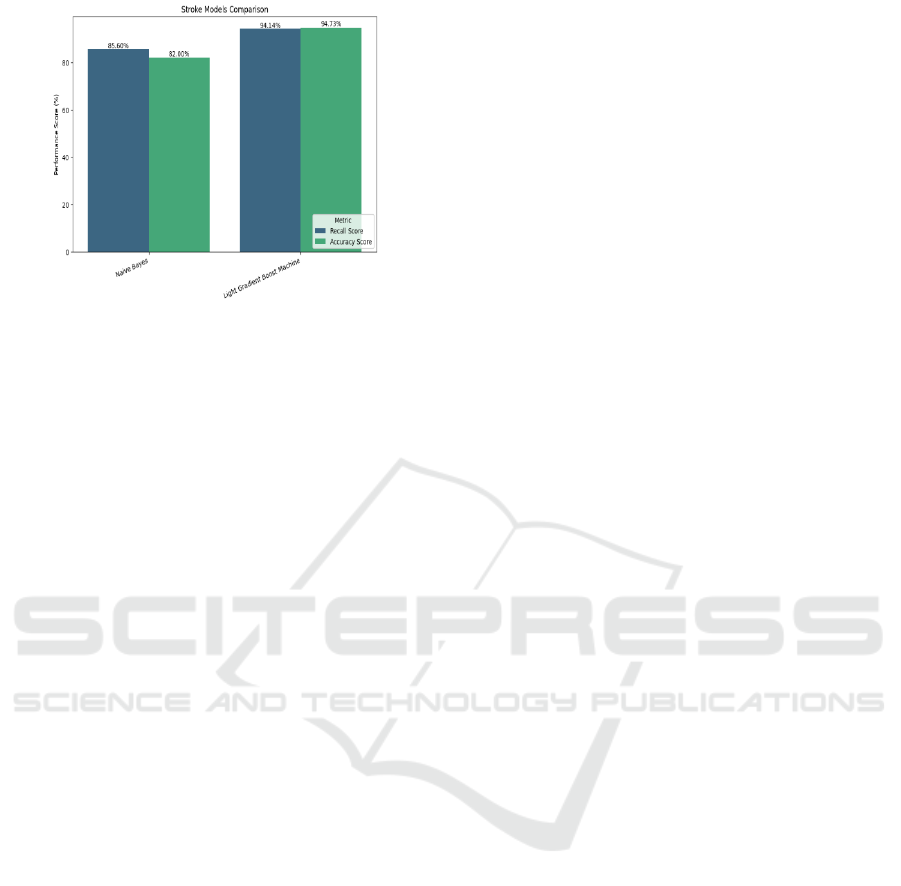
Figure 15: Comparison of Performance Scores of Stroke
Prediction Models.
5 CONCLUSIONS
In this paper, a multi-disease prediction system has
been proposed which is designed to provide efficient
and accurate predictions for multiple health
conditions, including stroke, student depression, and
diabetes. By leveraging machine learning models
tailored for each disease, our system addresses critical
challenges in early diagnosis and intervention. This
system integrates the Light Gradient Boost Machine
Classifier for stroke prediction, Linear Discriminant
Analysis for predicting student depression, Random
Forest Classifier for diabetes prediction, offering a
one-stop solution for the prediction of multiple
diseases under a single platform. This system also
provides the users with useful and informational
awareness blogs on the mentioned diseases.
This system is implemented as a Django-based
web application, enabling accessibility, user-friendly
interaction, and real-time predictions. By combining
these different models under a single platform, our
approach enhances the usability and convenience for
end-users. This system even has the potential to
include more models to predict more diseases,
making it really useful for everybody.
This research brings together advanced machine
learning methods and a simple, easy-to-use web
application to create a system that can predict
multiple diseases. It helps users get quick and
accurate predictions for multiple conditions. By
making these tools accessible to everyone, the system
makes it easier to detect health problems early and act
in time, leading to better health for more people. This
work lays the groundwork for improving healthcare
diagnostics and could make a big difference in how
we approach health care for diverse communities.
REFERENCES
F. Sahlan, F. Hamidi, M. Z. Misrat, M. H. Adli, S. Wani,
and Y. Gulzar, “Prediction of Mental Health Among
University Students,” Int. J. Percept. Cogn. Comput.
(IJPCC), vol. 7, no. 1, 2021.
Fedesoriano, “Stroke Prediction Dataset”, Kaggle, 2021.
[Online].Available:https://www.kaggle.com/da-
tasets/fedesoriano/stroke-prediction-dataset.
K. Gaurav, A. Kumar, P. Singh, A. Kumari, M. Kasar, and
T. Suryawanshi, "Human Disease Prediction using Ma-
chine Learning Techniques and Real-life Para- me-
ters, “International Journal of Engineering (IJE),
vol.36, no.6, 2023.doi:10.5829/ije.2023.36.06c.07.
K. Reshma, P. Niharika, J. Haneesha, K. Rajavardhan, and
S. Swaroop, “Multi-Disease Prediction System Using
Machine Learning,” International Research Journal of
Modernization in Engineering, Technology and Sci-
ence,vol.6,no.2,Feb.2024.DOI:https://doi.org/10.5672
6/IRJMETS49550.
K. B. B. Singh, A. Sharma, A. Verma, R. Maurya, and Y.
Perwej, “Machine Learning for the Multiple Disease
Prediction System,” International Journal of Scientific
Research in Computer Science, Engineering and Infor-
mation Technology (IJSRCSEIT), vol. 10, no. 3,
MayJune2024.DOI:https://doi.org/10.32628/CSEIT24
103217.
M. Mustafa, “Diabetes prediction dataset”, Kaggle, 2023
(lastupdated).[Online].Availa-
ble:https://www.kaggle.com/datasets/iammustafatz/di-
abetes-prediction-dataset.
N. Das, S. Gayke, N. Patel, and S. Shinde, “Disease Predic-
tion Using Machine Learning,” International Journal of
Innovative Research in Science, Engineering and Tech-
nology (IJIRSET), vol. 13, no. 3, Mar. 2024. DOI:
10.15680/IJIRSET.2024.1303276.
S. Yadav, H. Sehrawat, Y. Singh, and V. Jaglan, “Machine
Learning Approaches for Disease Prediction: A Re-
view,” in 2022 IEEE World Conference on Applied In-
telligence and Computing (AIC), Rohtak, India, 2022,
DOI: 10.1109/AIC55036.2022.9848838.
S. Opeyemi, "Student Depression Dataset," Kaggle, 2024
(lastupdated).[Online].Availa-
ble:https://www.kaggle.com/datasets/hopesb/student-
depression-dataset.
Sailasya and G. L. A. Kumari, “Analyzing the Performance
of Stroke Prediction using ML Classification Algo-
rithms,” Int. J. Adv. Comput. Sci. Appl. (IJACSA), vol.
12, no. 6, 2021.
Sundaram, S. M., Pavithra, K., Poojasree, V., Pri-
yadharshini, S., "Stroke Prediction Using Machine
Learning," International Advanced Research Journal in
Science, Engineering and Technology, vol. 9, no. 6,
Jun. 2022. DOI: 10.17148/IARJSET.2022.9620.
Multi-Disease Prediction System Using Machine Learning
127
