
NOCL Based Automatic Leaf Disease Detection with High Accuracy
Sindhuja V, Latha B, Dhanushiya S, Dharani A C, Swetha D and Udhika V
Department of ECE, K.S.R. College of Engineering, Tiruchengode, Namakkal, Tamil Nadu, India
Keywords: NOCL, Plant Leaf Disease, Neural Optimization, Classification, Crop Disease, Convolutional Neural
Network, CNN.
Abstract: Aim: The study introduces the Neural Optimization and Classification Logic (NOCL) method, a new deep
learning method to directly diagnose plant leaf diseases, which aims to reduce the mortality rate of plants
and improve agricultural productivity, as well as promote sustainable agriculture. Materials and Methods:
The proposed Neural Optimization and Classification Logic (NOCL) model was implemented using Python
and TensorFlow designs and tested on a dataset with diseases and healthy leaves. Group 1 refers to the
NOCL method that integrates advanced optimization techniques and classification logic with 1000 testing
counts. Group 2 refers to the traditional CNN method. The NOCL-based architecture shows direct detection
capability, providing a 25% improvement in classification accuracy and a 35% reduction in computational
complexity, compared to the CNN method. Result: The proposed method uses the Ka15e leaf disease
dataset, which contains a total of 78,456 images, which includes 75% as training data and 25% testing data.
The NOCL method achieves 96% of accuracy, F1 score and recall and performs better than traditional
methods. It classifies healthy and diseased specimens by examining signs such as black dots, mosaics also
greenish ventral patterns on the leaves. For comparison, the CNN model with 7 convolution layers was
used, which showed an accuracy of 90.26% to 92.16% whereas, F1 score and recall less than the proposed
method. The NOCL model is implemented through the Python language and is efficient in training and
validation with a significance of p < 0.05. Conclusion: The recommended NOCL based strategy provides
an efficient and reliable method for detection of plant diseases, which enables farmers to take measures for
early control of diseases and ensure sustainable agriculture through robust crop production practices.
1 INTRODUCTION
Neural optimization and classification logic is one of
the methods of transfer learning. One of India's main
sources of income is agriculture, and the amount of
it produced has a significant influence on the entire
nation. However, pests, fungi, and disease factors
are being introduced, and the effects of climate
change are having a growing impact on crops
(Hassan, Sk Mahmudul, 2021). In this context, early
detection and prevention of crop leaf diseases
becomes essential as it helps in preventing economic
losses and reduction in production. Although the
current method, the Convolutional Neural Network
(CNN) method, is capable of detecting leaf diseases,
it has some limitations, especially computational
crises and identity defects (Tugrul, 2022.). Thus, a
new deep learning system Neural Optimization and
Classification Logic (NOCL) has been introduced
with an aim to improve crop health. The NOCL
system can provide an elegant prognosis of diseases
(Alzubaidi, 2023). Also, recommended fertilizer and
preventive practices help reduce diseases and
improves quality of crops. It includes the importance
of agriculture and provides solutions for sustainable
agriculture (Krichen, 2023).
2 RELATED WORKS
Various fields have tracked down applications for
artificial intelligence, including medical services,
correspondence, object ID, and following. The
world's most significant yield, maize, is powerless to
various ailments that diminish both result and
quality. In this review, we presume that the proposed
model gives 90.2% of accuracy. As to
(Responsiveness) assessment, MobileNetV2
38
V, S., B, L., S, D., A C, D., D, S. and V, U.
NOCL Based Automatic Leaf Disease Detection with High Accuracy.
DOI: 10.5220/0013876400004919
Paper published under CC license (CC BY-NC-ND 4.0)
In Proceedings of the 1st International Conference on Research and Development in Information, Communication, and Computing Technologies (ICRDICCT‘25 2025) - Volume 2, pages
38-44
ISBN: 978-989-758-777-1
Proceedings Copyright © 2025 by SCITEPRESS – Science and Technology Publications, Lda.
displayed fruitful execution in Earthy colored Spots,
Blended, White Scale (Zhang, et al., 2022.). PSO
strategy utilized for tweaking technique Thangaraj,
Rajasekaran, 2020. This model is the most amazing
models out of the relative multitude of applied
designs in the underlying demonstrating tests using
the informational index created for the order of plant
species. Through trial, different group of models
proposed are ideal geographies in every order. As
per the group model outcomes, each model
effectively breezes through the assessment with an
exactness of 91.60% (Demilie, 2024).
Many techniques have been proposed for plant
sickness identification, and profound learning has
turned into the favoured strategy in view of its
awesome achievement. In this review, U2-Net was
utilized to eliminate the undesirable foundation of an
info picture by choosing multiscale highlights. This
work proposes a cardamom plant sickness location
approach utilizing the EfficientNetV2 model. An
extensive arrangement of trials was done to
determine the presentation of the proposed approach
and contrast it and different models like EfficientNet
and Convolutional Brain Organization (CNN).
Inception design include learning that further develop
the data extravagance, that is particularly useful to
fine-grained highlight learning (Pradhan, 2022). The
NOCL method gets increased exactness compared to
the past convolution and Vi-based models. The
analysis shows dominance on the current models
(Bangari et al., n.d.). In the analyses, both the models
with and without LBP attributes are utilized. The
recommended ANFIS CNN model really does
astoundingly well in the two arrangements of tests.
Barring LBP qualities yields accuracy(0.8953),
recall(0.9045), and F1 score (0.8478)( Nandhini, S.,
and K. Ashokkumar. 2022). In the wake of
consolidating LBP highlights, the proposed model
accomplished F1 scores (above91%), review
(above92%), exactness (above90%), and accuracy
(above91%). Broad correlations with latest
techniques further show the proposed method's
greatness. The outcomes were likewise checked for
unwavering quality and vigour utilizing cross-
approval. Further developed precision and
productivity in true applications are guaranteed by
this procedure, which addresses a significant
forward-moving step in rural sickness identification.
From the above findings, it is concluded that the
accuracy of CNN is less. The prediction rate is a
crucial element to consider while detecting leaf
disease. The focus of this study is to improve the
accuracy using Neural optimization and classification
logic in comparison with Convolutional neural
networks.
3 MATERIALS AND METHODS
This review zeroed in on the assessment of the
precision and computational capacity of the Brain
Streamlining and Order Rationale (NOCL) strategy
in base leaf illness determination contrasted with the
conventional CNN technique (Elhassouny,). The
dataset utilized is taken from Kaggle did in the past
in plant sickness finding. The main characteristics
examined were accuracy of classification,
computational complexity, rate of diagnosis,
processing time and power output. The experimental
setup was designed and implemented using the
Python latest version on the Anaconda navigator GUI.
Group 1 refers to the recommended NOCL-based
translational leaf disease detection method, which
includes areas such as image pre-processing, feature
extraction, and disease classification where 100 to
1000 testing sample counts are taken. This method
was practiced on kal5e datasets that included leaf
images and tested to predict the presence of the
disease with greater accuracy. The NOCL model was
implemented using Python, TensorFlow and Keras
libraries.
Group 2, similarly, refers to the CNN based
method, which is the traditional method that uses
predetermined partial noise elimination and
classification techniques. This method uses
predefined rules and segment-based models for
classification.
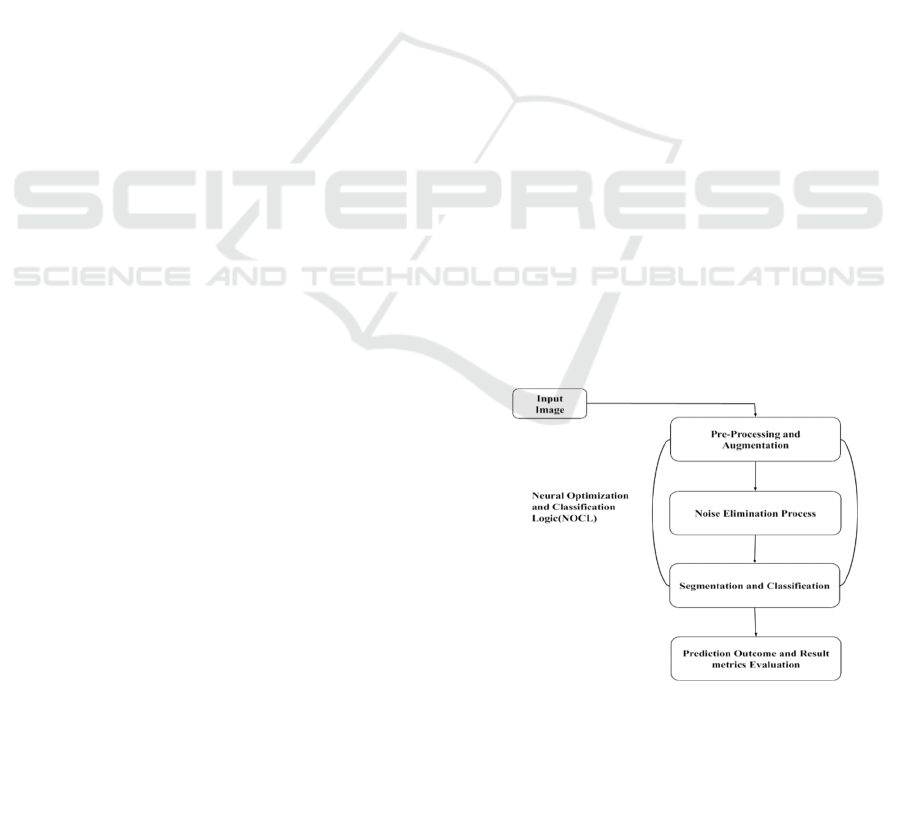
Figure 1: Workflow of Neural optimization and
classification logic system.
Figure 1 shows the data collection for a Plant
Leaf Disease Detection system using NOCL
involves obtaining, preprocessing, and organizing a
NOCL Based Automatic Leaf Disease Detection with High Accuracy
39

dataset suitable for training and testing the NOCL
model. This approach accumulates data from a well-
known opensource data repository called Kaggle.
Before training a NOCL model to identify plant
diseases, data must be pre-processed. Before feeding
the images into the neural network, pre-process them
to make sure they are consistent. Data augmentation,
scaling, and normalizing are some of the methods
that may be used to make the dataset more diverse.
𝑌 =𝑊1𝑅𝑒𝑠𝑖𝑧𝑒(𝑋,(𝐻,𝑊)) +𝑊2(𝑋/255) +𝑊3𝑇(𝑋) (1)
Where:
‘X’ denotes Raw input data ‘Y’ denotes
Preprocessed data
‘H’ denotes the height of the resized image
‘W’ denotes the width of the resized image
‘T’ represents transformations
‘W1’,’W2’,’W3’ Weights representing the
importance or influence of each preprocessing step.
Equation (1) gives the pre-processed data with
the help of input data, weights and transformations.
Ensure that there are a variety of healthy and
diseased plant leaf images in the collection. Get rid
of any low-quality, irrelevant, or duplicate
photographs from the collection. Validate that the
labels or annotations are accurate before using them
for classification. Be certain that all of the images are
the same size so that the NOCL model can use them.
To enhance convergence when training, normalize
the pixel values. Enhance images with modifications
to avoid overfitting and increase generalization.
The dataset contains the three major sections:
training, validation, and testing. For multiclass
classification, use categorical cross-entropy; for
binary situations, use binary cross-entropy. Train the
model through its training process with a set number
of epochs while keeping an eye on parameters like
loss and accuracy. In order to train the model,
Equation (2) gives the epochs by equating with input
data, output from CNN model f, parameterized by θ,
loss function and regulation coefficient.
𝜃𝑡 + 1 = 𝜃𝑡 − 𝜂 ⋅ 𝛻𝜃
1
∑ℓ
(
𝑓
(
𝑋𝑖;𝜃
)
,𝑌𝑖
)
+ 𝜆
(2)
Where:
‘X’ denotes Input data
‘Y’ denotes True labels for input data
‘𝑓(𝑋;𝜃)’ denotes Predicted output from the CNN
model f, parameterized by θ
‘ℓ(⋅)’ denotes Loss function
‘N’ denotes Number of samples in the dataset
‘λ’ denotes Regularization coefficient
‘η’ denotes Learning rate for gradient descent
The assortment of measurements used to assess a
prepared model which incorporates TP, TN, FN, and
FNP decides the model's presentation and the
outcomes it produces. By applying the prepared
model to the testing set, you might decide its
precision in separating among sick and solid leaves.
Assessing the model's presentation might be finished
utilizing measurements, for example, F1 score,
exactness, accuracy, and review.
4 DESCRIPTIVE ANALYSIS
SPSS version 26 is used for the descriptive analysis
based on the statisticaldatas collected. The features
and model outputs of the database are analysed using
TensorFlow and SPSS. Colour information such as
RGB and HSV values, appearance features (contrast,
homogeneity, energy), and shape features (area, edge
shapes) are considered independent variables. At the
same time, variables are considered depending on the
type of disease (for example: healthy, leaf irritation,
powdery mildew) and the level of severity (mild,
moderate, severe). The independent t-test and
statistical measurements were calculated in SPSS and
validated the relationships, while TensorFlow was
used for training and evaluating the model(Shoaib,
Muhammad et. Al., 2023).
Table 1: To analyze the prediction accuracy for 10 testing count across two methods.
Testing
count
CNN (%) NOCL (%)
Accuracy
F1
Score
Recall Accuracy F1 Score Recall
100 91.56 90.00 89.50 96.54 96.00 95.30
200 91.64 90.80 90.00 96.87 96.80 96.20
ICRDICCT‘25 2025 - INTERNATIONAL CONFERENCE ON RESEARCH AND DEVELOPMENT IN INFORMATION,
COMMUNICATION, AND COMPUTING TECHNOLOGIES
40

300 90.35 88.90 88.30 95.89 95.00 94.00
400 92.16 92.00 91.50 96.37 96.00 95.50
500 91.54 90.50 89.80 96.79 96.80 96.00
600 91.59 91.00 90.30 96.49 96.00 95.30
700 90.47 88.80 88.00 96.49 96.00 95.00
800 91.69 90.60 89.90 96.49 96.00 95.50
900 90.26 88.20 87.50 96.49 95.50 94.50
1000 91.79 91.00 90.20 96.49 96.00 95.50
Table 2: Group statistics [n, mean, standard deviation, standard error mean].
N Mean
Std.
Deviation
Std. Error
Mean
CNN
Accurac
y
10 91.305 0.677 0.214
F1 Score 10 90.180 1.193 0.377
Recall 10 89.500 1.216 0.384
NOCL
Accurac
y
10 96.491 0.260 0.082
F1 Score 10 96.010 0.530 0.167
Recall 10 95.280 0.652 0.206
Table 3: An independent sample t-test was conducted to compare the Area (LUT) and Total Power (Watts) values between
the Pre-scaled method and Adaptive method.
Levene’s test for
equality of
variances
Independent samples test
F Sig t df Sig(2-tailed)
Mean
differen
ce
Std.error
difference
95% confidence
interval of the
difference
lower upper
Accura
cy
Equal variance
assume
d
10 0.000 426.255 9 0.000 91.305 0.214 90.82 91.78
Equal variance
not assume
d
0.000 1170.805 9 0.000 96.491 0.082 96.30 96.67
F1
Score
Equal variance
assume
d
10 0.000 238.977 9 0.000 90.180 0.377 89.32 91.03
Equal variance
not assume
d
0.000 572.748 9 0.000 96.010 0.167 95.63 96.38
Recall
Equal variance
assume
d
10 0.000 232.644 9 0.000 89.500 0. 384 88.62 90.37
Equal variance
not assume
d
0.000 461.513 9 0.000 95.280 0.206 94.81 95.74
Statistical experiments carried out by SPSS
confirmed important positive differences between
CNN accuracy and NOCL accuracy when the p-
value is less than 0.05. However, it can be seen in
Table 1 that no standard sigma, variance or fine
differences in t-test results were observed between
the systems. CNN accuracy for 10 test counts ranged
in values from 90.26% to 92.16%, whereas NOCL
accuracy had a high and consistent range from
95.89% to 96.87% (found in Table 1). In the T-test
comparison, CNN had an average accuracy of
91.25% (SD = 0.677) and NOCL had an even higher
accuracy of 96.49% (SD = 0.260) (shown in Table
2). This reveals the quality of NOCL accuracy under
varying test conditions and in Table 3. shows there
is a significant difference between the two groups p
< 0.05.
5 RESULTS
The NOCL framework accomplished a normal
exactness of 96.49% with a SD of 0.260 which is
NOCL Based Automatic Leaf Disease Detection with High Accuracy
41
high compared to the ongoing CNN framework that
has a SD of 0.677. The typical precision of the CNN
framework was just 91.25%. While the test count
varied from 100 to 1000, the NOCL method resulted
in accuracy values ranging from 95.89% to 96.87%,
and demonstrated reliability and consistency with a
low data inaccuracy ratio of 0.092. In contrast, the
CNN method only revealed accuracy values ranging
from 90.26% to 92.16%. These results emphasize
the improved accuracy and consistency of the NOCL
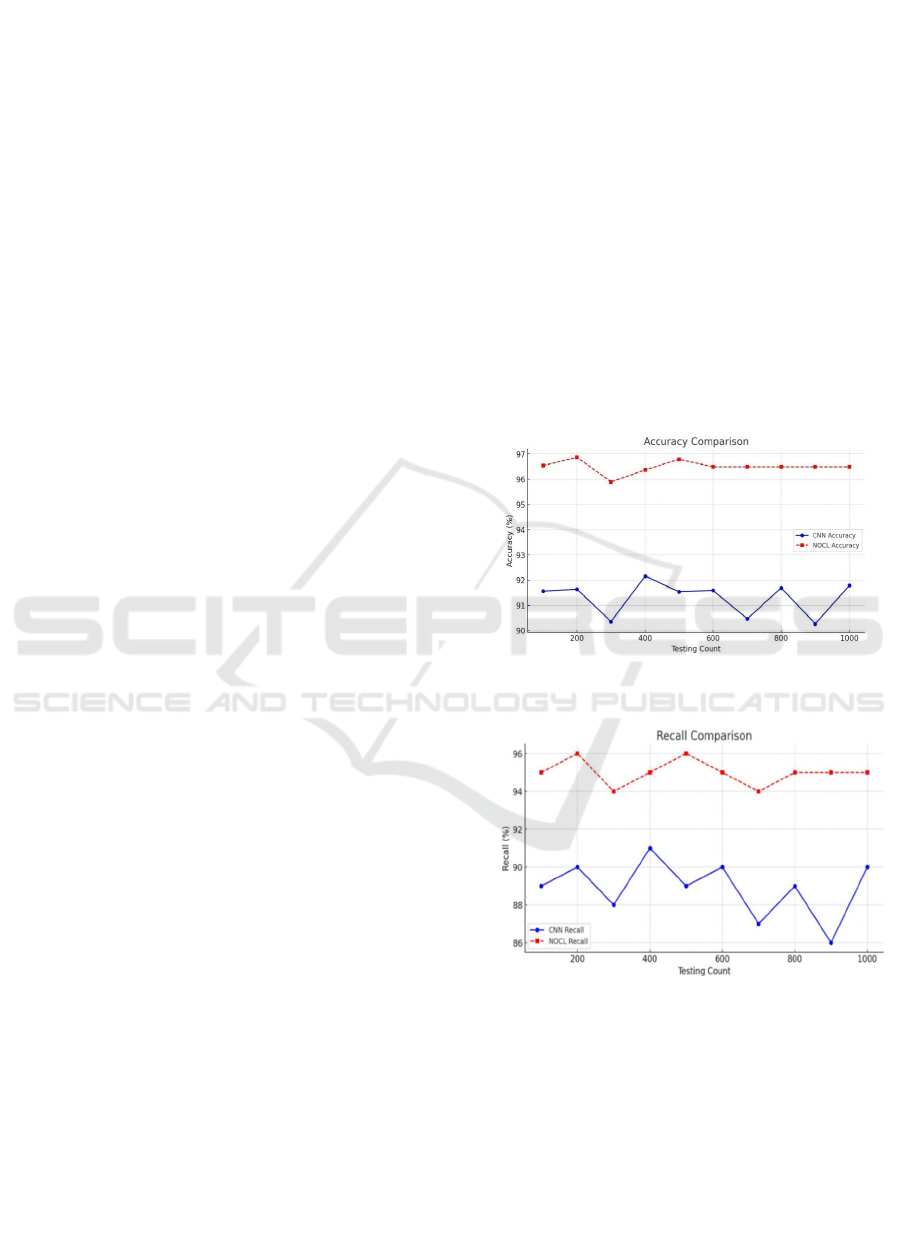
system over the previous CNN system. The plot in
Figure 3 shows the comparison of accuracy of
NOCL and CNN with testing count. CNN has
obtained a sample mean accuracy of 91.25%, which
varies from 90.26% to 92.16%. On the other hand,
the NOCL model has a stable and high specificity
ranging from 96% to 97%. This shows that the
function of the CNN model varies according to the
experiment counts, but the NOCL model works with
great consistency and reliability
Figure 4 shows the F1 Score for the proposed
NOCL technique is 96.08%, with a standard
deviation of 0.530, which is a lot higher than the
current CNN framework's score of 90.58%. CNN
system standard deviation was 1.193. When the test
counts increased from 100 to 1000, the NOCL
model was able to maintain an F1 score from 95.0%
to 96.8%, which indicates a balanced recall and
precision tradeoff. CNN has low classification
stability, achieving an F1 score of only 88.2% to
92.0%. The increased stability and higher overall F1
score demonstrate that NOCL can deliver more
reliable and accurate classifications, which makes it
a better option for the task of leaf disease detection.
The graph in Fig.5 shows the comparison of F1
score of NOCL and CNN with testing count. The
CNN model's F1-score varies from 88% to 92%,
which is consistent with its referral and recall values.
Whereas, the NOCL model has an F1-score of about
96%, which balances the accuracy and recoil
perfectly.
The NOCL model has shown an average recall of
95.23 percent with a standard deviation of 0.652
while outperforming the CNN system, which had an
average recall of 89.87 percent but a higher standard
deviation of 1.216 in Figure 3. From a range of
testing 100 to 1000, Recall for NOCL was
maintained between 94.0 and 96.2, thus maximizing
the efficiency of false negative responses and disease
detection. Contrary to this, the CNN, while
monitoring recall values, reported values from 87.5
to 91.5 which indicate a higher degree of variability
in the detection of diseased leaves. Less deviation
and high recall with true NOCL positive values
increased the model’s practicality in the field of
agriculture, making NOCL more advantageous than
its counterpart. The plot in Fig.4 depicts comparison
of recall of NOCL and CNN with testing count. In
the recall value, the CNN sample varies from 88% to
91%, indicating moderate changes. Instead, the
NOCL sample receives a constant and high recall
value of 94% to 96%. This shows that the NOCL
model is advanced in its ability to correctly identify
true positive types. Figure 2 shows the comparison
of NOCL and CNN accuracy.
CNN has obtained a sample mean accuracy of
91.25%, which varies from 90.26% to 92.16%. On
the other hand, the NOCL model has a stable and
high specificity ranging from 96% to 97%. This
shows that the function of the CNN model varies
according to the experiment counts, but the NOCL
model works with great consistency and reliability.
Figure 2: Comparison of accuracy of NOCL and CNN with
testing count.
Figure 3: Comparison of recall of NOCL and CNN with
testing count.
In the recall value, the CNN sample varies from
88% to 91%, indicating moderate changes. Instead,
the NOCL sample receives a constant and high recall
value of 94% to 96%. This shows that the NOCL
model is advanced in its ability to correctly identify
true positive types.
ICRDICCT‘25 2025 - INTERNATIONAL CONFERENCE ON RESEARCH AND DEVELOPMENT IN INFORMATION,
COMMUNICATION, AND COMPUTING TECHNOLOGIES
42

Figure 4: Comparison of F1 score of NOCL and CNN with
testing count.
The CNN model's F1-score varies from 88% to
92%, which is consistent with its referral and recall
values. Whereas, the NOCL model has an F1-score
of about 96%, which balances the accuracy and recoil
perfectly.
6 DISCUSSION
The proposed NOCL (Neural Optimization and
Classification Logic) method has significantly better
accuracy and recall than the existing CNN method in
the testing count ranges from 100 to 1000 using
sample test. The output obtained here is having a
high gain as compared with previous studies. The
proposed method consists of 78,456 images in a
collection which includes both testing (25%) and
training images (75%) that improve the disease
detection accuracy. The results obtained in the
research are having a high accuracy, F1 score and
recall in comparing with previous studies.
The maximum accuracy obtained for the NOCL
method is 96.49% and for the CNN method is
91.49%. The overall accuracy of 96% is achieved.
The maximum F1 Score obtained for the NOCL is
96.80% and for CNN is 92%. Similarly, the
maximum recall obtained for the NOCL is 91.50%
and for CNN is 96.20%.
A methodology for leaf infection location
utilizing Brain Improvement and Grouping
Rationale is proposed to upgrade the exactness and
decrease the computational intricacy for ongoing
farming applications (Bhattacharjee et. al., 2020).
The results of this method reveal an average
accuracy of 90.06% (with a low data inaccuracy rate
of 0.062), obtained by pre-processing the data group
and using a hyperparameter precision system
(Ahadian, Krisnanda, 2024). The CNN method has
better classification ability and higher accuracy than
traditional methods such as SVM (Support Vector
Machines). The proposed CNN system allows you to
accurately summarize the main features of the
pathology and accurately diagnose various leaf
diseases (Uddin et.al., 2022). It provides more
efficiency with less computational resources. In test
counts from 100 to 500, the CNN method provides
stable and improved accuracy values from 90.89%
to 91.16%, whereas the SVM method reveals data
only from 88.26% to 90.26%. Further, the CNN
method is designed to provide greater public utility
for direct application in field conditions and
precision solutions for agricultural purposes (He
et.al., 2021). This method reveals improved results
in accuracy, robustness, and computational
efficiency over current SVM systems (Savaş and
Serkan. 2024).
The limitations of this method include the
reliance on a fixed dataset for training the proposed
NOCL model, which may impair the technique's
capability to adapt to new or rare leaf diseases.
Acquiring high-quality images would overburden
the computer resources and could lead to increased
latency in performing live operations. However, this
method can be applied on a larger scale for precision
farming owing to its increased accuracy, reduced
error rate, and extension possibilities. This method is
also particularly suited to smart agriculture and can
be used to diagnose issues in different crop types. In
future studies, advanced methods and inventive
ways may be employed in leaf disease detection.
7 CONCLUSIONS
The proposed model NOCL (Neural Optimization
and Classification Logic) for the leaf diseases
identification is proven to be a significant
improvement over the existing method of CNN
(Convolutional Neural Networks). The NOCL
model performed exceptionally well, achieving
superior accuracy with percentages ranging from
95.89% to 96.87% compared to the 90.26% to
92.16% range of the CNN model, whereas F1 score
of NOCL ranging from 95% to 96.8% compared to
the CNN ranging from 88.2% to 92%. Similarly, the
recall percentages of NOCL ranging from 94.50% to
96% compared to the percentages of CNN from
87.5% to 91.5%. The average accuracy achieved
with the CNN method was 91.25%. However, the
NOCL method demonstrated a significantly higher
mean accuracy of 96.49%. Likewise, the average F1
score and recall of NOCL is higher than CNN.
These statistics display greater dependability and
NOCL Based Automatic Leaf Disease Detection with High Accuracy
43

accuracy of the model, hence prove that the NOCL
method is more efficient in classification
performance than the others. These statistics display
greater reliability of the model. NOCL clearly
proves to be superior in disease detection in these
scenarios and emphasizes the practicality of the
technique in agriculture.
REFERENCES
Hassan, Sk Mahmudul, 2021. “Identification of Plant-Leaf
Diseases Using CNN and Transfer-Learning
Approach.” Electronics 10 (12): 1388.
Tugrul, 2022. “Convolutional Neural Networks in
Detection of Plant Leaf Diseases: A Review.”
Agriculture 12 (8): 1192.
Alzubaidi, 2023. “A Survey on Deep Learning Tools
Dealing with Data Scarcity: Definitions, Challenges,
Solutions, Tips, and Applications.” Journal of Big
Data 10 (1): 1–82.
Krichen, 2023. “Convolutional Neural Networks: A
Survey.” Computers 12 (8): 151.
Zhang, Zhao, Paulo Flores, Andrew Friskop, Zhaohui Liu,
C. Igathinathane, X. Han, H. J. Kim, N. Jahan, J.
Mathew, and S. Shreya. 2022. “Enhancing Wheat
Disease Diagnosis in a Greenhouse Using Image Deep
Features and Parallel Feature Fusion.” Frontiers in
Plant Science 13 (March):834447.
Thangaraj, Rajasekaran, 2020. “Automated Tomato Leaf
Disease Classification Using Transfer Learning-Based
Deep Convolution Neural Network.” Journal of Plant
Diseases and Protection 128 (1): 73–86.
Demilie, 2024. “Plant Disease Detection and
Classification Techniques: A Comparative Study of
the Performances.” Journal of Big Data 11 (1): 1–43.
Pradhan, 2022. “Comparison of Various Deep
Convolutional Neural Network Models to Discriminat
e Apple Leaf Diseases Using Transfer Learning.” Jou-
rnal of Plant Diseases and Protection 129 (6): 1461–
73.
Nandhini, S., and K. Ashokkumar. 2022. “An Automatic
Plant Leaf Disease Identification Using DenseNet-121
Architecture with a Mutation-Based Henry Gas
Solubility Optimization Algorithm.” Neural Computin
g and Applications 34 (7): 5513–34. “IJSREM –
International Journal of Scientific Research in
Engineering and Management.” n.d. Accessed
December 29, 2024. www.ijsrem.com.
Elhassouny, Smart Mobile Application to Recognize
Tomato Leaf Diseases Using Convolutional Neural
Networks. Infinite Study.
Shoaib, Muhammad, Babar Shah, Shaker Ei-Sappagh,
Akhtar Ali, Asad Ullah, Fayadh Alenezi,
TsankoGechev, Tariq Hussain, and Farman Ali. 2023.
“Corrigendum: An Advanced Deep Learning Models-
Based Plant Disease Detection: A Review of Recent
Research.” Frontiers in Plant Science 14
(September):1282443.
Bhattacharjee, Arup, Samir Kr Borgohain, Badal Soni,
Gyanendra Verma, and Xiao-Zhi Gao. 2020. Machine
Learning, Image Processing, Network Security and
Data Sciences: Second International Conference,
MIND 2020, Silchar, India, July 30 - 31, 2020,
Proceedings, Part II. Springer Nature.
Ahadian, Krisnanda, 2024. “Maize Disease Classification
Using Transfer Learning and Convolutional Neural
Network with Weighted Loss.” Heliyon 10 (21):
e39569.
Uddin, Mohammad Shorif, and Jagdish Chand Bansal.
2022. Computer Vision and Machine Learning in
Agriculture, Volume 2. Springer Nature.
He, Yong, Pengcheng Nie, Qin Zhang, and Fei Liu. 2021.
Agricultural Internet of Things: Technologies and
Applications.
Springer Nature.
Savaş, Serkan. 2024. “Application of Deep Ensemble
Learning for Palm Disease Detection in Smart
Agriculture.” Heliyon 10 (17): e37141.
Bangari, Sindhuja, “A Survey on Disease Detection of a
Potato Leaf Using CNN.” Accessed December 29,
2024.https://ieeexplore.ieee.org/abstract/document/974
2963.
Shi, Yinghuan, 2018. Machine Learning in Medical
Imaging: 9th International Workshop, MLMI 2018,
Held in Conjunction with MICCAI 2018, Granada,
Spain, September 16, 2018, Proceedings. Springer.
M. Mohana Soundarya, S. Jayachitra, “An Efficient Code
Compression Technique for ECG Signal Application
Using Xilinx Software”, International Journal of
Scientific & Technology Research Volume 8, Issue 09,
September 2019 ISSN 2277-8616
ICRDICCT‘25 2025 - INTERNATIONAL CONFERENCE ON RESEARCH AND DEVELOPMENT IN INFORMATION,
COMMUNICATION, AND COMPUTING TECHNOLOGIES
44
