
An E-Commerce Customer Churn Study with Machine Learning
J. David Sukeerthi Kumar
1
, A. Sindhu
2
, J. Pranavi
2
, D. Vasanthi
2
and N. Harnitha
2
1
Department of Computer Science and Engineering (AI-ML), Santhiram Engineering College,
Nandyal - 518501, Andhra Pradesh, India
2
Department of Computer Science & Design, Santhiram Engineering College, Nandyal - 518501, Andhra Pradesh, India
Keywords: e-Commerce Data, Random Forest, XG Boost and Customer Churn.
Abstract: In the fast-evolving e-commerce environment, customer attrition is now a critical problem for the firm to
maintain long term sustainability and profitability. The present study assumes an opensource e-commerce
database and it tries to develop a robust predictive model of customer attrition. A study was conducted to
determine the performance of various machine learning algorithms, including Random Forest, XG Boost,
Light GBM, and Logistic Regression. SMOTE has been used for balancing the class imbalance and SHAP
and LIME was used for making the models more interpretable. The Random Forest model had a very high
predictability with a remarkable ROC AUC of 0.9850. Such findings can be seen as some of the churn
predictors and proved out to be useful in how e-commerce business can deliberately use such data to reduce
their customer turnover and implement the retaining policies.
1 INTRODUCTION
Research into customer attrition prediction has
expanded significantly because of its usefulness
across different business fields. Recent machine
learning breakthroughs have increased the accuracy
of churn prediction models according to the essay
while simultaneously delivering important benefits to
competitive e-commerce industries. Exploration of
studies proves that businesses gain better revenue and
lower customer loss through the application of data-
based customer retention methods. Through the
implementation of advanced machine learning
technology companies obtain more sophisticated
retention approaches that analyse consumer activities
and provide important insights for better customer
retention success.
2 LITERATURE REVIEW
There are several machine learning models available
to increase the accuracy of customer attrition
predictions. Deep learning models optimize
forecasting precision in unpredictable e-commerce
customer conduct systems (Pondel et al., 2021). The
identification of true churners suffers from incorrect
model functioning because class imbalance
correction stands as a vital consideration according to
studies. Zimal et al. (2023) confirmed that SMOTE
alongside other methods achieves widespread use for
class distribution problems because it improves both
precision and recall measurements in various
applications. The B2B e commerce field implements
support vector machines for churning prediction
following parameter optimization as per research
findings. The newly developed models offer effective
solutions for working with noisy imbalanced data to
yield superior generalization results in these
conditions.
3 DATA AND METHODOLOGY
3.1 Data Description
The data used for this analysis was downloaded from
Kaggle and contains a total of 5,597 records after data
cleaning. It contains several attributes like customer
tenure, preferred device for login, city tier, and
satisfaction scores. The target variable is binary,
representing whether a customer has churned (1) or
not (0). A detailed overview of the important features
used in this research is given in Table 1.
Kumar, J. D. S., Sindhu, A., Pranavi, J., Vasanthi, D. and Harnitha, N.
An E-Commerce Customer Churn Study with Machine Learning.
DOI: 10.5220/0013874900004919
Paper published under CC license (CC BY-NC-ND 4.0)
In Proceedings of the 1st International Conference on Research and Development in Information, Communication, and Computing Technologies (ICRDICCT‘25 2025) - Volume 1, pages
875-879
ISBN: 978-989-758-777-1
Proceedings Copyright © 2025 by SCITEPRESS – Science and Technology Publications, Lda.
875
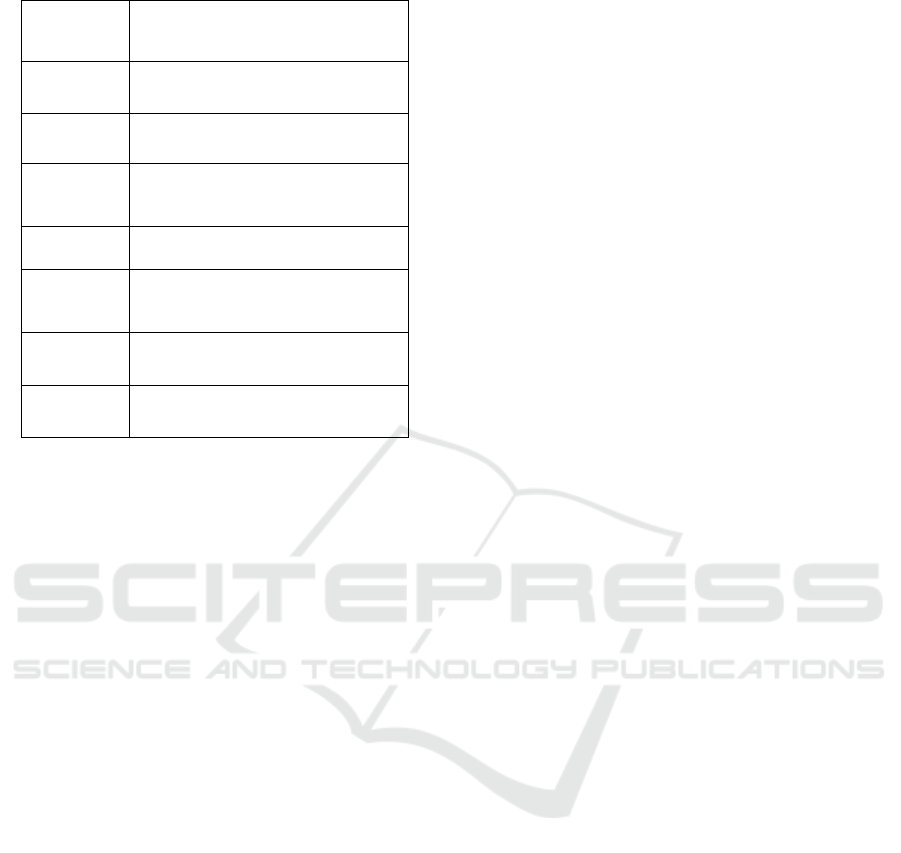
Table 1: Feature Description.
Feature Description
Customer
ID
A unique identifier assigned to
each customer
Tenure
Number of years the customer has
been with the company
Preferred
Login
Device
Device the customer most
frequently uses to log in (e.g.,
mobile, desktop)
City Tier
Customer city classification
according to market region
Ware house
To Home
The distance between the
customer's residence and the
warehouse
Satisfaction
Score
Customer satisfaction rating on a
scale of 1 to 5
Churn
A measure of whether or not the
customer has left (1)
3.2 Data pre-processing
Learning data pre-processing techniques represents
an essential requirement because they protect dataset
consistency while maintaining its quality level. The
imputation of numerical data involved the use of
median values and the mode was selected as the
method to handle categorical missing entries. A total
of 33 extreme records were deleted through fourth
quartile method when conducting outlier detection for
features including Order Amount Hike from Last
Year. The process eliminated data errors to protect the
accuracy of the model output.
3.3 Feature Engineering
To improve the performance of model, a variety of
feature engineering strategies were needed. The first
step involved using one-hot encoding to convert
categorical attributes into numbers because this way
the model handled the data effectively. Additional
interaction terms were implemented to detect hidden
dependencies between model variables which would
not become apparent. Standard Scaling normalization
was applied to all numerical features to standardize
their units and prevent scale-related biases which
would affect their influence on model predictions.
3.4 Data Visualization
In order to further understand how feature
distributions had a relation with the customer churn,
different kinds of visualizations were constructed. It
helped in identifying trends and patterns in the data
through the visual tools. For instance, in this, Figure
2 is an example of distribution of satisfaction scores
of churned versus the ones, which were not churned
to illustrate a better picture about the how important
the importance of customer satisfaction is when it
comes to this behaviour. These visualizations provide
a better intuitive view of how the dataset works and
moves onward to creating more intuitive
visualizations to understand the drivers of churn.
3.5 Class Imbalance Handling
The Synthetic Minority Over-Sampling Technique
(SMOTE) was employed to address the significant
class imbalance in the dataset, where roughly 83% of
the customers did not churn and only 17% did. By
producing synthetic samples for the minority class
(churned consumers), SMOTE effectively increases
its representation and produces a dataset that is more
balanced. In doing so, the method reduces the
possibility of bias within the predictive model process
to ensure that the model provides fairer and more
precise performance (Zimal et al., 2023). This is a
critical step in avoiding the model's over-
representation of the majority class.
4 MODEL DEVELOPMENT
4.1 Model Selection
Many machine learning models had to be evaluated
when developing a binary classification solution for
customer churn prediction. The procedure initiated
model selection with Logistic Regression because it
provided easy readability and structural clarity. The
assessment integrated Assessment Trees together
with Random Forests and XG Boost and Light GBM
models for detecting non-linear patterns established
in the data.
The evaluation process combined Accuracy and
Precision and Recall for mathematical evaluation
along with F1-Score and ROC AUC assessment. The
evaluation surrounded Precision and Recall
measurements along with ROC AUC because these
metrics were essential for finding churned customers
accurately among an unbalanced dataset. Model
builders paid special attention to sensitivity because
they needed the systems to detect customer churn
patterns while working with unbalanced data
distribution.
ICRDICCT‘25 2025 - INTERNATIONAL CONFERENCE ON RESEARCH AND DEVELOPMENT IN INFORMATION,
COMMUNICATION, AND COMPUTING TECHNOLOGIES
876
4.2 Model Performance
The ROC AUC values reached 0.9851 for Random
Forest and XG Boost models delivered 0.9872. XG
Boost achieved slightly superior results compared to
Random Forest with respect to ROC AUC but the
Random Forest model ultimately received selection
for additional development. The model demonstrated
balanced performance alongside built-in stability
features together with better interpretability which
made it a choice for implementation. A
comprehensive hyperparameter tuning process
improved model accuracy through optimal selection
of variables like number of trees and depth together
with minimum number of samples for splitting input
data. Through Grid Search our model achieved its
peak powerful configuration to produce better
performance outcomes with well-defined decisions.
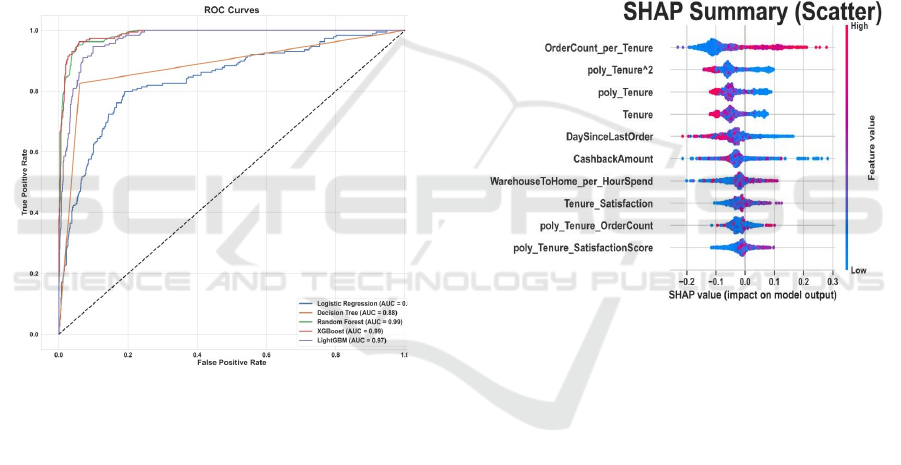
Figure 1: ROC Curves for Various Models.
The ROC curves demonstrate that Random Forest
and XG Boost models exceeded other models by
achieving close to 1 ROC AUC values. The values
approaching 1 in these models demonstrate their
superior discrimination capability in classifying
churned and non-churned customers. These
predictive models offered an optimal balance
between accuracy in detecting both true positives and
negatives to effectively identify customers who
would leave. The models perform well because they
successfully detect hidden patterns which establishes
their accuracy in predicting customer churn. Figure 1
shows ROC Curves for various models.
4.3 Confusion Matrix
As seen in Figure 5, a confusion matrix offers more
performance analysis of the Random Forest model.
The confusion matrix illustrates the relationships
between true negatives and false positives, same with
the true positives and false of negatives. The analysis
shows the model maintains an excellent separation of
customers who churned from those who did not while
misclassifying few cases. The confusion matrix
shows how the model exactly detects churned
customers (true positives) together with a low number
of incorrect predictions for both customer categories.
The model achieves high stability for real-world
implementation because this balanced classification
demonstrates its readiness for business decision-
making processes that require minimal prediction
errors regarding customer churn.
4.4 SHAP and LIME Analysis-Based
Model Interpretation
Figure 2: SHAP Summary Scatter Plot.
The interpretability of Random Forest models
received improvement from the application of SHAP
(Sha pley Additive ex Planations) and LIME (Local
Interpretable Model-agnostic Explanations). The
SHAP values revealed important features that drove
churn prediction and LIME generated explainable
breakdowns of behaviour at the customer level.
Figure 2 shows SHAP summary scatter plot.
SHAP Summary Plot identified that Order Count
per Tenure, poly_Tenure², and Satisfaction Score had
the highest influence on churn predictions. This is
according to business logic, indicating that customers
with low satisfaction and tenures are most likely to
churn, as established by Guoien Xia & Qingzhe He
(2018).
In addition, the SHAP plot also indicated that the
values for the Order Count per Tenure and
Satisfaction Score frontiered the top of contributing
the most to churn predictions. It also showed in the
form of the SHAP Summary Scatter Plot how feature
An E-Commerce Customer Churn Study with Machine Learning
877
values interacted with churn probability. For instance,
adding up the flipped red dots (indicating lower churn
probability) and normalizing based on the Order
Count per Tenure for an instance, results in lower
churn probability; while increasing Days Since Last
Order (bottom axis) amounts to higher churn
probability.
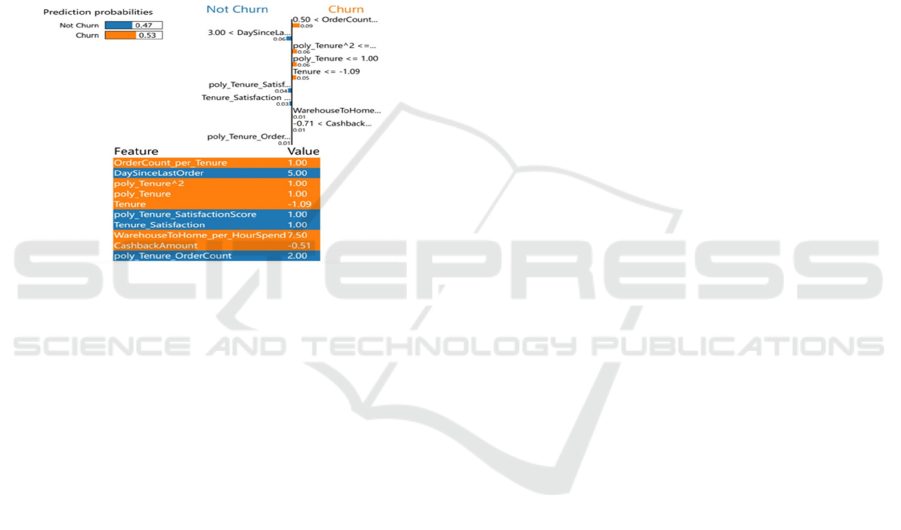
Everyone using LIME analysis saw deeper
insights into how the model chose specific predictions
by breaking down feature contributions on a customer
basis. Through localized explanations the model
gained clarity about which customers would drop out
or stay it helped make Random Forest predictions
more transparent and credible. Figure 3 show LIME
explanation of churn productions.
Figure 3: LIME Explanation of Churn Predictions.
5 CHURN PREDICTION MODEL
The proposed system contains a state-of-the-art machine
learning application that executes accurate customer
churn prediction. The system goes beyond existing
system limitations through its ability to generate precise
forecasting predictions. The system implements
fundamental data processing operations which run
alongside the protocol for model implementation. This
system implements data analysis functions and
deployment monitoring capabilities for business
customer retention followed by instant analyses that
prevent customer attrition.
Key Features:
• Data Processing: The system implements
Pandas together with NumPy to enable
effective data manipulation steps and
cleansing operations. These libraries operate
on big data while conducting quality
assessment on input before model integration.
• Feature Engineering: Feature Engineering
process includes data normalization using
Standard Scaler and Label Encoder variable
transformation to optimize model
performance.
• Visualization: Visualization is done using
Matplotlib and Seaborn so that users can see
and comprehend feature distributions and their
effect on churn prediction.
• Model: The system applies Random Forest
Classifier because of its accuracy and explain
ability with XG Boost as backup model to
achieve better performance.
• Development and Monitoring: The system
runs on Stream lit to deliver both a real-time
interactive prediction interface to users. The
remote storage and retrieval system for the
model utilizes Job lib which ensures easy
deployment and scalability.
Advantages of the Suggested System:
• The Random Forest model ensures precise
prediction outcomes because of its accuracy in
churn prediction.
• The system provides instant real-time
customer insights which allow businesses to
take immediate action against risk customers
thereby strengthening retention.
• The system supports automated data
processing and churn prediction through
automated processes for minimizing manual
intervention. Users can obtain real-time
predictions through the Stream lit interface
which delivers predictions through a simple
user-friendly platform.
• The system provides businesses an efficient
solution to reduce customer attrition and
strengthen their customer retention methods.
6 DISCUSSION & RESULT
The research data proves that machine learning
models represent the essential tools for accurate
customer departure prediction. Organizational teams
create specific retention measures by using primary
customer churn triggers to focus on their risk-based
customer population. The research carried out by
Pondel et al. (2021) demonstrates that prediction
variables consist of Tenure together with Satisfaction
Score and Order Count (Pondel et al., 2021). The
research findings enable the development of
ICRDICCT‘25 2025 - INTERNATIONAL CONFERENCE ON RESEARCH AND DEVELOPMENT IN INFORMATION,
COMMUNICATION, AND COMPUTING TECHNOLOGIES
878

particular retention strategies. The process to reach
out to dissatisfied customers starts while building
loyalty programs becomes feasible through decreased
customer duration. Organizations achieve higher
financial outcomes by proactively working to
improve satisfaction levels and customer engagement
although they decrease customer attrition.
The high-performance levels of XGBoost align
with findings from Gordini & Veglio (2017) using
SVMs and Random Forests which demonstrates its
strong capability in predicting customer churn. All
previous research (Zhang et al., 2023) demonstrates
that XGBoost and Random Forest churn prediction
models remain significant in predictive analytics. The
work rejects Gordini & Veglio's approach by
presenting Random Forest as an acceptable predictive
model that benefits from SHAP interpretation. By
utilizing SHAP the prediction accuracy reaches high
levels and delivers concrete insights derived from
customer behavior. Businesses can use this
understanding to modify their customer service
systems and marketing strategies for addressing
certain reasons triggering customer departures.
7 CONCLUSIONS
The study adds value to existing customer churn
prediction research by showing how machine
learning algorithms at their best can generate high
prediction accuracy. These customer modeling
techniques gain usability through SMOTE for
balancing class distribution together with SHAP and
LIME for improving interpretation capabilities and
find broader utility in e-commerce applications. The
main limitation arising from the study employs a
single Kaggle dataset because this data may not
reflect typical customer interaction patterns across
various e-commerce sites.
Through the utilization of SMOTE to prevent
class imbalance in addition to model interpretation
tools SHAP and LIME organizations can identify the
core causes that lead customers to churn. The
automated model serves organizations as an
organizational tool which helps them implement
retention policies when they choose proactive
measures for customer retention. Such a system
becomes essential for customer retention by
delivering immediate predictions along with
performable recommendations which enhances profit
margins.
The testing of the model on one dataset fails to
capture the complete variety of customer conduct
between different e-commerce platforms. Future
research needs different types of customer data such
as real-time interaction histories and rating data to
enhance churn prediction model stability. RNNs and
LSTM models represent promising prospects for deep
learning-based research as they would generate
substantial insight into sequential customer patterns
to improve these systems' performance.
This new system functions as an optimal
instrument to maintain customers while building
long-term sustained client relationships. Future
research using RNNs or LSTMs deep learning
architectures would introduce appropriate sequential
data control methods. sequential data. The recent
advancements demonstrate excellent potential to
boost customer evolutionary insights and
sophisticated model development work which results
in improved organizational customer retention
optimization.
REFERENCES
David Sukeerthi Kumar, J. M. V. Subramanyam and A. P.
Siva Kumar. "A hybrid spotted hyena and whale
optimization algorithm-based load-balanced clustering
technique in WSNs." Proceedings of International
Conference on Recent Trends in Computing: ICRTC
2022. Singapore: Springer Nature Singapore, 2023.
Kumar, J.D.S, Subramanyam, M.V. & Kumar, A.P.S.
Hybrid Sand Cat Swarm Optimization Algorithm-based
reliable coverage optimization strategy for
heterogeneous wireless sensor networks. Int. j. inf.
tecnol. (2024). https://doi.org/10.1007/s41870-024-
02163-8.
Kumar, Janjarapu & Subramanyam, Makam & Kumar,
Arugudi. (2023). Hybrid Chameleon Search and
Remora Optimization Algorithm‐based Dynamic
Heterogeneous load balancing clustering protocol for
extending the lifetime of wireless sensor networks. Xia
and He (2018): Research paper on predicting customer
churn in online shopping using integrated machine
learning techniques.
Zimal et al. (2023) : "Article discussing the application of
machine learning for predicting customer churn."
Peddarapu et al. (2022): "Conference paper on using
machine learning to predict customer churn."
Gordini and Veglio, (2017): "Study on predicting customer
churn and developing retention strategies for B2B e-
commerce, using support vector machines."So, these
researchers, Pondel and others, they researched how
you might apply those super intelligent computer
algorithms – you know, the ones that learn – like deep
learning – to identify which customers are going to be
the ones who will not shop from an online retailer
anymore.
An E-Commerce Customer Churn Study with Machine Learning
879
