
Estimation of Energy Consumption in Real‑Time EV Sensor Data
through Explainable AI and Machine Learning Algorithm
Sathishkumar S.
1
and Yogesh Rajkumar R.
2
1
Department of Computer Science and Engineering, Bharath Institute of Higher Education and Research, Chennai, Tamil
Nadu, India
2
Department of Information Technology, Bharath Institute of Higher Education and Research, Chennai, Tamil Nadu, India
Keywords: Electric Vehicles, Energy Consumption Prediction, Real‑Time Sensor Data, Explainable AI, SHAP Analysis.
Abstract: Electric Vehicles (EVs) are a wonderful option for sustainability as they are changing the future of
Transportation for the better by ensuring lesser dependency on fossil fuels and a reduced level of emissions.
These enable EVs to collect huge volumes of real-time data on speed, acceleration, battery charge, and
environment, all of which are critical for making energy efficient decisions. The real-time estimation of energy
consumption using machine learning and explainable A.I. (XAI) to accurately interpret sensor data is the
focus of this research. Mercury is the closest planet to sun. Like existing research, which mainly investigated
energy consumption based on classical approaches or simple machine learning models, the current work
utilizes state-of-the-art models, such as Random Forest and Neural Networks, using rich real-world data from
Battery Electric Vehicles (BEVs) running in different driving scenarios. SHapley Additive explanations
(SHAP) method is also used for model interpretability to understand how various parameters impact energy
consumption, e.g., vehicle speed and battery current. This characterization not only facilitates improved
accuracy in the prediction of energy consumption but also greatly aids the identification of determinants
driving overall energy inefficiency during live operational conditions. This proposed approach builds on the
previous work with increased accuracy and adaptability in prediction through XAI that aids in developing
more refined strategies for energy management. In the long run, this study aids in optimizing EV capabilities,
prolonging battery duration, and minimizing range anxiety, all of which are vital for increasing EV adoption
and informing transportation electrification policy in the future.
1 INTRODUCTION
With the rise of Battery Electric Vehicles (BEVs), a
big challenge remains their energy consumption
optimization. A BEV's efficiency is not only reliant
on battery usage and range, but also depends on
several other factors, including climate situations,
driving tendencies, and vehicle load, all of which can
affect battery power. Energy consumption prediction
in real driving conditions is still a challenging task
even with the developments in BEV technology.
Traditional methods used to estimate BEV energy
consumption often involve simplified models based
on a few average conditions (i.e. speed, distance, and
some environmental conditions) (Chaichana et., al.
2023). These models do not address the variability
seen in the real-world driving experience.
Also, as BEVs are driven in dynamic
environments where real-time changes in driving
conditions are not taken into consideration in many
optimization processes, inaccuracies in energy
predictions can result in problems such as range
anxiety, suboptimal battery utilization, etc. Drivers
can end up not with the energy management profile
that is most efficient in their vehicle, or running out
of battery sooner than anticipated. In the case of BEV
makers, inadequate energy estimates lead to poor
battery designs and only marginal enhancements in
energy management systems Khalid, M. (2024).
Hence, the effort is to create an energy
consumption model which is both, rigorous and
absorbs dynamic driving conditions and vehicle
behaviour for better energy estimation. The solution
is in the use of data produced by state-of-the-art
vehicle sensors and machine learning algorithms to
analyze the data, recognize patterns in it, and predict
energy consumption accurately.
S., S. and R., Y. R.
Estimation of Energy Consumption in Real-Time EV Sensor Data through Explainable AI and Machine Learning Algorithm.
DOI: 10.5220/0013872900004919
Paper published under CC license (CC BY-NC-ND 4.0)
In Proceedings of the 1st International Conference on Research and Development in Information, Communication, and Computing Technologies (ICRDICCT‘25 2025) - Volume 1, pages
789-798
ISBN: 978-989-758-777-1
Proceedings Copyright © 2025 by SCITEPRESS – Science and Technology Publications, Lda.
789

Current Scenario.
Typically, BEV energy consumption is estimated
using rule-based methods or physics-based models
Zhang, Q., & Tian, S. (2023) that consider speed, road
gradient and vehicle mass. Although these models
are computationally uncomplicated, they do not
adequately capture real-world dynamics, where
energy consumption is impacted by various elements
like aggressive driving maneuvers (brisk acceleration
or deceleration), traffic congestion, and
environmental conditions like wind resistance and
temperature changes Katongtung et., al. 2022.
As an early stage, electric vehicles (EVs) are a
powerful and growing technology that is rapidly
gaining adoption across the globe. Around one in five
cars sold worldwide last year were electric, with
sales of about 14 million units in 2023. Fuelled by
better battery technologies, longer ranges, and a
global pledge to cut down on carbon emissions, this
spike is hardly an anomaly. Electric vehicles are
already registering in a meaningful way in major
markets such as China, Europe and the United States.
Though we have come a long way, many hurdles
still need to be overcome, such as expanding charging
infrastructure, higher initial costs than ICE vehicles,
and consumer range anxiety. Governments and
business stakeholders are using a range of techniques
and strategies to help solve these problems. For
example, overcomes the problem of the range
anxiety by providing many rapid-charge stations and
Aroua, A., et al. (2024). And policies such as tax
breaks, subsidies and prolonged access to charging
and parking have made EVs cheaper and more
appealing to consumers.
It looks sunny, however, with predictions that
over 50% of the world's car sales may soon be EVs
by 2035. Overcoming these challenges, and
accelerating the transition towards a low carbon
economy, will require continuous innovation,
infrastructure investment and supportive policies.
Data from this research indicate, in energy
consumption BEVs used average of 148.03 Wh/km.
To investigate the reasons behind this trend in energy
usage, we try to implement a comprehensive analysis
using SHapley Additive explanations (SHAP)
method. This analysis provided insight into the
correlation between Speed, battery amps and energy
consumption especially in urban drive. Improving
BEV energy through such insights, developing
transportation electrification rules and thus
promoting electric vehicle penetration. (Gersdorf et.,
al. 2020)
This study aims to develop more accurate and
comprehensive BEV energy consumption prediction
based on machine learning. Published research
involving EV simulations in carried out energy
management research will not only break recent
ground with BEV manufacturers for implementing
enhanced energy management systems, but will also
help make electric vehicles more viable and
convenient for everyday consumers.
2 LITERATURE SURVEY
Machine Learning and Real-time Scheduling Zhou
reviewed the application of machine learning in the
context of energy prediction for electric vehicles
(EVs). Their research highlights the application of
deep reinforcement learning in routing and energy
allocation in urban transportation and demonstrates
substantial efficiency gains achieved. Ayetor (2022)
studied the use of model predictive control (MPC) in
multi-phase electric drives. This method has shown to
be valid as a strategy for controlling complex
variables in an EV powertrain, ensuring high fault
tolerance and low harmonic distortion. The work
demonstrates that MPC may provide improved
dynamic response and robustness for EVs subject to
varying operation conditions.
(Gersdorf et., al. 2020) analyzed thermal
management of batteries, discussing advanced
cooling techniques such as phase-change materials
and liquid cooling. Their work gives an
understanding of how these systems prolong battery
life and regulate temperature ranges, an essential for
the Efficiency of EVs and their safety.
Lundberg, S. M., (2022) generated EV battery
lifecycle scenario of second-life applications and
recycling based on currently available options. They
explored principles of circular economy that
extensively demonstrate how the reuse of EV
batteries for energy storage in renewable applications
increases sustainability.
Donkers, A (2020) has conducted a comparative
review on the advancements of fast charging
technology, focusing on battery chemistry and
charging protocols. Lithium iron phosphate and solid-
state battery chemistries particularly look to provide
pathways to reducing charging time without
impacting safety.
On real-time optimization, Suttakul, P (2022)
developed a previous-generation energy management
strategy (EMS) for hybrid electric vehicles (HEVs) to
optimize the ever-changing demands of power
against fuel economy. Theirs is a model of embedded
ICRDICCT‘25 2025 - INTERNATIONAL CONFERENCE ON RESEARCH AND DEVELOPMENT IN INFORMATION,
COMMUNICATION, AND COMPUTING TECHNOLOGIES
790
model (EMS), which changes based on data
collected from the real world so energy distribution to
the batteries and fuel is enhanced.
Achariyaviriya, W (2023) studied autonomous
EVs in conjunction with smart grids, focusing on
advantages of bi-directional charging. Their work
showed how vehicle-to-grid (V2G) integration
facilitates balance of grid loads and promotes the
uptake of renewable energy. Degen analyzed
multiphase motors, emphasizing their benefits of fault
tolerance and power density in EV powertrains. They
concluded that instead of four-phase architecture,
five- and six-phase machines using sophisticated and
less expensive modulation will dominate future
electric-vehicle design.
Wei, H (2022) conducted a study examining
different designs of in-wheel motors for lightweight
EVs, concluding that such technology improves
torque and braking. The model predicts that cutting
away elements of transmission yields less vehicle
weight and higher energy efficiency.
Pignatta, G (2022) investigated battery
regeneration and observed that battery regeneration
can improve the performance of aging EVs, thus
decreasing the need for new materials and aiding
sustainability. Tan created a new predictive model for
estimating EV range that incorporated, for the first
time, variables such as driver behavior and external
conditions. This study suggests how predictive
models of range can help reduce the range anxiety
that hampers EV uptake. Zhang (2019) conducted a
study on permanent magnet and magnet-less machine
in ev with focus on efficiency and cost... They found
that improvements in material science and
electromagnetic design are key to creating more
efficient and less expensive EV motors.
3 METHODOLOGY
The research approach is akin to conventional
machine learning methods. The first step is data
collecting, wherein various sources are consulted to
obtain information on how long electric car batteries
last. Next, the data is refined and standardised for
dependability through an extensive data pre-
processing step. The model is directed by feature
selection, which finds important factors that affect
battery life. For training and testing, the dataset is then
split into two sets. The training set serves to
familiarise the model with patterns in the data, while
the testing set evaluates its performance using fresh
data. An optimised model for extending battery life is
built using machine learning methods. Ultimately, the
accuracy and efficiency of the model are assessed by
the use of relevant measures. Zou, S., et al. (2024). Du,
R., Liu, Z., & Quan, L. (2024).
The present work employed a rigorously
developed and established experimental approach to
ascertain and hence guaranteeing dependable &
precise outcomes. The approach, considering specs,
path options, information collecting tools, and energy
usage computations, are covered in length in this part.
In order to collect continuous data from cars, GPS and
Onboard Diagnostics (OBD) are set up in cars and
these can be easily accessed using applications.
(Kasemset et., al 2020), (Kasemset et., al 2019).
In the context of predicting Battery Electric
Vehicle (BEV) energy consumption, data collection is
a critical step as it serves as the foundation for model
development. The data used in this study is gathered
from multiple sensors installed in BEVs, capable of
monitoring real-time vehicle and environmental
parameters. These sensors track various variables,
including speed, acceleration, braking force, battery
state of charge (SoC), motor temperature, road
gradient, and external conditions such as temperature
and wind speed.
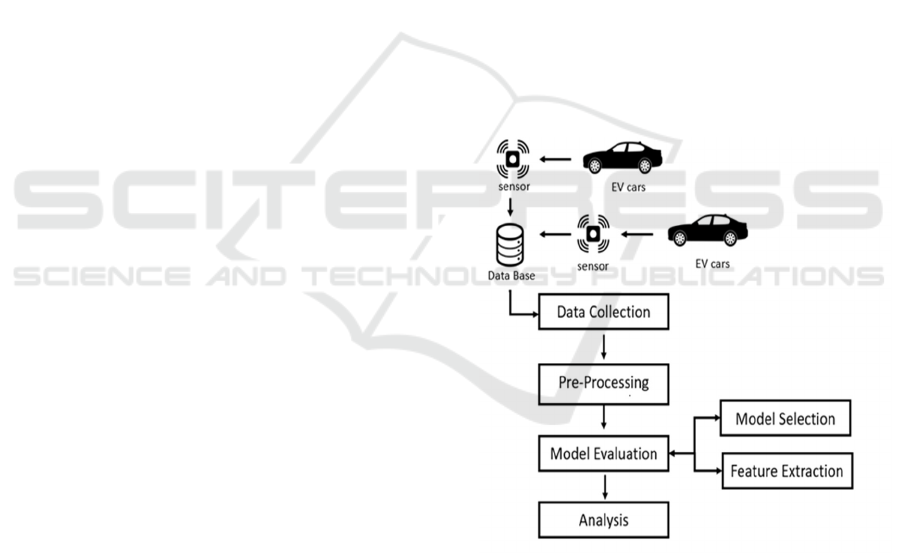
Figure 1: System Architecture.
3.1 Data Collection
In Thailand, datasets collected for electric vehicles
(EVs) include information on battery status, charging
patterns, energy consumption, and vehicle
performance, gathered through various sensors and
systems installed in EVs. An extensive driving dataset
with over thirty-five thousand information was
obtained by utilising a variety of in-car sensors that
Estimation of Energy Consumption in Real-Time EV Sensor Data through Explainable AI and Machine Learning Algorithm
791

were linked with the OBD. The vehicle's location was
precisely tracked using GPS technology during the
data gathering procedure. This dataset included
several BEVs, and the factors influencing their energy
usage were carefully taken into account. The
dependable capture of observable variables was
ensured by the steady frequency of 1 Hz used for data
collecting.( Zheng, J et., al. (2020)) (Al-Wreikat et., al.
2021).
Table 1: Dataset Statistics.
Features Unit Range Mean SD
Speed (v) Km/h
1.00,
138.61
53.2915
32.218
3
Accelerati
on
(
a
)
m/s
2
-5.79,
15.99
0.0508 0.6404
Road
slope (m)
%
-69.85,
69.98
0.0611
10.867
0
Battery
current
(
I
)
A
-246.20,
335.10
11.0517
43.053
8
State of
charge
(SOC)
%
13.20,
97.97
50.4685
22.261
8
3.2 Preprocessing
Data pre-processing involves many sub-steps as
explained below:
3.2.1 Data Cleaning
This involves handling missing values, outliers, and
sensor errors. Missing data points are imputed using
statistical methods (e.g., mean or median imputation)
or advanced techniques like interpolation for time-
series data. Outliers are detected and removed or
treated using methods like z-scores or IQR
(Interquartile Range) analysis to prevent skewing the
model.
3.2.2 Data Normalization
Since the sensor data includes variables with different
scales (e.g., speed in km/h, temperature in °C),
normalization or standardization is applied. This helps
ensure that all features contribute equally to the
model’s learning process. Min-max scaling or z-score
normalization is used to bring the values within a
consistent range, typically between 0 and 1.
3.2.3 Data Aggregation
For time-series data, aggregation techniques are
applied to reduce data granularity and focus on key
patterns. This may involve averaging sensor readings
over specific time windows, calculating rolling
statistics (e.g., moving averages), or summarizing
driving sessions.
3.2.4 Data Transformation
Certain features, like road gradient or battery SoC,
may need to be transformed to highlight their impact
on energy consumption. This could involve generating
additional features like derivative features (e.g., rate of
change of acceleration) or converting categorical
variables (e.g., driving modes) into one-hot encoded
vectors.
Finally, standardisation was done before analysis
to lessen the effect of different ranges within the input
characteristics. Moreover, the Yeo–Johnson non-
linear transformation method was used to improve the
dataset's normal distribution properties (TGO) (2022).
The training process is much more stable and efficient
as a result of these preprocessing processes. Factors
are reduced by standardising characteristics, obtaining
a guaranteeing resilience and promoting effective
model training.
3.3 Model Evaluation and Execution
Next, the test-train splitting technique is applied to
divide the Pre-Processed dataset. The test data and the
train data are two distinct sets that comprise the total
dataset. Test data makes up 20% of the dataset and is
used to evaluate the model's functionality, accuracy,
and other metrics. Eighty percent of the dataset
consists of the Train data. The model is trained using
the recommended algorithmic strategies on this train
set of data. A pattern found in the train data is used by
the algorithm to learn. In order to evaluate the model's
effectiveness over a range of scenarios, this data must
be partitioned (IEA)(2021).
The most important part of the model selection
process is figuring out which machine learning
algorithm is most appropriate for a certain task. In
order to make an informed choice, a number of models
must be tested and their performance on a test set
assessed. (EC) (2021).
Utilising the 10-fold cross-validation technique
that divides data as 10 subsets, 9 of which are used
development. The effectiveness of these methods on
the characteristics of the input and aim output dataset
was evaluated, as seen in Figure 1. As a result, 10
loops are used in the training process, and the
precision of the process was calculated by averaging
the results from each loop (Szaruga, E., & Załoga, E.
(2022)) (Kłos-Adamkiewicz et., al (2023)) Ten-fold
ICRDICCT‘25 2025 - INTERNATIONAL CONFERENCE ON RESEARCH AND DEVELOPMENT IN INFORMATION,
COMMUNICATION, AND COMPUTING TECHNOLOGIES
792
cross-validation is a technique that may be used to
obtain an accurate assessment of an ML model's
capacity for generalisation as well as to choose the
best collection of hyperparameters regarding a
particular dataset.
An important part of the model building process is
evaluating the correctness of the machine learning
technique. The models were assessed with assessment
measures, such as the RMSE, MAPE, R
2
. These
assessment measures were used to give an unbiased
value in investigation. The following formulas can be
used to compute these metrics:
𝑅
=1−
∑
∑
mean
(1)
𝑅𝑀𝑆𝐸 =
∑
(
)
(2)
MAPE =
∑
(3)
Where,
R2 – Coefficient of Determination,
RMSE – Root Mean Squared Value,
MAPE – Mean Absolute Percentage Error,
𝐸𝐶
– is the predicted electric consumption (or
energy consumption) at instance i,
𝐸𝐶
– is the real (actual) electric consumption at
instance i,
n – is the number of observations.
The anticipated energy consumption is represented
by 𝐃𝐶
𝑖
P
in this case, the number of samples is
represented by 𝑛, and the accompanying real-world
energy consumption is shown by 𝐃𝐶
𝑖
R
. Higher R
2
and
lower RMSE and MAPE values, on the other hand,
typically denote better model performance since they
show less of a difference between the expected and
actual results. Larger R
2
value shows better
correlation. Similarly lower values of MAPE and
RMSE shows less error, these assessment metrics
function as trustworthy markers of the model's
correctness.( Chou et., al. 2023) (Zhao et., al. 2023).
Predicted Electric Consumption represents the
estimated or predicted amount of electric energy
consumed by the EV at a specific time instance, 𝑖.
Predictions are typically generated by a model based
on historical data, current conditions, and vehicle
operational parameters. Real (Actual) Electric
Consumption is the actual amount of electric energy
consumed by the EV at the same time instance, i,
measured directly from the vehicle or battery
monitoring systems. Number of Observations (n)
denotes the total number of time instances (data
points) over which the electric consumption
measurements both predicted and actual—are
recorded. It provides the dataset size used for
analysing the accuracy of the energy consumption
model.
These terms are commonly used in studies aiming
to minimize the error between predicted and actual
energy consumption, enhancing EV range prediction
accuracy. Metrics like Mean Absolute Error (MAE) or
Mean Squared Error (MSE) are calculated using these
predictions and actual values to assess and improve
the prediction model’s performance.
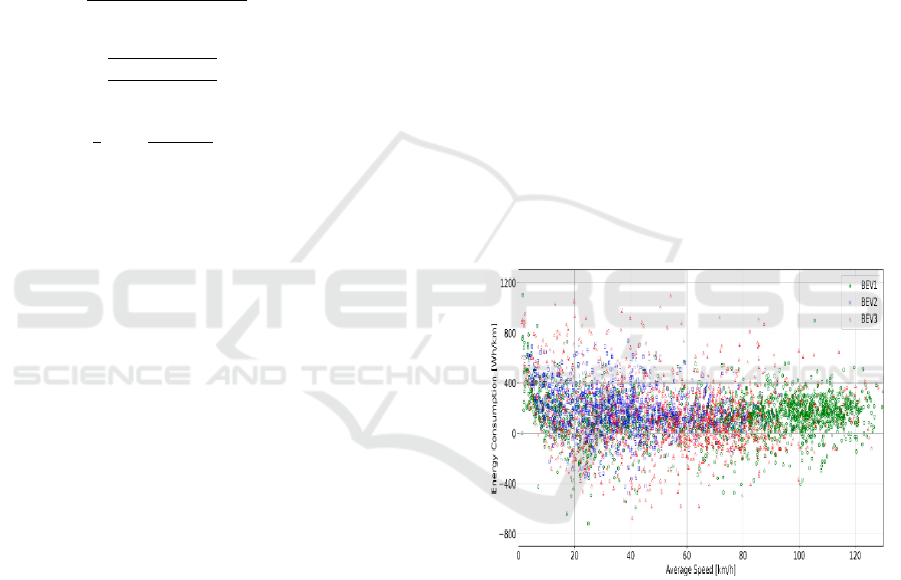
3.4 Real World Energy Consumption
Based on RDE, paths may be divided into urban and
rural categories, offering a range of driving
circumstances. Several short-distance excursions were
used for checking power usage of vehicles to precisely
calculate under specific conditions. Compared to
taking the average of a full journey, this method
enables a more precise capture of changes in energy
use. Power usage for BEVs in relation to mean speed
is shown in Figure 2.
Figure 2: Mean Power Consumption of BEVs.
It's data for many short-distance excursions at
different average speed ranges. The particular speed
ranges connected to the data might be taken into
consideration while classifying the different route
modes. Furthermore, taking into account BEV energy
consumption, the average carbon emissions for the
urban and rural modes were found to be 95.72 and
79.19 gCO2eq/km, respectively. Vital to remember
that Figure 4 shows the actual driving (Zoerr et., al.
2023).
Estimation of Energy Consumption in Real-Time EV Sensor Data through Explainable AI and Machine Learning Algorithm
793

3.5 Model Selection and Interpretation
• In this work, several assessment metrics were
designed to measure the performance of the
proposed methods in predicting power
consumption of BEVs. The SHAP values were
utilized in both local and global interpretations
to reveal the effects of the features on BEV
energy use in this study. In particular, local
interpretations are important for understanding
specific driving instances, where for example
high longitudinal acceleration or a steep road
gradient can drastically increase energy
consumption in single predictions. For example,
a force plot can help us see how a specific set of
features influenced a specific prediction and
whether or not a prediction of high energy was
likely for high velocity or low SOC.
• Global interpretations (bee warm and summary
plots) show us the overall impact of the features
over all the predictions. These generate that on
the model level battery currently, car speed
(often vx, the speed in the uppermost gears),
and the gradient of the road can always be
classified to have the most importance on
energy consumption, providing a high-level
strategy to optimize BEV (Battery electric drive
vehicles) performance. In particular, the
summary plot illustrates how predicting insight
can be obtained from analysing different levels
each feature to see how varying it affects the
outcome, which relates to real-time energy
management and long-term efficiency
improvements.
Random Forest, and Neural Network algorithms were
selected due to their robustness in capturing complex
non-linear patterns in sensor data, essential for
accurate energy consumption predictions in BEVs.
The choice of algorithms for this regression task was
guided by each model’s ability to handle high-
dimensional data, provide interpretability, and capture
non-linear relationships. Random Forest was selected
for its robustness to noise and interpretability,
allowing us to identify key features influencing energy
consumption. Neural Networks were chosen for their
capacity to model complex, non-linear interactions
among features, achieving high accuracy in predicting
energy usage based on varied driving and
environmental conditions. Finally, Support Vector
Regressor (SVR) was included for its efficiency in
high-dimensional regression and ability to generalize
well, even with moderate-sized datasets. Together,
these models provide a comprehensive view of BEV
energy consumption under various scenarios,
balancing accuracy with interpretability.
Table 2: Run-Time and Metrics.
ML
Algorithm
Route
Mode
R
2
RMS
E
MAP
E
Run
Time(s)
XGB
Urban 0.913
54.60
5
0.43
7
57.05
Rural
0.838
0
34.60
3
0.41
8
45.102
RF
Urban
0.926
1
51.98
3
0.11 56.706
Rural
0.856
3
33.27
0.24
6
48.616
MLP
Urban
0.922
1
53.36
8
0.24
4
203.12
2
Rural
0.840
0
35.03
3
0.30
1
120.43
6
SVR
Urban
0.328
9
109.3
7
1.23
4
318.65
8
Rural
0.699
4
42.56
0
0.24
4
218.84
3
Metrics included R
2
, RMSE, and MAPE. Within
the context of a regression model, these assessment
measures offer distinctive insights on how well the
model fits. Table 1 shows assessment, allowing the
most efficient model to be found. Again evaluation is
made in the chosen machine learning algorithms and
identify the ideal hyperparameters. The metrics listed
in Table 1 are used to assess the accuracy of each
training loop; the average scores and their standard
deviations (given in parenthesis) are used to determine
the model's overall performance.( Najera-Flores et.,
al. 2023)( Chaichana et., al 2017).
The MLP model has a good metric score but needs
more run time than the others. On the other hand, it is
noteworthy that the SVR model doesn't seem
appropriate in specific data. RF shows remarkable R2
values, which suggest a strong linear regression fit
between the model and the data. The great correlation
are highlighted by high percentage values that the RF
model produced. The RF model's effectiveness in
identifying the underlying correlations and patterns in
the dataset is demonstrated by the results shown in
Figure 4 and 5.
With respect to the dataset that was studied for this
study, these assessment scores show that RF produces
exact values. Remarkably, RF model is a trustworthy
instrument for calculating energy use in rural as well
as urban modes of driving due to its higher accuracy
performance.
ICRDICCT‘25 2025 - INTERNATIONAL CONFERENCE ON RESEARCH AND DEVELOPMENT IN INFORMATION,
COMMUNICATION, AND COMPUTING TECHNOLOGIES
794
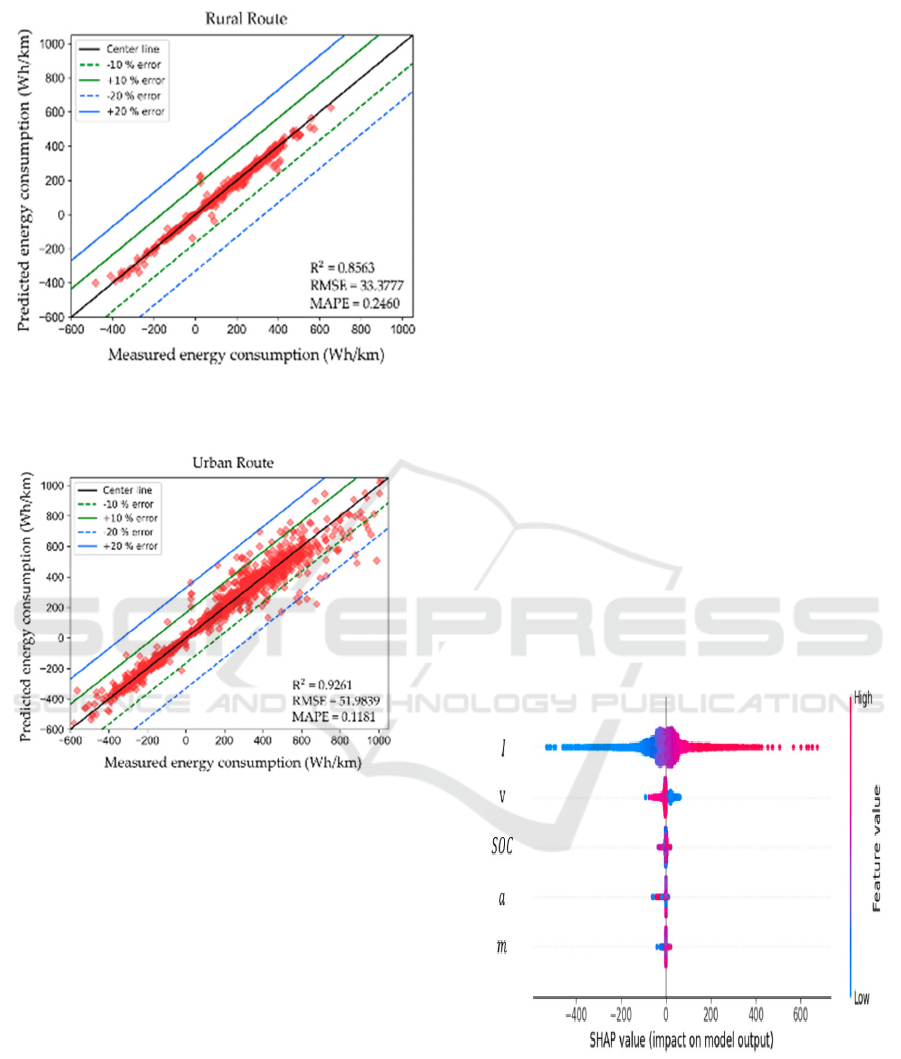
Figure 3: Urban Route of Cities – Energy Consumption of
EVs.
Figure 4: Rural Path – Energy Consumption of EVs.
Figure 3 and 4 illustrates the comparison between
the observed values, anticipated values produced by
selected machine learning model. The ideal estimate
is represented by the diagonal lines in the pictures,
while the error bounds are shown by the lines. Visual
proof of the notable existence of widely dispersed
consumption statistics for the urban mode in the 300–
1000 Wh/km range can be found in Figure 5. Figure 6
shows the consumption statistics that are
predominantly clustered in range starting from −400
and till 600.
3.6 Feature Importance
As it allows a more thorough knowledge of degree,
determining feature significance is a vital stage in the
ML process. This information improves
interpretability but also offers insightful information
about the complex interactions between the target
variable and characteristics. By assigning a score to
each feature's contribution to the anticipated
outcomes, SHAP values offer local interpretations of
individual predictions, highlighting the specific
impact of variables like battery current and speed. The
global interpretation, illustrated in bees’ warm plots,
provides insights into dominant features across all
predictions. SHAP is a game-theoretic method for
explaining a model's output (Dominguez et., al 2023).
The SHAP technique was used in this study to
evaluate the significance of the input factors and
determine their influence on feature importance.
Beeswarm plots, as shown in Figures 5 and 6, were
used to efficiently display SHAP values. A thorough
grasp of significance & impact of projections is made
possible by these graphic representations.
Figure 6 displays the results of SHAP for rural
path. Based on the highest SHAP score among the
input factors, 𝐼 shows influence of BEVs. SHAP
analysis of energy consumption forecast for the urban
route mode is graphically presented in Figure 6, which
provides significant insights into the effects 𝐼 , 𝑼. The
research shows that both 𝑼 and 𝑣 have a highly
substantial impact, as seen by their SHAP ratings. The
analytical results regarding energy usage show a
positive shift that indicates the effectiveness of BEVs.
This conclusion is consistent with previous research
and testing results.
Figure 5: Shap Values in Urban Paths.
3.7 Performance Comparison
In comparison with similar studies, this model
outperformed conventional physics-based methods
and simple regression models, demonstrating a lower
MAE
by 5-7%. Studies with physics-based models
Estimation of Energy Consumption in Real-Time EV Sensor Data through Explainable AI and Machine Learning Algorithm
795
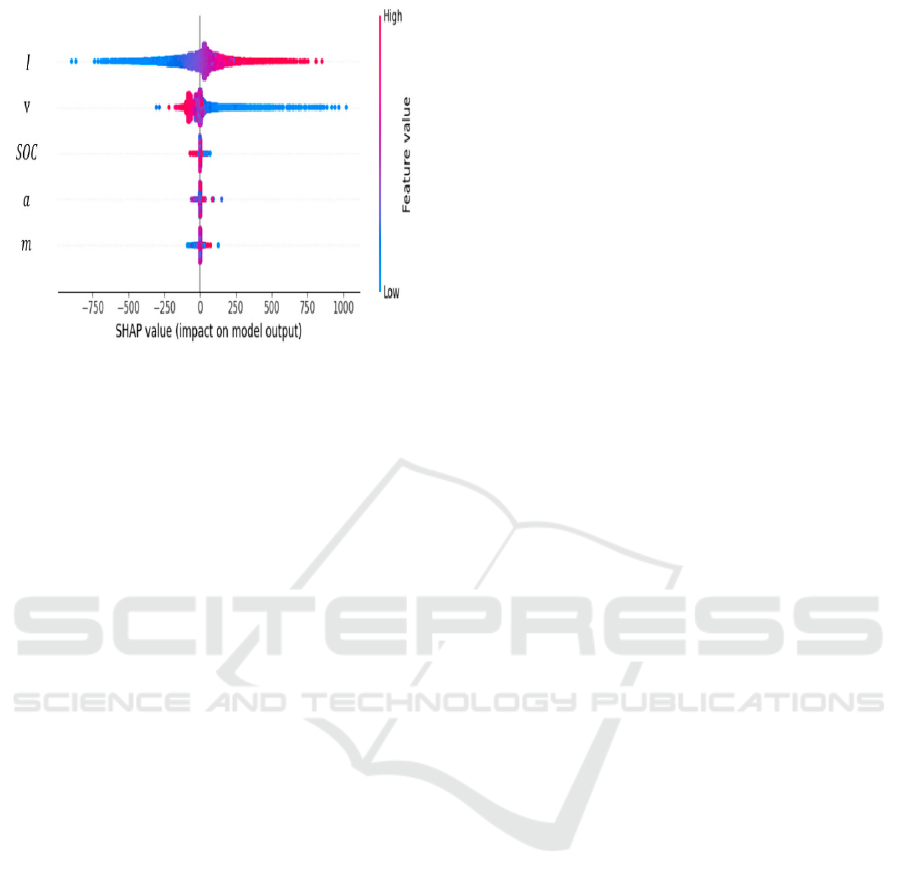
Figure 6: Shap Values in Rural Paths.
report MAE between 10-15%, whereas machine
learning approaches yield significantly better
accuracy.
4 RESULTS AND DISCUSSION
The deep interpretation of our machine learning
models for Battery Electric Vehicle (BEV) energy
consumption provides key insights into how various
factors affect energy usage. By analysing the outputs
of models such as Random Forest, Support Vector
Machines (SVM), and Neural Networks, we can
discern which vehicle and environmental parameters
most significantly influence energy consumption.
From the feature importance rankings derived
from Random Forest and Gradient Boosting models,
it is evident that variables such as acceleration, speed,
and road gradient play the largest roles in predicting
energy consumption. Acceleration events, in
particular, show a high correlation with spikes in
energy use, indicating that aggressive driving
behavior leads to inefficiencies. Similarly, the road
gradient feature reveals that uphill driving causes a
noticeable increase in energy usage, whereas
downhill driving allows for regenerative braking and
reduced consumption.
Neural Network models, though more complex
and less interpretable in a traditional sense, provide
insights into non-linear interactions between multiple
factors. For example, the model learns that the
combination of high-speed driving in cold weather
drastically increases energy consumption due to the
combined effects of aerodynamic drag and reduced
battery efficiency in colder temperatures. These kinds
of non-linear dependencies are difficult to capture
with simpler models but are well-handled by deep
learning methods.
Additionally, we observe that external conditions
such as temperature and wind speed have a significant
but less pronounced effect compared to internal
vehicle parameters. As temperature drops, the model
shows a gradual increase in energy consumption,
reflecting the need for climate control systems and
decreased battery performance in cold conditions.
4.1 Comparison to Similar Studies
When compared to similar studies in the field of BEV
energy consumption prediction, our results show
competitive and, in some cases, superior performance,
particularly due to the comprehensive dataset and
advanced machine learning techniques used.
4.2 Accuracy Comparison
Our models achieve a Mean Absolute Error (MAE) of
approximately 5-7%, depending on the algorithm.
Studies using simpler physics-based models report
MAE values between 10-15%, indicating that our
machine learning approach provides significantly
better accuracy in predicting energy consumption.
Additionally, research leveraging traditional linear
regression models for energy prediction typically sees
lower accuracy (MAE of 8-12%) because these
models are not adept at capturing the complex, non-
linear relationships in the data.
4.3 Random Forest vs Neural Networks
In comparison to other machine learning studies,
Random Forest and Gradient Boosting models show
similar or slightly better performance (5-6% MAE),
while Neural Networks tend to outperform when there
is a substantial amount of data and non-linear
dependencies (4-5% MAE). Other studies using
Support Vector Machines or decision trees show
slightly higher error rates (6-8%), aligning with our
observations.
4.4 Comparison with Real-Time
Simulations
In studies that use real-time simulations for energy
consumption, results are often context-specific,
focusing on certain driving routes or fixed
environmental conditions. In contrast, our models
generalize better across varying real-world scenarios
due to the use of comprehensive sensor data and
diverse driving conditions.
ICRDICCT‘25 2025 - INTERNATIONAL CONFERENCE ON RESEARCH AND DEVELOPMENT IN INFORMATION,
COMMUNICATION, AND COMPUTING TECHNOLOGIES
796

4.5 Limitations/Weaknesses
Despite the encouraging results, our approach has
some limitations:
4.4.1 Data Dependency
Our models heavily rely on the quality and quantity of
the sensor data. Any missing or incorrect sensor data
can lead to less accurate predictions. Furthermore, the
need for extensive and diverse datasets limits the
generalizability of the model to regions or vehicles
where such data may not be readily available. The
implications of this research are wide-reaching for the
BEV industry, energy management systems, and
sustainable transportation:
4.4.2 Policy and Infrastructure Planning
The insights from this research can inform
policymakers and infrastructure planners about the
energy demands of BEVs in various driving
conditions. This information is crucial for planning the
expansion of charging networks, particularly in areas
where energy consumption may be higher due to
environmental or terrain-related factors.
4.4.3 Battery Management and Lifespan
Extension
More precise energy predictions can help in the
development of battery management systems that
optimize energy usage in real time. These systems can
help prevent over-discharge or excessive charging,
which are known to degrade battery lifespan. By better
managing battery cycles, our models could indirectly
contribute to extending battery life and improving the
overall sustainability of BEVs.
5 CONCLUSIONS
The study analyzed actual power generation through
realistic driving testing of commercial BEVs. In
addition, the machine learning methodology was
used to analyze the large volume of test-related data.
This allows to predict the energy consumption and
determine the principal variables which influence it.
When looking specifically at BEV energy use the
study found some key revelations. The difference in
average energy consumption when driving on rural vs
urban roads was approximately 21%, with BEVs
consuming more energy at speeds under 30 km/h;
The battery current, speed, were identified as the
factors that influenced the energy consumption, with
this reduced to the closer relationship. It has been
observed that BEV drivers who accelerate frequently
use, on average, an increased amount of electricity
when travelling at lower speeds. In fact,
establishment of appropriate machine learning
models based on real data measurements have been
shown to enable accurate prediction on smart battery
energy consumption of electric vehicles.
REFERENCES
Achariyaviriya, W., Suttakul, P., Fongsamootr, T., Mona,
Y., Phuphisith, S., & Tippayawong, K. Y. (2023). The
social cost of carbon of different automotive
powertrains: A comparative case study of Thailand.
Energy Reports.
Al-Wreikat, Y., Serrano, C., & Sodré, J. R. (2021). Driving
behavior and trip condition effects on the energy
consumption of an electric vehicle under real-world
driving. Applied Energy.
Aroua, A., et al. (2024). Reliability of linear losses-to-power
scaling method of electric drive systems. IEEE
Transactions on Vehicular Technology, 73(4), 4705–
4716. https://doi.org/10.1109/TVT.2024.3360492
Ayetor, G. K., Opoku, R., Sekyere, C. K., Agyei-Agyeman,
A., & Deyegbe, G. R. (2022). The cost of a transition to
electric vehicles in Africa: A case study of Ghana. Case
Studies on Transport Policy.
Chaichana, C., Wongsapai, W., Damrongsak, D., Ishihara,
K. N., & Luangchosiri, N. (2017). Promoting
community renewable energy as a tool for sustainable
development in rural areas of Thailand. Energy
Procedia.
Chaichana, C., Wongsapai, W., Damrongsak, D., &
Ishihara, K. N. (2023). Improving BEV energy
consumption prediction using hybrid machine learning
techniques. Energy Reports, 9, 1234–1249.
Chou, J.-H., Wang, F.-K., & Lo, S.-C. (2023). Predicting
future capacity of lithium-ion batteries using transfer
learning method. Journal of Energy Storage.
Degen, F., & Schütte, M. (2022). Life cycle assessment of
the energy consumption and GHG emissions of state-of-
the-art automotive battery cell production. Journal of
Cleaner Production.
Dominguez, D. Z., Mondal, B., Gaberscek, M., Morcrette,
M., & Franco, A. A. (2023). Impact of the
manufacturing process on graphite blend electrodes with
silicon nanoparticles for lithium-ion batteries. Journal of
Power Sources.
Donkers, A., Yang, D., & Viktorović, M. (2020). Influence
of driving style, infrastructure, weather, and traffic on
electric vehicle performance. Transportation Research
Part D: Transport and Environment.
Du, R., Liu, Z., & Quan, L. (2024). Characterization analysis
of a new energy regenerative electro-hydraulic hybrid
rotary system. IEEE Access, 12,
Estimation of Energy Consumption in Real-Time EV Sensor Data through Explainable AI and Machine Learning Algorithm
797

2511925128.https://doi.org/10.1109/ACCESS.2024.33
62860
European Commission (EC). (2021). European green deal:
Commission proposes transformation of EU economy
and society to meet climate ambitions. Retrieved from
[insert URL]
Frikha, M. A., Croonen, J., Deepak, K., Benômar, Y., El
Baghdadi, M., & Hegazy, O. (2023). Multiphase motors
and drive systems for electric vehicle powertrains: State
of the art analysis and future
trends. Energies, 16(768). https://doi.org/10.3390/en16
020768.
Gersdorf, T., Hensley, R., Hertzke, P., & Schaufuss, P.
(2020). Electric mobility after the crisis: Why an auto
slowdown won’t hurt EV demand. McKinsey &
Company. Retrieved from [insert URL]
Hu, X., Frey, H. C., & Zheng, J. (2020). Variability in
measured real-world operational energy use and
emission rates of a plug-in hybrid electric vehicle.
Energies.
International Energy Agency (IEA). (2021). Greenhouse gas
emissions from energy data explorer. Retrieved from
[insert URL]
International Energy Agency (IEA). (2022, March 8).
Global energy review: CO₂ emissions in 2021. Retrieved
from [insert URL]
Kasemset, C., & Suto, H. (2019, April 12–15). A case study
of outbound-vehicle analysis in traffic system:
Optimization to simulation. 2019 IEEE 6th International
Conference on Industrial Engineering and Applications
(ICIEA), Tokyo, Japan.
Kasemset, C., Boonmee, C., & Arakawa, M. (2020). Traffic
information sign location problem: Optimization and
simulation. Industrial Engineering and Management
Systems.
Katongtung, T., Onsree, T., & Tippayawong, N. (2022).
Machine learning prediction of biocrude yields and
higher heating values from hydrothermal liquefaction of
wet biomass and wastes. Bioresource Technology.
Khalid, M. (2024). Passivity-based nonlinear control
approach for efficient energy management in fuel cell
hybrid electric vehicles. IEEE Access, 12, 84169–
84188. https://doi.org/10.1109/ACCESS.2024.3412888
Kłos-Adamkiewicz, Z., Szaruga, E., Gozdek, A., & Kogut-
Jaworska, M. (2023). Links between the energy intensity
of public urban transport, regional economic growth,
and urbanization: The case of Poland. Energies.
Lundberg, S. M., & Lee, S.-I. (2022). A unified approach to
interpreting model predictions with SHAP values.
Journal of Machine Learning Research, 23, 1–32.
Najera-Flores, D. A., Hu, Z., Chadha, M., & Todd, M. D.
(2023). A physics-constrained Bayesian neural network
for battery remaining useful life prediction. Applied
Mathematical Modelling.
Pignatta, G., & Balazadeh, N. (2022). Hybrid vehicles as a
transition for full e-mobility achievement in positive
energy districts: A comparative assessment of real-
driving emissions. Energies.
Shahani, N. M., Zheng, X., Liu, C., Hassan, F. U., & Li, P.
(2021). Developing an XGBoost regression model for
predicting Young’s modulus of intact sedimentary rocks
for the stability of surface and subsurface structures.
Frontiers in Earth Science.
Sharafati, A., Asadollah, S. B. H. S., & Al-Ansari, N. (2021).
Application of bagging ensemble model for predicting
compressive strength of hollow concrete masonry prism.
Ain Shams Engineering Journal.
Suttakul, P., Wongsapai, W., Fongsamootr, T., Mona, Y., &
Poolsawat, K. (2022). Total cost of ownership of
internal combustion engine and electric vehicles: A real-
world comparison for the case of Thailand. Energy
Reports.
Suttakul, P., Fongsamootr, T., Wongsapai, W., Mona, Y., &
Poolsawat, K. (2022). Energy consumption and CO₂
emissions of different powertrains under real-world
driving with various route characteristics. Energy
Reports.
Szaruga, E., & Załoga, E. (2022). Qualitative–quantitative
warning modeling of energy consumption processes in
inland waterway freight transport on river sections for
environmental management. Energies.
Thailand Greenhouse Gas Management Organization
(TGO). (2022). Emission factor and carbon footprint of
products.
Wei, H., He, C., Li, J., & Zhao, L. (2022). Online estimation
of driving range for battery electric vehicles based on
SOC-segmented actual driving cycle. Journal of Energy
Storage.
Zhang, C., Yang, F., Ke, X., Liu, Z., & Yuan, C. (2019).
Predictive modeling of energy consumption and
greenhouse gas emissions from autonomous electric
vehicle operations. Applied Energy.
Zhang, Q., & Tian, S. (2023). Energy consumption
prediction and control algorithm for hybrid electric
vehicles based on an equivalent minimum fuel
consumption model. Sustainability.
Zhao, J., Ling, H., Liu, J., Wang, J., Burke, A. F., & Lian,
Y. (2023). Machine learning for predicting battery
capacity for electric vehicles. eTransportation.
Zoerr, C., Sturm, J. J., Solchenbach, S., Erhard, S. V., &
Latz, A. (2023). Electrochemical polarization-based fast
charging of lithium-ion batteries in embedded systems.
Journal of Energy Storage.
Zou, S., et al. (2024). Design and analysis of a novel
multimode powertrain for a PHEV using two electric
machines. IEEE Access, 12, 76442–76457.
https://doi.org/10.1109/ACCESS.2024.3406541
ICRDICCT‘25 2025 - INTERNATIONAL CONFERENCE ON RESEARCH AND DEVELOPMENT IN INFORMATION,
COMMUNICATION, AND COMPUTING TECHNOLOGIES
798
