
Educational Data Mining for Student Performance Prediction: A
Hybrid Model Perspective
Rama Soni
1
, Abhinav Shukla
2
and Sumati Pathak
3
1
Dr. C. V. Raman University Kota, Bilaspur, 495001 Chhattisgarh, India
2
Department of CS & IT, Dr. C. V. Raman University, Kota, Bilaspur, 495001 Chhattisgarh, India
3
Govt E R R P G Science College, Bilaspur, Chhattisgarh, India
Keywords: Development, Predicting, Hybrid, Students Performance, Bilaspur City.
Abstract: Data mining technology has significantly improved the ability to extract, store, and interpret enormous
quantities of data, even different kinds of data samples. The prediction of students’ academic performance is
one of the most fascinating new pathways in the area of educational data mining. Various types of
classification methods have been used in studies to predict how well students would perform in their classes,
and educational data mining and big data research continues to make these models even more accurate. We
developed a hybrid categorisation model to predict the educational performance of students in the Bilaspur
City. The proposed hybrid model is a combination of two techniques called ID3 and J48 based classification.
In this hybrid method, weak machine learning methods are utilized with a voting strategy to enhance
prediction accuracy. Through a dataset of Bilaspur city students, we tested the performance of our hybrid
algorithm to predict the academic achievement. To evaluate the effectiveness of the hybrid model,
classification accuracy was estimated. The results indicated that the proposed hybrid classifier algorithm
achieved an accuracy of 92.40% that lays a good foundation for future improvement and application in
educational environments.
1 INTRODUCTION
In the realm of contemporary technology, data mining
stands at the forefront. It involves extracting
meaningful insights from large volumes of dispersed
and unstructured data, often through parallel data
processing techniques (Han, Kamber, & Pei, 2011).
Data mining methods are applied across a wide range
of industries to uncover new knowledge from
extensive datasets. Among these industries, the
education sector has emerged as a leading adopter of
data mining technologies (Shahiri, Husain, & Rashid,
2015). Researchers in education increasingly rely on
data mining to identify information relevant to their
studies. Current efforts focus on discovering
innovative ways to apply these techniques to
educational data. These endeavors aim not only to
improve academic practices but also to inspire
broader public engagement with educational research
(West, 2012). Data mining in education serves
multiple purposes, including the discovery of hidden
patterns within educational datasets, ultimately
revealing insights that were previously unknown
(Bramer, 2020).
2 BIG DATA IN EDUCATION
Both research and education are among the many
fields that can benefit from the capabilities of big data
(West, 2012). In traditional education systems, big
data offers teachers deeper insight into students'
knowledge levels and learning styles. This enables
educators to adopt more effective and personalized
instructional methods. The utilization of big data also
significantly enhances online education. In recent
years, e-learning has advanced rapidly, and its
influence in the educational sector continues to grow
(Swathi, Kumar, & KiranKranth, 2017). The
application of big data in education includes the use
of educational data mining and learning analytics,
which apply statistical, computational, and machine
learning techniques to large datasets (Shahiri et al.,
2015). These methodologies support meaningful
744
Soni, R., Shukla, A. and Pathak, S.
Educational Data Mining for Student Performance Prediction: A Hybrid Model Perspective.
DOI: 10.5220/0013872200004919
Paper published under CC license (CC BY-NC-ND 4.0)
In Proceedings of the 1st International Conference on Research and Development in Information, Communication, and Computing Technologies (ICRDICCT‘25 2025) - Volume 1, pages
744-752
ISBN: 978-989-758-777-1
Proceedings Copyright © 2025 by SCITEPRESS – Science and Technology Publications, Lda.
analyses of student learning behaviors and
instructional efficacy.
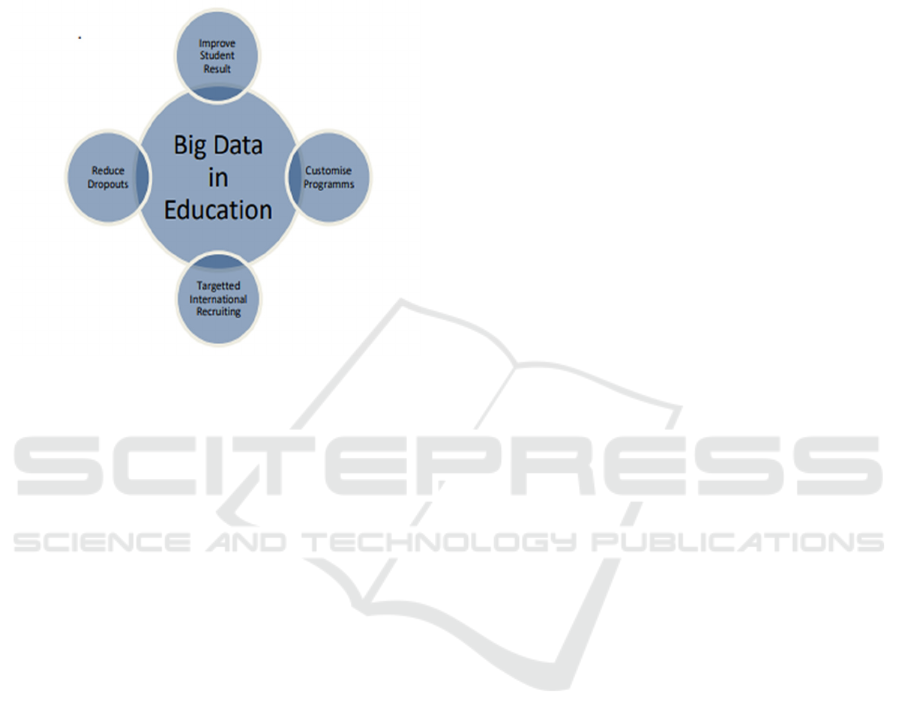
The mining of educational data has discovered a
number of applications for big data, as shown in
Figure 1. These applications include improving
student performance and reducing student dropout
rates.
Figure 1: Big Data in Education.
Over the course of the last several years, the
concept of "big data" has become the most often
discussed topic in the world of information
technology. According to the "3Vs" idea, the three
facet of big data that are considered to be the most
important are volume, velocity, and variety.
2.1 Volume
A number of different sources, including business and
social media, are used by the agency in order to gather
its data. When dealing with enormous datasets, it is
the distinguishing characteristic. There has been a
considerable movement in the sizes of data, which
moved from KB, MB, and GB to GB and GB,
respectively. There is an excess of each scale that is
hundreds of times greater. There has been a dramatic
increase in the amount of data over time.
2.2 Velocity
Now we get to the second characteristic. The fast
development of datasets is alluded to in this sentence.
The pace of development suggests that there are two
focal points to consider. The first one is indicative of
a rather high pace of data production among the many
options. Indicating that the pace at which data is
processed is relatively quick is the second point for
consideration.
2.3 Variety
To be more specific, the third example emphasizes on
the variations in data relating distinct data channels,
configurations, and structures, all of which are
beyond the capacity of data processing capabilities to
be formed at the present time. The word "data" may
refer to a broad variety of different types of
information, such as structured, quantitative data that
is kept in conventional databases, unstructured
content records, text messages, audio and video
recordings, and many more.
3 OBJECTIVES
1. To study on Big Data in Education
2. To study on Volume, Velocity and Variety
(3Vs)
4 RESEARCH METHOD
4.1 Classification Algorithms
For the purpose of enhancing the precision of our
projections on the academic achievement of pupils,
we have used a broad range of classification
strategies. Through the use of these methodologies,
we were able to identify and investigate a broad
variety of factors that have an impact on the academic
performance of pupils, which ultimately resulted in
more accurate projections. PHC is one among these
approaches; others include RF, C4.5, CART, SVM,
NB, and KNN. Some of these methods are listed
below.
4.1.1 Random Forest (RF)
Random forest is a strategy for ensemble learning that
involves the construction of a large number of
decision trees during the training process. After that,
the approach either generates the mean forecast of all
the trees or the typical prediction of the classes. Each
tree is constructed using a random selection of the
training data and attributes, which helps to increase
the tree's robustness and limit the extent to which it
overfits the data. One of the factors that has led to the
growing popularity of random forest is its ability to
effectively cope with high-dimensional data and
nonlinear interactions.
Educational Data Mining for Student Performance Prediction: A Hybrid Model Perspective
745

4.1.2 C4.5
The technique used for dealing with classification
problems is referred to as a five-name decision tree.
This is done by creating decision trees based on the
information gain criterion to measure the separation
of the data in nodes. C4 until a stopping criterion is
reached (e.g., the tree reaches a maximum depth, or
and all instances belong to the same class). 5(data up
to October 2023) 5 5 0.5 5 A Feature is Split Given
N, 0.5 The data is repeatedly split into subsets where
a fully featured decision tree splits the data on the
feature that maximises information gain. This goes on
until the stopping criteria is processed. The C4. 5
programming language is recognized as very easy to
learn and work with. C4 uses a top-down, greedy
approach. 5 for recursively partitioning the dataset in
accordance with the attribute that is most relevant for
each node. Using the existing information, the
structure helps to manage both discrete and
continuous features, and missing value predictions for
characteristic characteristics. It can also estimate the
missing value for the attributes as well.
4.1.3 Classification and Regression Trees
(CART)
So, one example of a similar decision tree technique
is the CART procedure, that can apply to both
classification and regression. The same recursive
partitioning of the input space is used by CART as
for C4. 5, which is used to construct binary trees.
Doing so enables the definition of regions that either
minimise variance (regression) or impurity
(classification). In contrast to C4. 5 The splitting
criteria and how to deal with categorical variables in
CART are not identical. CART is also a popular
choice due to its capability for handling a range of
data. The CART algorithm will choose the split at
each node which maximises purity or minimises a
measure of variance, whether you are building a
binary tree for classification or regression. It can
accommodate both categorical and continuous
variables, as well as missing data. CART is useful for
the decision-making process because it is easy to
understand and visualize.
4.1.4 Support Vector Machines (SVM)
In the context of classification and regression
problems, support vector machines (SVM) are
supervised learning algorithms. Finding the best
hyperplane that separates instances of distinct classes
in the feature space while simultaneously maximizing
the margin, which is the distance between the
hyperplane and the closest data points (support
vectors), is how it functions. Through the use of
kernel functions such as linear, polynomial, and radial
basis function (RBF) kernels, support vector
machines are able to handle both linear and nonlinear
interactions. In high-dimensional spaces, support
vector machines (SVM) are effective, and they can
also differentiate classes in nonlinear feature spaces
by using kernel functions. Additionally, the SVM
features a regularizing parameter that assists in the
management of overfitting.
4.1.5 Naive Bayes (NB)
Naive Bayes is a probabilistic classification algorithm
based on Bayes’ theorem with the naive assumption
of independence between every pair of features.
Although its assumption is oversimplified, the Naive
Bayes algorithm consistently provides decent results
decades in usual situations, especially for the text
classification. At the point of making a prediction, it
considers the features that are given, estimates the
probability that each class is true, and then chooses
the class with the highest probability. Naive Bayes
assumption states that features are independent given
the class. This assumption allows us to easily
calculate the posterior probability. It not only is
computationally efficient but also requires less
amount of training data.
4.1.6 K-Nearest Neighbors (KNN)
KNN, an instance-based, non-parametric learning
algorithm, is used for solving classification as well
as regression problems. To get it done, it performs
regression, which means intuitively taking an average
of the values of the closest neighbours in the feature
space, or classification, essentially giving the new
data point to the dominant class. KNN can be a good
choice with a wide range of data and application
because it is so easy to use and flexible. K-Nearest
Neighbours (KNN), is used as a non-parametric
method as it retains all the previously collected
examples and assigns new cases by a similarity
measure (such a distance function). This involves
calculating the distances between all of the pairs of
data points and, even though this is a referential
algorithm to implement and relatively
straightforward to write, it can be computationally
costly on major datasets.
4.1.7 Proposed Hybrid Classifier (PHC)
This research work aims to propose a new hybrid
classification approach which embeds properties of
ICRDICCT‘25 2025 - INTERNATIONAL CONFERENCE ON RESEARCH AND DEVELOPMENT IN INFORMATION,
COMMUNICATION, AND COMPUTING TECHNOLOGIES
746
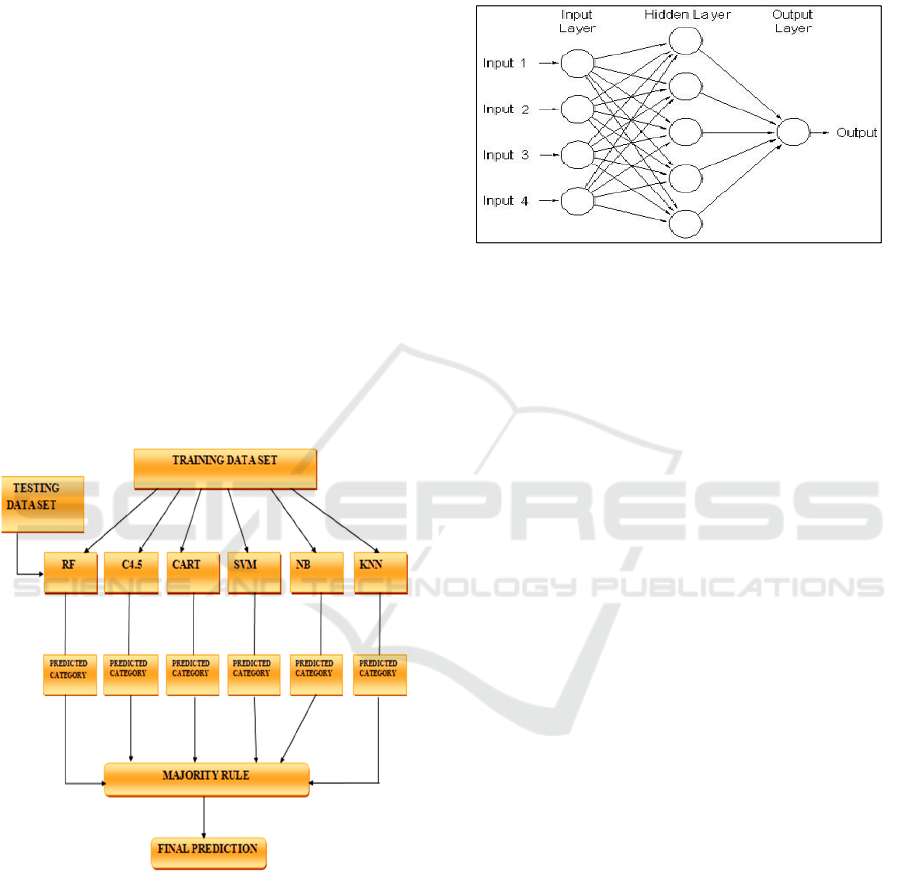
several related classification models. We propose an
ensemble of a random forest and C4, which is trained
to predict the performance of students: 5, CART,
SVM, NB and KNN. Initially, the hybrid classifier
trains every single algorithm on the given training
set. After the training procedure has been completed,
the hybrid classifier will then continue to supply the
testing set to each of the algorithms. An instance in
the testing set gets a class label depending on the
value predicted by each algorithm. In the final
prediction step of the multi-class hybrid classifier,
the class label with the most votes is selected. The
objective of combining multiple categorisation
algorithms is to provide better results than any of the
individual algorithms alone. Such hybrid classifiers
can improve the overall performance of the hybrid
classifier with voting-based aggregation methods
which help to reduce errors and the biases generated
by individual classifiers. When single algorithms
master multiple aspects or can detect multiple
patterns in the data set they add high value. Figure 2
depicts the principle of the hybrid classifier we
introduced.
Figure 2: Proposed Hybrid Classifier Phc.
4.1.8 Artificial Neural Network
Artificial neural networks (ANNs) (which are named
for the fact that they operate in much the same way
as the human nervous system) operate using
"neurons" similar to the way the human body does. It
can take a variety of incoming signals, process them,
and bring them to an output, much like a human
nervous system. This model can be used to represent
very complex relationships. Here is a diagram
illustrating the components of an artificial neural
network (ANN): (figure 3: shows the Artificial
Neural Network).
Figure 3: Artificial Neural Network.
The abstractness of the AINet types on the surface
aids in learning through example datasets and giving
predictions on new data making them a powerful tool
for prediction analytics. The hidden layer of the
network, consisting of a vector of neurones, is the one
that corresponds to the input patterns that get keyed
into the input layer of the network when that training
data is made known. Different types of activation
functions are used for different types of output
requirements. The output of the neurones of the
present layer is given to the neurones of next layer.
The output layer is considered to consolidate data that
can be used to visualize a forecast on the basis of a
new input. There are many different models of
artificial neural networks available, each with a
different algorithm that is specific to that model. In a
supervised learning setting, backpropagation is the
go-to algorithm. Artificial neural networks are often
employed for unsupervised learning tasks.
Clustering technique, a method that is used in
unsupervised learning with artificial neural network.
Except they are based on the non-linear relations with
the aspect of data as they deal with the data points.
Two we will use these for the following methods
(decisions trees and regression) to check for their
performance. With the ability to solve the problems
associated with image recognition itself, these
models have pattern recognition capabilities.
Hence, a hybrid classification model should be
built for predicting the performance of children of
Bilaspur City, which would require a systematic
approach integrated with data collection and
analytical tools. For this project, we incorporate
data-driven methodologies as part of the research
methodology that includes data preparation, feature
selection, model selection and performance
Educational Data Mining for Student Performance Prediction: A Hybrid Model Perspective
747

evaluation. In other words, the aim is to create a
predictive model so that not only could educational
institutions, governments, and educators do the right
thing, they could even do it better.
5 DATA COLLECTION
The data collection step is the first essential step
towards building a good prediction model. In this
research, data on students' academic performance in
the city of Bilaspur will be collected from a wide
range of educational institutions of different grades,
both private and public schools. But this information
will be collected through this investigation. The data
will encompass various demographic information,
including age, sex, socioeconomic status, and
parental involvement. In addition to this, the data
will involve measures of academic performance,
including grades, test scores, and attendance records.
Other variables will be considered as well namely
participation in after school activities, study habits,
and availability of educational resources (internet or
private lessons) in line with the aim of obtaining a
clearer picture of the academic context that students
are signed on to.
The local educational authorities will work
closely with us in order to ensure that data collection
is carried out in accordance with ethical and privacy
best practices. All personally identifiable information
will only be used with the permission of all relevant
parties, including students, parents as well as schools,
in order to protect students' privacy. The primary data
sources will consist of the self-administered
questionnaire and survey, and the secondary sources
of data will consist of academic records and
databases on student success.
6 DATA PREPROCESSING
Once the data collection is complete, the data will be
cleaned and pre-processed to make it suitable for
analysis. This includes correcting mistakes in the
dataset, handling missing data, deleting duplicates,
etc. More complex methods such as knn imputation
may be used to complete missing values based on the
type and distribution of missing data, or mean,
median or mode may be used.
The next type of data environmental factors such
as gender, socio-economic status, or school type will
be encoded in a format that works with machine
learning algorithms (for example one-hot encoding or
label encoding). Examples include test results and
attendance rates which will be normalised, or
standardised so they are on a level playing ground.
This is why feature scaling is an absolute must in
order to avoid one variable taking over the predictive
model due to its outsized range.
Outlier identification and treatment will also be
carried out. Outliers can be addressed in the event
that they are due to human error (a data entry error).
And if these examples are extreme yet valid and
might not have been reflected in the model's
predictions, then they have the opportunity to be
removed. Like in most machine learning research,
the second step in data preparation is to split the
dataset into two halves in length, as a training set and
a testing set. The training set is used to build and
optimise the model, while the testing set is used to
assess how well the model will perform on unseen
data.
7 FEATURE SELECTION
Feature selection is a critical step in developing an
effective classification model. Given the in light of
the fact that there are a multitude of potential
elements that might influence the performance of
students, it is of the utmost importance to isolate and
retain just the most significant qualities that boost the
capacities of the model to make predictions. This will
be done via the use of statistical methods as well as
specialist knowledge in the field.
We will begin by using exploratory data analysis
(EDA) methods including as correlation matrices,
histograms, and boxplots in order to get an
understanding of the ways in which the variables are
connected to one another. It is possible that this will
help in identifying any patterns or trends, as well as
highlighting aspects that are redundant or unneeded.
We will conduct interviews with domain experts in
the subject, such as educational psychologists and
teachers, in addition to doing a study of the most
recent research and concepts in the field. The purpose
of these interviews is to determine the most likely
factors that influence student accomplishment.
Methods for selecting features, such as Chi-square
testing, Recursive Feature Elimination (RFE), and
Mutual Information, will be used in order to further
enhance the feature set. The concept of Mutual
Information is used to quantify the dependency of
variables with the dependent variable, which in this
case is student performance. On the other hand, RFE
is used to reduce the features that are least relevant
according to the performance of the model. The
ICRDICCT‘25 2025 - INTERNATIONAL CONFERENCE ON RESEARCH AND DEVELOPMENT IN INFORMATION,
COMMUNICATION, AND COMPUTING TECHNOLOGIES
748

model will become more accurate and efficient as a
result of these tactics, which will reduce the
complexity of the model and focus on the factors that
are most relevant.
8 MODEL DEVELOPMENT
In order to incorporate the strengths of a diverse
group of different machine learning techniques under
one roof, a hybrid method for the classification
problem will be devised. All these factors data
interpretability, predictive capability, and algorithmic
robustness will be factored in before arriving at the
final decision on the algorithms.
Thus, I will first delve into a number of base
classifiers. These include decision trees, logistic
regression, k-nearest neighbours (KNN), random
forests and support vector machines (SVMs).
Though the potentialities of these algorithms are not
equal across the classification task, and commonly
their execution depends on the complexity and
distribution of the data. Support vector machines
work well in high dimensional spaces, decision trees
are easy to interpret, random forests are suitable for
complex, high dimensional data, and decision trees
are interpretable. These things are all well-known
Boosting and bagging are two examples of ensemble
learning methods that will be used in the construction
of the hybrid model. Through the process of focussing
on samples that have been incorrectly categorized,
boosting techniques like as AdaBoost and Gradient
Boosting will combine numerous weak classifiers
into a robust one. Bagging approaches, on the other
hand, such as Random Forests, would combine the
predictions of several models into a single set in order
to improve generalisability and reduce variation.
The hybrid model also incorporates a stacking
strategy, which is a meta-model that aggregates the
predictions of a number of basic classifiers. This
meta-model is often a neural network or a logistic
regression. The outputs of a large number of
fundamental classifiers will be combined in this meta-
model in order to determine how to get the most
accurate prediction feasible. Due to the fact that it
makes use of the specific skills that each algorithm
has, the hybrid model ought should be able to
anticipate the performance of students with more
precision and reliability than any one algorithm could
do on its own.
9 MODEL EVALUATION AND
TUNING
Once the hybrid vehicle has been developed, it will
undergo extensive testing to see how well it has
performed. It will be used cross validation in order to
avoid overfitting of the training data and guarantee
that the model can generalise well to new data. K-fold
cross-validation involves splitting the data into K
subgroups, training the model K times on each subset,
with the annual performance score being calculated
and averaged. This enables us to have a better
estimation about the accuracy of the model.
Evaluation Metrics. There are a few evaluation
metrics to be utilized to assess the model
performance. Such metrics are accuracy, precision,
recall, F1-score, and the area under the receiver
operating characteristic (ROC) curve (AUC). These
measurements together demonstrate both how
accurate the model is in predicting which students
will do badly, and how precise and recall it is at
identifying those students.
We will also adjust the hyperparameters of the
hybrid model in an attempt to further optimize the
performance of the simulation. So, we will be applied
techniques like grid search or random search to try
different combinations of hyperparameters for the
ensemble method and base classifiers. This helps in
identifying the optimal configuration to fine-tune the
parameters of the model and prevent overfitting.
10 RESULTS
This study proposes a multilevel PHC, which is a
new approach that may provide accurate predictions
about student academic success. C4. This system
comprises three classification algorithms which are
called: 5, CART and random forest (RF). RF, C4. The
six well-known algorithms which we utilized for
examination of our hybrid classifier based on the
research projects we performed were 5, CART,
Support Vector Machine (SVM), Naïve Bayes (NB),
K-Nearest Neighbour (KNN). Many different criteria
are considered when assessing each classifier. These
metrics consist of accuracy’s, precision, F1 score and
recall.
We hope to assess how our PHC compares to
competing algorithms and make our conclusions
accordingly by conducting this study. You will get a
better understanding of the pros and cons of using
such algorithms to predict student achievement by
comparing the performance metrics of the different
Educational Data Mining for Student Performance Prediction: A Hybrid Model Perspective
749

classification algorithms. Beyond its teaching
capabilities, the PHC has many other potential
applications in the fields of deep learning and
machine learning. Hybrid models provide thirty
percent more accurate results than models trained
using a single architecture. The current PHC method
has far superior classification accuracy, F1 score,
and precision versus other classification methods. On
the other hand, both the PHC and C4 measure in terms
of the recall. 5 algorithms doing quite well, the C4.
5 method slightly outperforming the rest. The PHC
algorithm is, however, the best performing
algorithm. Recall (sometimes called sensitivity) is a
metric used to understand how well a model can
correctly identify all positive instances. This figure is
not considering the fact that C4. PHC algorithms and
5 are recommended for use.
Our PHC achieves a 92.40% accuracy rate, which
is superior than all other classifiers. When compared
to other classifiers, RF, C4.5, and CART perform the
best, while SVM and NB perform the worst. Once
again, when it comes to accuracy and F1 score
metrics, the PHC algorithm takes the cake. In
contrast, the RF, C4.5, and CART algorithms surpass
the SVM, NB, and KNN algorithms.
With a score of 79.72%, the NB classifier had the
lowest recall metric among the single classifiers.
Compared to the other classifiers, the SVM classifier
has the lowest F1-score and precision. A 77.18% F1-
score and a 71.57% accuracy were the specific
figures. The SVM classifier may not be the best
option for every job if these performance indicators
are any indication. This might be because the SVM
method isn't designed to deal with the unique
complexity and features of the educational dataset
that was utilized for this study.
Table 1: Performance Measures for All Classifiers.
Measure RF C4.5 CART SVM NB KNN PHC
Recall 85.89 88.32 86.67 84.95 79.72 84.05 87.95
Precision 88.46 81.54 86.15 71.54 80.00 76.92 90.00
F1-score 86.90 81.54 85.55 77.18 79.47 79.81 88.60
Accuracy 91.13 81.54 90.62 86.33 86.33 87.35 92.40
The temporal complexity of each classifier is
shown in Table 2. When compared to the NB
classifier, the KNN classifier has the fastest execution
time. Subsequent classifiers with comparable
execution durations were C4.5, CART, and SVM.
Lastly, when compared to other
classifiers, the RF and PHC classifiers had the
greatest execution time. The reason for this is because
they take more time to produce better results
compared to other single classifiers since they employ
ensemble techniques to determine the accuracy.
Table 2: Execution Time (Seconds) for All Classifiers.
Algorithm RF C4.5 CART SVM NB KNN PHC
Time
(seconds)
2.5271 1.2352 1.3405 1.4561 0.4596 0.4000 3.3283
The education sector stands to benefit greatly
from the results of this study. Predicting student
performance and implementing assistance methods
are both made easier using classification algorithms
like PHC. Because of its predictive power, this
classifier may assist find pupils who could struggle
academically. When that happens, schools will be
able to put their money where it will do the most good
for their pupils. Educational management systems
that include the results of this research may allow for
the real-time monitoring of student development.
Using PHC, schools might foresee possible drops in
student performance and intervene before they spiral
out of control. If this were to happen, pupils would be
ICRDICCT‘25 2025 - INTERNATIONAL CONFERENCE ON RESEARCH AND DEVELOPMENT IN INFORMATION,
COMMUNICATION, AND COMPUTING TECHNOLOGIES
750

able to get immediate assistance in overcoming
academic obstacles. built on the experimental
findings, the PHC is a powerful tool for forecasting
students' academic achievement. It is built on
different classifiers. Our study's findings show that
the PHC may accurately and reliably forecast
outcomes in various classroom contexts.
Consequently, we think it would be a great tool for
school leaders and teachers who want their students
to succeed academically. The PHC takes use of the
combined expertise of many categorization
algorithms to provide a more accurate forecast. When
a sufficiently precise prediction cannot be provided
by a classification method, the PHC shines. Results
from educational categorization tasks have shown
that this method improves accuracy. The results show
that the PHC can hold its own against six different
algorithms. This is why the PHC should be used to its
full potential in order to gauge how well pupils are
doing in class.
11 CONCLUSIONS
The ability to predict student achievement can help
educators and learners alike. An innovative method
of hybrid classification, which has integrated all
positive properties of the RF, C4. This research
discusses into detail about Random Forests, Gradient
Boosting Machines (GBM), XG Boost, and CART
classifiers. Using recall, accuracy, precision, and F1-
score, we compared six classical classification
methods with our proposing hybrid classifier (PHC).
Our results show that the predictions results by PHC
algorithm outperforms individual classification
algorithms. This improvement demonstrates the
usefulness of combining multiple techniques due to
the heterogeneity of educational data. The PHC
classifier’s possible educational uses represent one
potential avenue for future research and
improvement. Based on PHC's capability to predict
how students would do, schools can focus on those
students who would benefit the most from
personalised interventions aimed at improving their
grades. 0293947 However, it also enables for
individualised education, as projected findings used
to design instructional materials and methods are
adapted to the unique needs of each individual
student. The authors established as a conclusion that
acute PHC classifier and other hybrid classification
models could enhance educational predictive
analytics and called on policymakers and educators to
consider using them. These models can give early
indication of students who are at risk of
underperformance and deliver early, specific, and
targeted intervention. Moreover, lawmakers should
invest in the systems and teacher professional
development that are critical to enabling these
cutting-edge analytical tools to be effectively used in
the classroom. By using data, insight-focused
approaches can help institutions optimise their
resource allocation and transform student outcomes.
REFERENCES
A. M. Shahiri, W. Husain, N. A. Rashid, A review on
predicting student’s performance using data mining
techniques, Proc. Comput. Sci., 72 (2015), 414–422.
A.Dinesh Kumar, Dr.V.Radhika,” A Survey on Predicting
Student Performance”, International Journal of
Computer Science and Information Technologies
(IJCSIT), Vol 5.
D.M West, “Big Data for Education: Data Mining, Data
Analytics, and Web Dashboards,” Government
Stud.Brook US Reuters, 2012
J. John Kennedy, R. Pandi Selvam, “Cloud-Centric IoT
based Decision Support System for Gestational
Diabetes Mellitus using Optimal Support Vector
Machine”, International Journal of Recent Technology
and Engineering (IJRTE) ISSN: 2277-3878, Volume-8,
Issue-1, May 2019.
Jiawei Han, Micheline Kamber, Jian Pei,” Data Mining
Concepts and Techniques”, 3rd Edition.
L. Breiman, Random forests, Mach. Learn., 45 (2001), 5–
32.
M. Bramer, Principles of Data Mining, London: Springer,
2020.
P. Cortez, A. M. G. Silva, using data mining to predict
secondary school student performance, EUROSIS-ETI,
10 (2008), 5–12.
Q. Ma, Z. Liu, T. Zhang, S. Zhao, X. Gao, T. Sun, et al.,
Multielement simultaneous quantitative analysis of
trace elements in stainless steel via full spectrum laser-
induced breakdown spectroscopy, Talanta, 10 (2024),
125745.
R. C. Morilla, R. D. Omabe, C. J. S. Tolibas, E. E. C.
Cornillez Jr, J. K. D. Trecene, Application ˜ of machine
learning algorithms in predicting the performance of
students in mathematics in the modern world, TARAN-
AWAN J. Educ. Res. Technol. Manag., 1 (2020), 49–
57.
R.Swathi, N.Pavan Kumar, L.KiranKranth, “Systematic
Approach on Big Data Analytics in Education
Systems”, International Conference on Intelligent
Computing and Control Systems (ICICCS), 2017.
S. Finlay, Predictive analytics, data mining and big data:
Myths, misconceptions and methods, Hampshire:
Palgrave Macmillan, 2014.
University of California, Irvine, School of Information and
Computer Sciences, UCI Machine Learning
Repository, 2019.
Educational Data Mining for Student Performance Prediction: A Hybrid Model Perspective
751

W. J. Dixon, Simplified estimation from censored normal
samples, Ann. Math. Stat., 10 (1960), 385–391.
W. Liu, Y. Fang, H. Qiu, C. Bi, X. Huang, S. Lin, et al.,
Determinants and performance prediction on
photocatalytic properties of hydroxyapatite by machine
learning, Opt. Mater., 146 (2023), 114510.
ICRDICCT‘25 2025 - INTERNATIONAL CONFERENCE ON RESEARCH AND DEVELOPMENT IN INFORMATION,
COMMUNICATION, AND COMPUTING TECHNOLOGIES
752
