
Analysis of Market Demand and Skills of Product Manager
Zijing Wu
Computer Science and Technology, Xiamen University Malaysia, Sepang, Malaysia
Keywords: Salary Structure, Human Capital, Market Demand Analysis, Regression Modeling.
Abstract: This paper analyzes the determinants of salary levels in the modern labor market and focuses on the product
manager position. Based on over 10,000 job postings from four major cities in China, this paper investigates
the impact of education, work experience, company size, and city on salary levels. Through data
preprocessing, dummy variable transformation, and multiple linear regression analysis, the study identifies
clear patterns: salary levels increase with higher educational attainment and longer work experience;
first-tier cities offer significantly higher wages than lower-tier ones; and larger enterprises generally provide
better compensation structures. The city and work experience variables explain the most variance of salary
differences, followed by education and company size. In addition, the analysis reveals that there are
structural wage advantages for the bachelor's degree, three to five years of experience, large company
employment, and city locations in Shenzhen and Shanghai, respectively. The study shows that salary
formation is layered and not linear. Both theoretical and practical implications are provided. For employers,
the results can guide employers to improve their hiring and retaining strategies. For job seekers, the results
provide evidence based on their employment plans.
1 INTRODUCTION
In the digital age, the changing demand in the market
creates new opportunities and challenges for the
enterprise every day. Companies face the challenge
of fulfilling customers' needs more effectively and
staying up to date with the technological world. The
role of the product manager (PM) is of vital
importance since the manager connects technology,
business, and the user, making sure that the product
follows the market and the company's needs. As
digital transformation accelerates, product managers
are expected to go beyond functional delivery - they
are now responsible for leading cross-functional
teams, shaping product vision, and making strategic
decisions in an uncertain environment. Luchs, Swan,
and Griffin (2022) describe this shift as a form of
form of 'perceptual shaping' where product managers
interpret weak signals from different stakeholders
and markets to proactively guide product innovation.
This redefinition of the product manager's role
positions them as key coordinators of digital value
creation (Luchs et al., 2022).
The role of PMs has broadened due to the rapid
pace of change in the Internet industry. Historically,
PMs' focus on requirement management and
coordination has widened to encompass data
analysis, business strategy, and constant
improvement. According to McKinsey, the reliance
on data for both decision-making and the need to be
customer-centric have greatly extended the role of
the PM and made it a requisite in all . This is an
important realization for PMs that they must possess
an even broader skillset, one that transcends
technical skills to include strategy. And it is this
realization that also compels organizations to expect
PMs not only to help ensure a product fits the
market, but also to drive innovation and long-term
business success (McKinsey, 2017).
Persistent frictions exist in the supply and
demand dynamics of the product manager (PM)
labour market. Job seekers often face challenges
interpreting job descriptions that lack clarity or
contain conflicting requirements. Conversely,
employers find it difficult to select job candidates
with the right skill sets and experiences. Humburg
and van der Velden have in discrete choice
experiments shown that employers prefer CV
attributes that signal high levels of
occupation-specific human capital, e.g. relevant
work experience and that the job seeker's education
and job tasks. Yet, employers' preferences differ and
Wu, Z.
Analysis of Market Demand and Skills of Product Manager.
DOI: 10.5220/0013860400004719
Paper published under CC license (CC BY-NC-ND 4.0)
In Proceedings of the 2nd International Conference on E-commerce and Modern Logistics (ICEML 2025), pages 757-765
ISBN: 978-989-758-775-7
Proceedings Copyright © 2025 by SCITEPRESS – Science and Technology Publications, Lda.
757

generic job postings might impair the clear
specification of skills required. The resulting
misalignment between job seekers and employers'
preferences and job seekers' lack of information on
employers' preferences in the PM labour market
constitutes an information friction (Humburg et al.,
2015).
Moreover, the variation in compensation due to
factors such as job type, working environment, and
individual background makes it more challenging for
both job seekers and recruiters to plan effective
career paths and recruitment strategies. Gazi
conducted an empirical study on industrial workers
and found that job satisfaction—which is influenced
by factors including experience, job roles, and
workplace conditions—has a significant impact on
employee behavior and performance. While higher
compensation may correlate with enhanced
satisfaction and productivity, this relationship is also
shaped by the structure and scale of the employing
organization. For job seekers, especially in technical
roles like product managers, understanding these
variables is essential for making informed decisions;
for organizations, they offer insights for building
more effective incentive strategies (Gazi et al.,
2024).
Against this backdrop, data-based recruitment
seems to be a panacea for finding prospective
employees among job seekers. Job posting data and
analytics help companies refine job postings and
identify potential job candidates. Peoplebox said that
mining data to attract employees will help
companies fill job vacancies more efficiently and
hire better talent through job seekers' data and
analytical results to fulfill job roles. For product
managers, this approach helps identify
high-frequency skill requirements and map out
targeted learning paths to remain competitive in the
job market (Peoplebox, 2024).
In response to these practical needs, this study
systematically analyses the recruitment data for
product manager positions on the BOSS Direct
platform. By extracting and processing more than
10,000 job postings from 17 major cities, this study
quantitatively examines the impact of four core
variables: city, education level, work experience and
company size on salary outcomes. Through
structured preprocessing and regression modelling,
this study constructs a data-driven framework that
reveals the valuation logic behind product manager
positions in the digital age.
This study aims to explore the impact of four
dimensions, namely education level, work
experience, city level, and company size, on the
compensation level of product managers, and
identify key patterns and thresholds that affect career
development. Specifically, the study will analyze the
salary differences at different educational levels
(from undergraduate to master's), identify key career
turning points such as 3-5 years of work experience,
and evaluate the relationship between salary
differences between city level and company size.
The research results will provide data support for job
seekers to plan their career development paths, while
helping companies develop evidence-based
recruitment and compensation strategies, thereby
optimizing the matching efficiency of talent supply
and demand in the rapidly developing labor market
of the digital age.
2 LITERATURE REVIEW
2.1 Core Concepts of Market Demand
Salary level is an important indicator in the labor
market that reflects the value of positions and the
intensity of human resource demand. What is
implied behind it is the real market demand for
different types of talent. In the modern recruitment
market, enterprises' demand for talent is no longer a
single-dimensional match but a systematic choice
based on multiple factors such as comprehensive
quality, regional adaptation, job ability, and
experience accumulation. At this level, salary is a
holistic indicator that reflects not only individual
attributes but also certain structural characteristics of
the market. That is, can always find four basic
variables, i.e., city, education, working experience,
and company size, which have obvious impacts on
salary. These four aspects are the basis of analysis of
this study, attempt to empirically verify their impacts
on salary and construct a quantitative model to
evaluate the valuation of talents in a market-oriented
environment.
As a spatial unit with highly concentrated
economic resources and opportunities, cities
naturally play a decisive role in job distribution and
salary setting. First-tier cities usually provide higher
job salaries due to their high industrial density, large
number of positions, and fast development pace.
Still, they also correspond to higher competition
thresholds and ability requirements. In comparison,
second- and third-tier cities offer relatively lower
salary levels and job density, but feature lower entry
barriers and less competition, making them attractive
to junior professionals. These differences reflect the
layered structure of urban employment markets.
ICEML 2025 - International Conference on E-commerce and Modern Logistics
758

Therefore, the salary differences between different
cities reflect both the heterogeneity of regional
economic structures and the dynamic game between
job demand and talent supply. Recent empirical
studies confirm this logic, for instance, urban wage
premium research based on Chinese data shows that
larger cities provide significantly higher wages due
to agglomeration effects and industrial density (Liu
et al., 2024). In addition, income disparity across
cities is also shaped by labor market segmentation,
which creates persistent structural barriers between
different classes of jobs and regions (U.S. Census
Bureau, 2023).
As an important indicator for measuring
individual human capital investment, academic
qualifications have always been one of the core
dimensions for enterprises to screen talent. However,
as the market pays more attention to practical ability
and mastery of technical tools, academic
qualifications are no longer the only variable that
determines salary. Especially in cross-border and
complex positions such as product managers, the
"basic skills" and "basic operational capabilities"
required for the position have gradually become
important bases for companies to evaluate whether
talents are competent. Therefore, companies not only
pay attention to academic background, but also tend
to cultivate basic capabilities with job adaptability to
meet their market-oriented development needs.
Worakitjanukul conducted an empirical analysis
of a large sample of data from different regions in
Thailand and pointed out that education level and
work experience have a significant positive impact
on salary level changes, especially in cities, where
workers with higher education and richer experience
receive higher remuneration (Worakitjanukul, 2018).
This study provides an important empirical basis for
this article to explore the role of education and
experience on salary.
Working years represent the accumulation of
experience and the improvement of job proficiency.
When recruiting, companies usually set clear
experience thresholds, such as "3-5 years as a
turning point", to determine whether candidates have
the potential to move from execution to
management. From the perspective of salary
structure, years of experience are often positively
correlated with salary, but whether its marginal
effect continues to increase still needs to be analyzed
in combination with job type and company structure.
Company size also plays an important role in the
recruitment and compensation system. AmorServ
pointed out in its research report that large
enterprises tend to establish more systematic job
classification systems and salary standards due to
their abundant funds and clear management levels.
In contrast, small and medium-sized enterprises
focus more on immediate performance and
short-term returns (AmorServ, 2024). This research
result verifies the hypothetical logic of "the larger
the company size, the higher the salary" proposed in
this article, and highlights the deep impact of the
company's organizational structure on the
formulation of compensation policies.
In summary, city, education, years of work, and
company size, as the four core factors affecting
salary, jointly construct an evaluation system for
talent value in the labor market. Understanding the
inherent logic and interactive relationship of these
variables is of great significance for revealing the
talent supply and demand structure and
compensation mechanism.
2.2 The Role of Market Demand
Analysis
In a recruitment market with highly asymmetric
information, market demand analysis is not only a
tool for understanding employment trends but also a
bridge to link job supply and talent resources. For
employers, accurately grasping the changing trends
of the market's requirements for job capabilities,
education levels, and experience will help optimize
job descriptions, adjust salary strategies, and
improve recruitment efficiency. Especially in highly
competitive positions such as product managers,
companies can make more targeted talent selection
decisions by analyzing talent portraits through
data-based means.
From the employer's internal operations
perspective, companies also establish targeted
capability training systems and salary incentive
structures through demand analysis. As a typical
capability-oriented position, the salary of product
managers is not only a reflection of labor income but
also an evaluation tool for their performance and
potential. Therefore, companies often set up a more
targeted salary structure based on "actual work
performance" and "position adaptation degree",
thereby effectively stimulating the initiative and
growth of talents. Through the feedback of this
incentive mechanism, companies can promote the
continuous growth of high-performance positions
and optimize the overall human resource allocation.
In recent years, AI has been increasingly used in
human resource management to improve recruitment
accuracy and organisational efficiency.Akhter,
Bhattacharjee and Hasan state that AI systems help
Analysis of Market Demand and Skills of Product Manager
759

to screen candidates, match skills to job
requirements and reduce human bias in recruitment
decisions. They further highlight that the use of AI is
particularly effective in recruitment and performance
assessment, where data-driven systems have begun
to replace intuition-based decision-making, thus
aligning with the broader goal of market demand
analysis in optimising talent allocation (Akhter et al.,
2024).
Meanwhile, for job seekers, market demand
analysis has a clear career guidance function. By
understanding the job density and salary levels in
different cities, individuals can plan their career
paths more reasonably; by mastering the relationship
between education and salary, targeted human
capital investment can be made; and understanding
the size and development stage of different
companies will help job seekers weigh the
relationship between short-term returns and
long-term development and make choices that are
more in line with personal development goals.
At the macro level, market demand analysis
provides real and dynamic data support for
policymakers such as governments and educational
institutions. On the one hand, it can assist in
optimizing the educational structure and alleviating
the mismatch between talent training and market
demand; on the other hand, it can also serve as an
important basis for regional human resource
planning and promote the balance of employment
structure between regions.
It is in this context that this study analyzes actual
recruitment data, quantifies the key variables that
affect salary levels, and proposes targeted
suggestions based on job attributes, hoping to build a
data-driven talent matching path between theory and
practice.
3 METHODOLOGY
3.1 Modelling
To study the impact of different cities, education,
work experience, and company size on salary levels,
this paper constructs the following multiple linear
regression model:
εγ
βββ
β
α
+
++++
+=
Controls
CityScaleYears
EducationSalaryAverage
432
1
(1)
In this model, Average Salary is the dependent
variable, indicating the median monthly salary (unit:
K/K/month). The explanatory variables are defined
as Table 1.
Table 1: Variable settings.
Variable Definition
Education
Minimum education requirement for
the position (e.g., college, bachelor's,
master's, no requirement). The
reference group is "bachelor's
degree".
Years
Required work experience (e.g., no
experience, 1–3 years, 4–5 years, 6–
10 years). The reference group is "1–3
years".
Scale
Company size (10, 60, 300, 700,
5000, 10000 employees, etc.). The
reference group is "300 people".
City
Company size (10, 60, 300, 700,
5000, 10000 employees, etc.). The
reference group is "300 people".
Controls
Job categories (e.g., technical,
marketing, management), used to
control structural effects from
different industries.
ε
The error term, representing
unexplained variation not captured by
the model.
The model aims to evaluate the marginal impact
of the above core variables on the salary level. The
categorical variables, such as education level and
city level, are converted into 0/1 binary variables
through dummy variables. The values of the
reference group are all 0, and the values of the
remaining variables are 1 for "belonging to this
category" and 0 for "not belonging to this category".
The reference group is selected (for example, Beijing
is the reference group for the city, and undergraduate
degree is the reference group for education level),
and the remaining variables are converted into
dummy variables and added to the model. Since the
job salary is continuously distributed, ordinary least
squares (OLS) is used for regression modeling. In
addition, some control variables (such as job type,
etc.) are also considered in the model setting to
reduce the omitted variable bias.
3.2 Data Source
The data in this study comes from the BOSS direct
recruitment data. From April to May 2024, more
than 10,000 product manager jobs postings in 17
ICEML 2025 - International Conference on E-commerce and Modern Logistics
760
first- or second-line cities in China(such as Beijing,
Shanghai, Guangzhou, Shenzhen, Chengdu,
Hangzhou, etc.)are scraped. The variables include
job title, company name, salary range, education
requirement, experience requirement, skill
keywords, company size, job benefits, and location,
etc.
This paper designed a customized data collection
script in Python ( Selenium + EdgeDriver) to
simulate the browsing behavior of users and scrape
the front-end content through XPath. After data
mining, several cleaning steps were implemented by
us removing the HTML tags and other unstructured
characters; dealing with missing values by mean
imputation or deletion, parsing salary range to
extract the minimum and maximum value by regular
expression, then computing the median salary as one
indicator and applying the jieba word segmentation
package to extract high-frequency keywords as the
skill and benefits indicators. Additionally, text fields
such as education and city were converted into
dummy variables, and company size and experience
fields were standardized to ensure consistency for
modeling.
To prepare the dataset for regression analysis,
must make some transformations since the two
categorical variables are not numeric, so converted
them into dummy variables. In this transformation,
“bachelor's degree” was used as the reference
group for education, and “Beijing” for the city.
This paper converted each remaining category into a
column taking values 0 or 1. By doing this, added
qualitative variables into a quantitative model, which
enhanced the statistical robustness and
interpretability of our regression analysis.
4 R ESULT ANA LYSIS
4.1 Descriptive Statistical Analysis
This study focuses on the four core variables of
education, city, work experience, and company size,
and conducts descriptive statistics and variance
analysis on the differences in job salaries (ANOVA
tests are significant, p < 0.001), revealing the key
influence of various factors in the workplace
structure on salary formation.
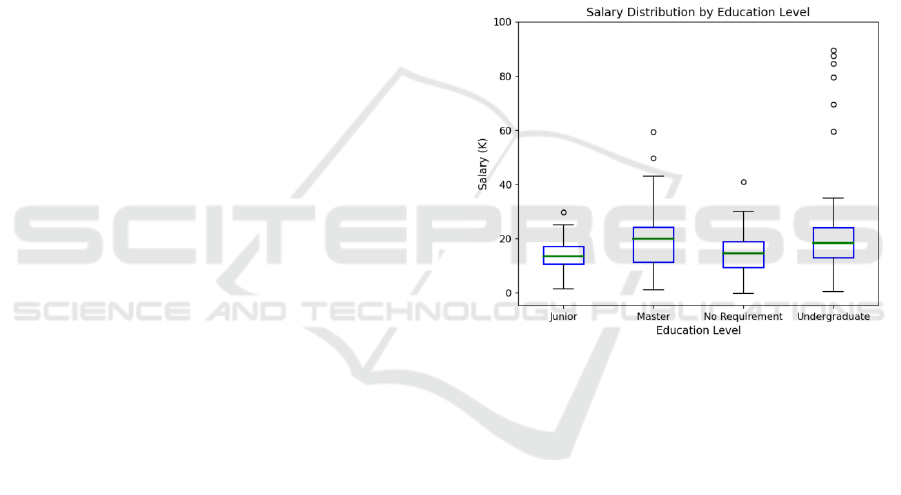
In terms of education, salary levels increase with
the improvement of education. Masters (19.89K) and
bachelor's degrees (18.31K) are significantly higher
than those with no requirements (14.63K) and
college degrees (13.64K). Among them, bachelor's
degrees are 4.67K higher than college degrees (p <
0.001), and master's degrees are 6.25K higher than
college degrees (p < 0.001), with significant
differences. However, there is no significant
difference between master's and bachelor's degrees
(p = 0.36).
Additionally, the salary distribution for the
master's group shows the greatest variability, with a
standard deviation of approximately 9.04 K,
indicating a broad range of job levels. In contrast,
the junior college group exhibits the most
concentrated distribution (standard deviation 5.90
K), reflecting a more homogeneous salary structure.
These patterns are clearly illustrated in Figure 1,
where the wider interquartile range and more
numerous outliers for the master's and undergraduate
groups underscore their broader salary dispersion.
Figure 1: Salary distribution by education level.
At the city level, the overall salary distribution
shows a clear gradient. Shenzhen (21.14K),
Shanghai (20.98K), and Beijing (20.96K) are in the
first echelon, significantly higher than other cities (p
< 0.001), and the difference between the three is not
significant (p = 1.0). Hangzhou (17.37K) and
Nanjing (16.03K) are in the middle layer;
Guangzhou (15.85K), Chengdu (14.76K), and
Chongqing (12.75K) have relatively low salaries,
and the largest gap between Shenzhen and
Chongqing is 8.39K (+65.8%). It is worth noting that
although Guangzhou is a first-tier city, its salary
performance is relatively weak. Regionally, it
presents the characteristics of "tiered distribution
within the Yangtze River Delta, Chengdu in the
Chengdu-Chongqing region is higher than
Chongqing"; in terms of salary fluctuations,
Shanghai has the largest standard deviation (9.05K)
and Nanjing is the most concentrated (4.95K),
suggesting that most jobs in the city offer salaries
Analysis of Market Demand and Skills of Product Manager
761
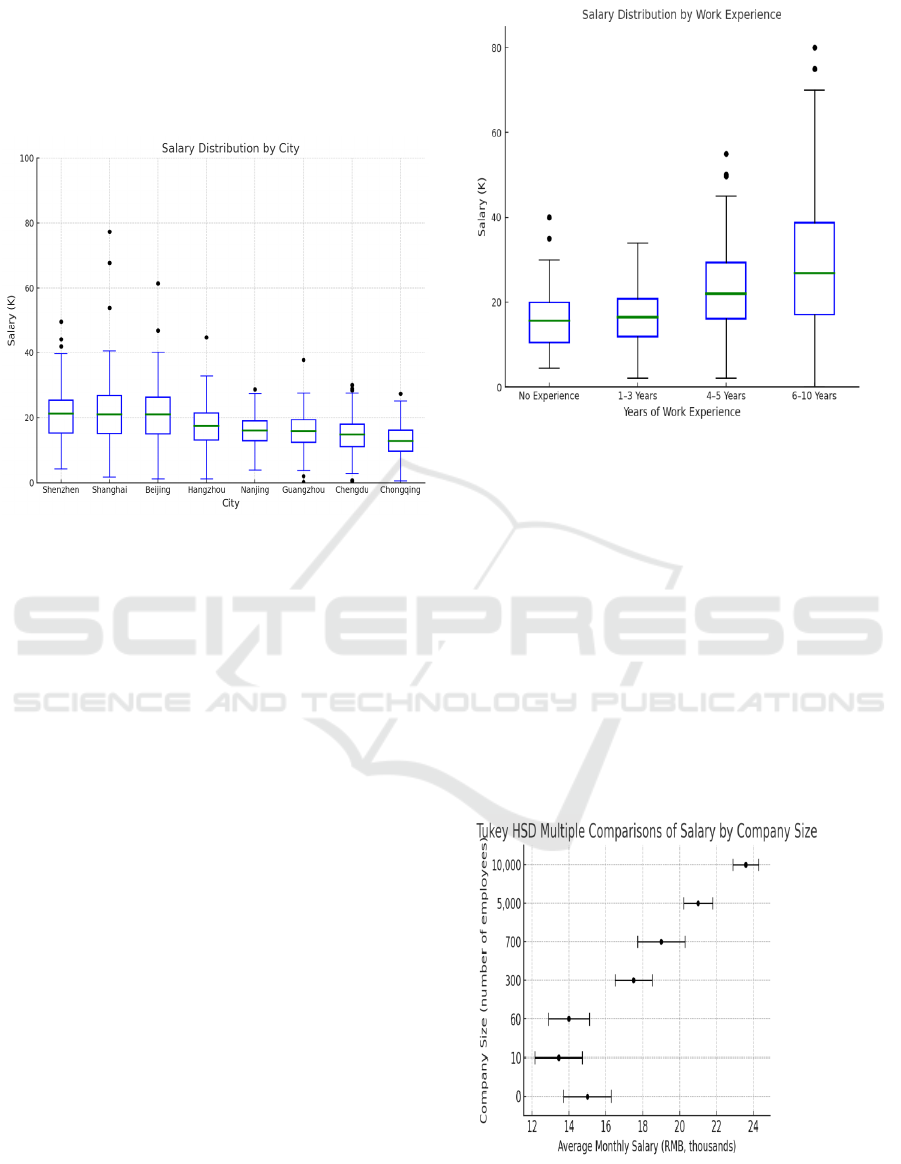
closer to the media. These disparities in both central
tendency and dispersion are reflected in the box plot
shown in Figure 2, where outliers and interquartile
ranges further illustrate city-specific wage
characteristics.
Figure 2: Salary distribution by city.
In terms of work experience, salary increases
significantly with years of experience, from 15.67K
for no experience to 26.83K for 6-10 years of
experience, with a cumulative increase of more than
71%. Tukey test shows that salary growth is mainly
concentrated in the two stages of "1-3 years" to "4-5
years" (+5.58K, p < 0.001) and "4-5 years" to "6-10
years" (+4.78K, p = 0.043), while the difference
between "1-3 years" and "no experience" is not
significant (p = 0.604), indicating that the marginal
effect of initial experience accumulation is limited.
These patterns are clearly illustrated in Figure 3,
where the 6–10 years group shows both the highest
median salary and the widest distribution, with
numerous outliers indicating high-paying senior
roles. In contrast, the 1–3 years group presents the
most concentrated salary structure (standard
deviation: 6.64 K), while the 6–10 years group
exhibits the greatest variation (SD: 17.87 K).
Overall, 3-5 years is the key turning point for a
salary jump, and senior positions have greater salary
elasticity.
Figure 3: Salary distribution by work experience.
In terms of company size, salaries vary
significantly between companies of different sizes,
with an average increase of nearly 10K from 13.44K
for companies with 10 employees to 23.59K for
companies with 10,000 employees (F = 34.57, p <
0.0001). The scale of 300 employees is a key
dividing point, with salaries significantly higher than
those of companies with 60 or fewer employees (p <
0.05); salaries of super-large companies with more
than 10,000 employees are significantly higher than
those of all other groups (p < 0.001), reflecting their
strong capacity to attract talent and offer higher-level
positions.
Figure 4: Tukey HSD multiple comparisons of salary by
company size.
ICEML 2025 - International Conference on E-commerce and Modern Logistics
762

In contrast, the salaries of micro-enterprises, with
10 employees are significantly lower. Interestingly,
the analysis also reveals nonlinear patterns — for
example, companies with 0 employees (e.g.,
self-employed entrepreneurs) report higher average
salaries than some small firms, possibly due to
equity incentives or profit-sharing mechanisms.
Meanwhile, there are no significant differences
between 700 and 5,000 people, and between 300 and
700 people, indicating that the salary structure of
some medium and large companies tends to be stable,
as shown in Figure 4.
In summary, education, city, work experience,
and company size all significantly affect salary
levels, showing hierarchical distribution and phased
premium characteristics. Among those with a
bachelor's degree, 3-5 years of experience,
companies with 300 or more employees, and
first-tier cities, job salaries are significantly better
than other groups, highlighting their structural
advantages in the current workplace.
4.2 Regression Results Analysis
To further explore the impact of variables such as
education, city, years of work, and company size on
salary, this study constructed a multivariate linear
regression model and employed ordinary least
squares (OLS) estimation. The results are presented
in Table 2, Table 3, and Table 4. The model fits
well, and the explanatory power and statistical
significance of key variables are high. Under the
condition of controlling other variables, years of
work have a significant positive impact on salary
(coefficient is 1.61, p < 0.001), indicating that for
every two years of work experience, the average
salary will increase by about 1.6K, verifying the
market premium effect of experience accumulation.
The company size variable also shows statistical
significance (coefficient is 0.00065, p < 0.001), but
the impact is low, indicating that the larger the scale,
the slightly higher the salary, but the actual increase
is smaller, indicating that although the scale is
significant, the actual explanatory power is limited.
In terms of educational background, with
bachelor's degree as the reference group, the
regression results show that the salary of those with
a master's degree is slightly higher than that of those
with a bachelor's degree (coefficient is 0.2991, p =
0.0078), while the salary of those with a junior high
school degree and a college degree is significantly
lower than that of those with a bachelor's degree
(respectively –1.3826, p < 0.001; –0.2391, p ≈
0.93), reflecting that higher education has certain
salary advantages in the workplace, but the
difference between a master's degree and a
bachelor's degree is not significant after controlling
other factors.
Table 2: Impact of work experience, company size, and city on salary.
Coeffi
cient
Stan
dard
Erro
r
T
Stat
P-va
lue
Lowe
r 95%
Upp
er 95%
Low
er Limit
95%
Up
to 95%
Interce
p
t
12.405
9
0.40
05
30.9
7604
6.2E
-174
11..6
2048
13.1
9132
11.6
2048
13.1
9132
Years
1.5623
91
0.08
9803
17.3
9804
1.88
E-63
1.386
279
1.73
8502
1.38
6279
1.73
8502
Scale
0.0005
67
5.45
E-05
10.4
0437
9.31
E-25
0.000
46
0.00
0673
0.00
046
0.00
0673
Shang
hai
3.0187
13
0.46
4786
6.49
4848
1.03
E-10
2.107
226
3.93
02
2.10
7226
3.93
02
Nanjin
g
-1.590
49
0.69
021
-2.3
0435
0.02
13
-2.94
406
-0.2
3692
-2.9
4406
-0.2
3692
Chong
qing
-4.366
78
0.49
7151
-8.7
8362
3.21
E-18
-5.34
174
-3.3
9182
-5.3
4174
-3.3
9182
Hangz
hou
-0.335
07
0.48
5295
-0.6
9045
0.48
999
-1.28
678
0.61
6638
-1.2
8678
0.61
6638
Shenz
hen
3.2038
34
0.49
5118
6.47
0842
1.21
E-10
2.232
861
4.17
4806
2.23
2861
4.17
4806
Guang
zhou
-1.793
45
0.55
9216
-3.2
0709
0.00
1361
-2.89
013
-0.6
9678
-2.8
9013
-0.6
9678
The city effect is also quite significant. Taking
Beijing as the benchmark, Shenzhen (coefficient =
3.0833, p < 0.001) and Shanghai (coefficient =
3.0181, p < 0.001) are significantly higher than
Analysis of Market Demand and Skills of Product Manager
763

Beijing, indicating that the salary premium of
first-tier cities is still significant after controlling
other variables; while the coefficients of Nanjing,
Chongqing, Chengdu and other places are all
negative and p < 0.05, showing their salary
disadvantages compared with Beijing, further
highlighting the impact of regional development
imbalance on salary levels.
From the perspective of the overall regression
model, the p-values of each variable are generally
significant, indicating that education, experience,
scale, and city all play an important role in
explaining salary changes. Among them, work
experience and city effects contribute the most,
while education and company scale have relatively
weak effects after controlling other factors, showing
the salary structure characteristics of "strong
experience, strong region, weak education, and small
scale".
Table 3. Impact of work experience, company size, and education on salary
Coefficient
Standard
Error
T Stat P-value
Lower
95%
Upper
95%
Lower
Limit 95%
Up to 95%
Intercept 12.67714 0.340618 37.21805 1.6E-233 12.00916 13.34512 12.00916 13.34512
Years 1.565106 0.095349 16.41446 4.46E-57 1.378118 1.752094 1.378118 1.752094
Scale 0.000607 5.71E-05 10.62638 9.92E-26 0.000495 0.000719 0.000495 0.000719
Junior -3.18256 0.489342 -6.50375 9.75E-11 -4.1422 -2.22291 -4.4122 -2.22291
Master 2.93691 0.872881 3.364618 0.00078 1.225113 4.648706 1.225113 4.648706
No
re
q
uirement
-1.23915 1.180281 -1.04988 0.293895 -3.55378 1.075487 -3.55378 1.075487
Table 4: Baseline model with work experience and company size
Coeffi
cient
Stan
dard
Erro
r
T
Stat
P-va
lue
Low
er 95%
Upp
er 95%
Low
er Limit
95%
Up
to 95%
Inter
ce
p
t
12.192
49
0.32
2377
37.8
2058
1.7E
-239
11.5
6028
12.8
247
11.5
6028
12.8
247
Year
s
1.6058
49
0.09
5239
16.8
6131
6.02
E-60
1.41
9078
1.79
2621
1.41
9078
1.79
2621
Scale
0.0006
54
5.74
E-05
11.3
798
3.66
E-29
0.00
0541
0.00
0766
0.00
0541
0.00
0766
5 CONCLUSIONS
In the context of the ever-changing development of
the digital economy, the position of product manager
plays the role of a bridge connecting user needs,
technology implementation, and business strategy,
and becomes an important engine for enterprises to
promote product innovation and respond to the
market quickly. This paper takes the product
manager position as the research object, based on the
large-scale recruitment data of BOSS Direct
Recruitment Platform, builds a regression framework
that centers on four critical variables: city, education,
work experience, and company size, and
systematically explores the influence path and
interaction mechanism of these variables on the
salary level.
The results of the study show that city and work
experience are the most significant factors affecting
salary differences, with 3–5 years of experience
often marking a distinct inflection point in career
progression; academic qualifications still have
structural value, and those holding at least a
bachelor's degree tend to enjoy a notable wage
premium in the market; and company size is
reflected as a systematic advantage of the salary
system and career stability. In large companies in
Tier 1 cities, job seekers with a mid-to-high level of
education and key experience thresholds are more
likely to have significant salary returns and career
advancement opportunities. These findings not only
highlight the layered nature of the digital labor
market, but also reflect the deep game of human
ICEML 2025 - International Conference on E-commerce and Modern Logistics
764

capital, regional resources and organisational
systems behind the pay structure.
Further, the study not only provides quantitative
evidence, but also responds to the structural
problems of 'mismatch' and 'information asymmetry'
in the real market. When job seekers face the
dilemmas of skill prioritisation and ambiguous job
descriptions, it is often difficult for them to precisely
interpret what employers are truly seeking; while
enterprises may also miss out on highly matching
talents due to unclear job definitions and irrationally
set experience thresholds. Through quantitative
analysis of recruitment data, this paper constructs a
coherent reasoning path linking market expectations
to salary outcomes, which provides practical support
for improving the accuracy of job seekers' career
planning and the efficiency of corporate recruitment.
In terms of methodology, this paper integrates
web crawlers, natural language processing, and
statistical modelling techniques, effectively
translates a large corpus of unstructured recruitment
text into measurable analytical features. This
technical path not only breaks through the
dependence of traditional job analysis on
questionnaires, interviews, and other methods, but
also holds strong potential for adaptation across roles
and platforms. In the future, if combined with
in-depth semantic mining, industry classification
models or time series modelling, it is expected to
further portray the trend of skills evolution and
dynamic changes in job demand, thus realizing
data-driven career ecology research in the true sense.
From a broader perspective, the structural laws
revealed in this paper are not only applicable to
product manager positions but also provide
theoretical references for understanding the value
composition of high-knowledge and
high-technology-intensive occupations in the context
of the new era. In today's world, where companies
are constantly pursuing agile innovation and
high-quality growth, job pricing is no longer just a
linear function of experience and education, but a
synergistic game between corporate strategic goals,
organisational structure, and talent ecosystem. Salary
is often a reflection of the organisational
expectations of a position and its criticality in the
value chain.
Therefore, the significance of this paper is that it
not only responds to the individual's confusion about
the reality of career development paths but also
provides a basis for organisations to optimise the
allocation of human resources and build a scientific
and reasonable job system. More importantly, it
shows how human resource management and career
planning can achieve more efficient docking and
synergy under the data-driven logic, and promote the
employment market from 'empirical judgement' to
'intelligent matching', to better serve the dynamic
adaptation of people and jobs in the digital society.
The dynamic matching between people and jobs in
the digital society will be better served.
REFERENCES
Akhter, F., Bhattacharjee, A., & Hasan, A., 2024.
Application of artificial intelligence in human resource
management: A Bangladesh perspective. Munich
Personal RePEc Archive (MPRA).
AmorServ, 2024. 7 factors to consider when determining
the salary of developers in 2024.
Gazi, M. A. I., Yusof, M. F., Islam, M. A., Amin, M. B., &
Senathirajah, A. R. S., 2024. Analyzing the impact of
employee job satisfaction on their job behavior in the
industrial setting: An analysis from the perspective of
job performance. Journal of Open Innovation:
Technology, Market, and Complexity, 10(4), 100427.
Humburg, M., & van der Velden, R., 2015. Skills and the
graduate recruitment process: Evidence from two
discrete choice experiments. Economics of Education
Review, 49, 24-41.
Liu, Y., Zhang, M., & Fang, H., 2024. Trade liberalization,
city size, and urban wage premium: Evidence from
China. Nature Humanities and Social Sciences
Communications, 11(1), 26.
Luchs, M. G., Swan, S., & Griffin, A., 2022. How product
managers use senseshaping to drive the front-end of
innovation. Research-Technology Management, 65(1),
30-39.
McKinsey & Company, 2017. Product managers for the
digital world.
https://www.mckinsey.com/capabilities/mckinsey-digit
al/our-insights/product-managers-for-the-digital-world
Peoplebox, 2024. The ultimate guide to data driven
recruitment strategies.
U.S. Census Bureau, 2023. Labor market segmentation
and the distribution of income (CES-WP-23-41).
Worakitjanukul, P., 2018. The effect of education and
experience on wages: The case study of Thailand.
American Journal of Industrial and Business
Management, 8, 159-172.
Analysis of Market Demand and Skills of Product Manager
765
