
Exploring Determinants of Traffic Accident Severity Using Empirical
Data
Danying Wei
SWUFE-UD Institute of Data Science at SWUFE, Southwestern University of Finance and Economics, Chengdu, China
Keywords: Traffic Accident, Data-Driven Approach, Ordinary Least Squares, Random Forest Regression.
Abstract: Traffic accidents have become a major global public safety concern, as they affect individuals and their
families and hinder the development of a country’s economy. This study uses empirical data from Nashville
to investigate the influence of individual characteristics and external environmental factors on the severity of
traffic accidents. A multiple linear regression model and a nonlinear model are employed to examine the
relationships between accident severity and various factors, including periods, weather conditions,
illumination, collision types, and hit-and-run behaviour. The results indicate that accidents occurring during
early morning, evening, and night are more severe; weekend accidents are more serious than weekday
accidents. Interestingly, severe weather such as snow and blowing snow reduces accident severity, while
foggy and cloudy conditions increase it. Poor visibility conditions, such as darkness, dawn, and dusk,
significantly elevate accident severity. Moreover, head-on collisions and hit-and-run behaviour are strongly
associated with more severe outcomes. These findings contribute to improving traffic safety policies and
provide practical implications for accident prevention. Future studies may consider incorporating more
complex models and a broader range of variables to enhance predictive performance and policy relevance.
1 INTRODUCTION
Traffic accidents and safety have long been issues of
great concern to people worldwide. According to data
released by the World Health Organization,
approximately 1.35 million people die in traffic
accidents each year, and tens of millions more suffer
varying degrees of injury (World Health
Organization, 2021). In many countries, road traffic
accidents have become the leading cause of death for
young people aged 15 to 29 (World Health
Organization, 2021). The occurrence of traffic
accidents not only has a significant impact on
individuals and families, but the property losses,
damage to public facilities, and public panic they
cause will, to a certain extent, hinder urbanization and
national economic development. Therefore, how to
effectively identify and control the key influencing
factors that lead to traffic accidents, especially serious
accidents, has become one of the core issues in
current global traffic governance.
In the relevant research on traffic accidents, most
scholars focus on accident prediction, detection, and
the impact of individual variables on accidents.
However, the systematic analysis of "the severity of
traffic accidents" remains relatively limited. Factors
affecting the severity of accidents, as potential causes
of traffic accidents, hold significant reference value
for developing more refined and tiered intervention
policies.
Looking back at the relevant literature, scholars
usually explore the causes of traffic accidents from
three levels: the individual level, external
environmental factors, and macro-social factors. At
the individual level, variables such as gender, age,
and driving experience are considered to have a
significant impact on driving risk. Men are more
likely to be influenced by their emotions and take
irrational driving actions (Khan et al., 2020). Young
drivers are more likely to view driving as a risky
behaviour due to their immature mentality, which can
lead to serious traffic accidents (Khan et al., 2020).
But at the same time, experienced drivers can also
cause accidents due to overconfidence and negligence
(Gebre Meles et al., 2022). It can be seen that
individual differences will affect drivers' psychology
and prompt them to adopt different driving
behaviours. However, existing research does not
capture more dynamic and subjective factors such as
the driver's psychological state and behavioural
672
Wei, D.
Exploring Determinants of Traffic Accident Severity Using Empirical Data.
DOI: 10.5220/0013852100004719
Paper published under CC license (CC BY-NC-ND 4.0)
In Proceedings of the 2nd International Conference on E-commerce and Modern Logistics (ICEML 2025), pages 672-680
ISBN: 978-989-758-775-7
Proceedings Copyright © 2025 by SCITEPRESS – Science and Technology Publications, Lda.

responses, and is unable to explain the specific role of
individual differences in more detail. In addition, it is
limited by data availability and privacy protection,
resulting in a narrow coverage of variables. At the
level of external environmental factors, weather
conditions (such as rain, snow, and fog), road
structure, and period (such as night or early morning)
all have a certain correlation with the severity of the
accident. For example, rainy days make traffic
accidents more likely but less severe (Edwards,
1998). In the early hours of the morning, drivers are
prone to drowsiness and a lack of concentration, and
accidents may be more serious (Iqbal et al., 2020). It
can be seen that external environmental factors not
only affect the probability of accidents but also have
complex effects on the outcomes of accidents.
However, current research focuses more on the linear
impact of a single variable and rarely reveals the
interactive relationship between environmental
variables. In addition, at a more macro level, stock
market fluctuations, epidemics, and autonomous
driving technology will all affect drivers' emotions or
social behavior, thereby indirectly affecting traffic
safety. For example, volatility in stock market returns
is statistically significantly correlated with traffic
accidents, which may be related to the fact that
investor mood swings (such as excitement or
depression) affect driving behavior (Giulietti et al.,
2020). On the other hand, as a technological hotspot
in recent years, autonomous driving technology has
shown great potential in improving road safety, but it
is also accompanied by problems such as perception
limitations and ethical conflicts. Relevant research
mostly stays at the correlation level. It rarely explores
the mode of influence, making it difficult to
accurately explain how macro factors affect the
outcome of accidents by influencing driver behavior.
In summary, although the above studies have their
emphases, they mostly focus on the impact of a single
influencing variable on accidents, but fail to achieve
integrated modeling, ignore the interaction of
multiple variables, and have certain limitations.
Based on the above background, this study will
systematically analyze the factors that affect the
severity of traffic accidents, comprehensively
consider multiple external environmental conditions
that affect driving behavior, and use actual traffic
accident data in Nashville for empirical modelling
analysis. This paper conducts data cleaning and
variable construction to generate a continuous
variable "Severity Score" to measure the severity of
the accident, and removes missing or outliers. This
paper will use the multivariate linear regression
model (OLS) to identify the direction, significance,
and relative influence of each variable, and at the
same time, attempt to curve fit the possible nonlinear
effects to enhance the explanatory power of the
model.
This study hopes to clarify the specific impact of
external environmental variables on the severity of
traffic accidents, explore the order of influence of
different high-risk conditions on accident severity,
and provide data support for traffic safety policy
making.
2 LITERATURE REVIEW
Traffic accidents can cause serious consequences
around the world, including property damage and
casualties. According to the World Health
Organization, approximately 1.35 million people lose
their lives in traffic accidents each year. (World
Health Organization, 2021). The occurrence of traffic
accidents is caused by the combined effects of
individual characteristics, driving behavior, external
environmental conditions, and macro factors. In
recent years, scholars have been conducting more and
more research on traffic accidents. Studies have
discovered that human factors are the main cause of
accidents, followed by vehicle failures and
environmental factors (Iqbal et al., 2020).
2.1 The Impact of Individual
Characteristics on Traffic
Accidents
Individual characteristics, as an important factor
affecting the severity of traffic accidents, reflect the
differences in drivers' perception, judgment level, and
reaction speed when facing emergencies. Variables
such as the driver's gender, age, and driving
experience determine their driving behavior patterns
and sensitivity to risks to a certain extent, thus
affecting the process and outcome of accidents.
Gender differences can affect how male and
female drivers respond to traffic accidents. A study
on driver-injury severities analyzes Florida crash data
and discovers that men and women have different
crash severity levels when they are under-adjusted for
speed, and that the influencing factors are time-
unstable (Islam & Mannering, 2021). Another study
investigates that male drivers are more susceptible to
negative emotions and adopt risky driving behaviors,
while female drivers are better able to regulate their
emotions and drive rationally (Khan et al., 2020).
Gender differences have a certain impact on drivers'
Exploring Determinants of Traffic Accident Severity Using Empirical Data
673

psychology and cognition, which will affect their
judgment when encountering traffic accidents and
lead to differences in the severity of traffic accidents.
Studies have shown that the age of the driver also
has a significant impact on the severity of traffic
accidents (Haleem & Gan, 2013). The Mixed Logit
Model analysis shows that different age groups show
differences in accident types and impact directions
(Haleem & Gan, 2013). Middle-aged drivers are most
likely to be seriously injured from impacts from the
back, left, and right, while young drivers have a
higher risk of causing serious traffic accidents
(Haleem & Gan, 2013). Young drivers are more
likely to view dangerous driving as a challenge rather
than a risk, and this risk-taking tendency leads to an
increase in the severity of traffic accidents (Khan et
al., 2020).
Conventional wisdom holds that the more
experience a driver has, the lower their accident risk,
but some studies have found that experience does not
protect drivers. A study based on ordered logistic
regression of traffic accidents detects that
experienced drivers are more likely to cause serious
traffic accidents due to their lack of attention to rules
and overconfidence (Gebre Meles et al., 2022).
Variables such as private vehicles and drivers being
vehicle owners can reduce accident severity (Gebre
Meles et al., 2022).
2.2 The Impact of External
Environmental Conditions on
Traffic Accidents
Among the many factors that affect the severity of
traffic accidents, external environmental conditions
are a crucial variable, including weather conditions,
road lighting conditions, time, and more. These
factors will directly affect the driver's field of vision
and driving behavior. Although there are certain
correlations between these environmental variables,
for example, driving at night is often accompanied by
insufficient lighting, and bad weather may lead to
reduced visibility, they also have independent effects
on the severity of accidents through their respective
mechanisms.
Different weather conditions also have different
effects on the severity of traffic accidents. Taking the
UK as an example, an empirical study based on police
accident reports in England and Wales shows that the
frequency of traffic accidents increases on rainy days,
but the severity decreases (Edwards, 1998). There are
geographical differences in the severity of traffic
accidents in foggy weather, and the severity is
reduced in some areas, which may be related to the
"learning adaptation effect" of drivers to reduced
visibility (Edwards, 1998). Strong winds have no
significant impact on traffic accidents (Edwards,
1998). It can be seen that the weather will have
different effects on drivers' psychology, thus
affecting their driving.
A study in Fukuoka, Japan, discovers that road
structure also affects the type and severity of traffic
accidents (Dong et al., 2021). Car-car collision
accidents often occur at intersections, while car-
bicycle accidents are more concentrated at T-
intersections, especially when the stop line is set
improperly, such as moving back (Dong et al., 2021).
Whether there are traffic lights at the intersection and
whether there are vehicle direction restrictions, such
as left/right limits, also affect the probability and
severity of accidents (Dong et al., 2021).
An analysis of accidents on Pakistan’s M-2
highway reveals that the deadliest accidents occurred
at night, in the early morning, in dry weather, and on
straight sections (Iqbal et al., 2020). Especially in the
early morning hours, accidents are frequent and
serious due to dozing problems (Iqbal et al., 2020).
Accident severity also fluctuates by season and time
of week, with more accidents in July and on Sundays
(Iqbal et al., 2020).
2.3 Impact of Macro Factors on Traffic
Accidents
In addition to individual differences and
environmental conditions, some macro factors also
affect traffic accidents. A study based on fatal traffic
accident data in the United States observes that for
every one standard deviation drop in stock market
returns, there is an increase of about 0.6% in fatal car
accidents after the stock market opens (Giulietti et al.,
2020). Drivers' emotional reactions to stock market
changes can affect their driving behavior, leading to
high-risk driving (Giulietti et al., 2020). When the
stock market rises sharply, investors tend to become
excited, leading to distraction while driving; when the
stock market plummets, anxiety and stress may
trigger behavioral reactions such as impulsive driving
and decreased attention, thereby increasing the
probability of serious traffic accidents. Another study
verifies that although the overall traffic volume
(VMT) and total number of accidents decrease
significantly after the "stay-at-home order" is issued,
the single-vehicle accident rate and single-vehicle
fatal accident rate increase by 2.29 times and 4.10
times, respectively. (Doucette et al., 2021)。
With the development of science and technology,
autonomous driving technology has gradually
ICEML 2025 - International Conference on E-commerce and Modern Logistics
674

become popular in the automotive field. Research
shows that autonomous driving technology is still not
fully adaptable to situations such as bad weather,
hacker attacks, or communication interruptions
(Chougule et al., 2024). After an accident, due to
unclear division of responsibilities, drivers often find
it difficult to quickly take over the vehicle or respond
correctly at critical moments, which may aggravate
the severity of the accident (Chougule et al., 2024).
The government should be clearer about the accident
responsibility allocation mechanism, improve the
regulatory framework, and perfect the ethical
algorithm to effectively reduce the consequences of
traffic accidents.
3 RESEARCH HYPOTHESIS
To further explore the factors that affect the severity
of traffic accidents, this article utilizes Nashville
Accident data for research and analysis based on past
research results and logic, and makes the following
assumptions:
Hypothesis 1 (Time). Traffic accidents at night
and in the early morning are more serious than those
during the day. Traffic accidents on weekends are
more serious than those on weekdays.
Hypothesis 2 (Illumination). The worse the
lighting conditions, the more serious the traffic
accidents.
Hypothesis 3 (Weather). The worse the weather
conditions, the less severe the traffic accidents.
Hypothesis 4 (Collision Type). Different types of
collisions have an impact on the severity of traffic
accidents. Hit-and-run behavior increases the severity
of accidents.
4 METHODOLOGY
4.1 Data Description
The data contains information on many dimensions,
including the time and location of the accident,
weather conditions, collision type, number of
casualties, accident vehicles, lighting conditions, etc.
After splitting the "Date and Time" column and
encoding the categorical variables such as "Weather"
and "Collision Type", this article selected the
following columns for analysis:
Severity_Score:
This variable is a comprehensive indicator
constructed to quantify the severity of traffic
accidents. Its definition is as follows:
𝑆𝑒𝑣𝑒𝑟𝑖𝑡𝑦_𝑆𝑐𝑜𝑟𝑒 = 2 ×
𝑁𝑢𝑚𝑏𝑒𝑟 𝑜𝑓 𝐹𝑎𝑡𝑎𝑙𝑖𝑡𝑖𝑒𝑠 + 1 ×
𝑁𝑢𝑚𝑏𝑒𝑟 𝑜𝑓 𝐼𝑛𝑗𝑢𝑟𝑖𝑒𝑠 + 0.5 ×
𝑃𝑟𝑜𝑝𝑒𝑟𝑡𝑦 𝐷𝑎𝑚𝑎𝑔𝑒
(1)
Since death is the most serious consequence of a
traffic accident, it is given the highest weight. Injury
is the second most serious consequence and is
weighted 1. Although property loss is important, it
has a lower weight than personal safety and is
weighted at 0.5.
Explanatory Variables: All explanatory variables
are shown in Table 1. In this study, missing values are
handled by filling in or deleting them. After the above
processing steps, 216,103 records are retained for
analysis in this study. The data covers the period from
January 2018 to April 2025, and is consistent and
very timely.
Table 1: Variable description
Name Definition
Hour hour of the day at which the accident occurred
Is_Weekend binary variable indicating whether the accident occurred on a weekend
Weekday the day of the week on which the accident occurred
Time_Period
categorical variable indicating the time-of-day segment in which the accident occurred
(morning, daytime, evening, late night)
Zip code ZIP code of the accident location
Weather weather condition at the time of the accident
IlluACCIDEmination lighting condition at the time of the accident
Collision Type type of collision involved in the accident
Number of Motor
Vehicles.
number of motor vehicles involved in the accident
Hit and Run binary variable indicating whether the accident was a hit-and-run
Exploring Determinants of Traffic Accident Severity Using Empirical Data
675

4.2 Model Specification
4.2.1 Ordinary Least Squares (OLS)
To explore the impact of numerous variables on the
severity of traffic accidents, this study first utilizes
OLS as the basic framework to analyse the
approximate linear relationship between variables.
The model has a clear inference mechanism and
strong interpretative results, and is widely used in
empirical research fields such as social sciences and
traffic safety. The OLS model can directly measure
the impact of each explanatory variable on
Severity_Score, thereby drawing preliminary
conclusions. Before modelling, all variables were
processed for missing values to enhance the reliability
of the model.
To ensure the validity and robustness of the
estimation results of the regression model, this paper
conducts a Multicollinearity test on the selected
explanatory variables. Multicollinearity is a common
problem in regression analysis. When there is a high
correlation between independent variables, it will
lead to instability of the regression coefficient and
even distort statistical significance judgment, thus
affecting the interpretation of the actual effect of the
variable. Therefore, in the variable processing stage,
this paper uses the Variance Inflation Factor (VIF) to
systematically test all explanatory variables. The VIF
value generally reflects the degree of linear
correlation between a variable and other variable, and
a VIF greater than 10 is usually considered a warning
sign of severe multicollinearity. In this study, except
for the constant term, the VIF values of the variables
IlluACCIDEmination_1.0 (VIF=10.91),
IlluACCIDEmination_3.0 (VIF=8.56), and
Weather_21.0 (VIF=6.02) are relatively high, and
there is a risk of collinearity, so they are eliminated in
this paper. The VIF values of the remaining variables
are all within a reasonable range (VIF < 5) and could
be included in the regression analysis.
The model follows the formula:
𝑆𝑒𝑣𝑒𝑟𝑖𝑡𝑦_𝑆𝑐𝑜𝑟𝑒
=𝛼+𝛽
Χ
+𝛽
Χ
+⋯+
𝛽
Χ
+𝜀
(2)
Among them:
Χ
~Χ
: Respectively represent Hour,
Is_Weekend, Weekday, Time_Period, Zip code,
Weather, IlluACCIDEmination, Collision Type,
Number of Motor Vehicles, Hit and Run.
𝜀
: the error term
4.2.2 Nonlinear Model
Considering that there may be a nonlinear
relationship between the severity of the accident and
some variables, for example, the time of the accident,
lighting conditions, and casualties are often
asymmetric, the linear model has limitations in this
regard. Therefore, this paper further utilizes Random
Forest Regression for supplementary analysis. The
model can automatically fit complex nonlinear
structures and can reveal the implicit relationship
between variables through feature importance
analysis, thus making up for the shortcomings of
traditional linear methods. To reveal the marginal
effect and relative importance of each variable, this
paper uses the SHapley Additive exPlanations
(SHAP) method to interpret the model. As a powerful
visualization tool, the SHAP method can help
understand the output of the model and show the
impact of each feature on the prediction results.
5 RESULT ANALYSIS
5.1 Descriptive Statistical Analysis
Grouped descriptive statistics are performed on
several core variables under the three categorical
variables of Is_Weekend, Hit and Run, and
Time_Period. The results are shown in Table 2. In
terms of whether it is the weekend, the average
Severity Score on weekends is 0.52, which is higher
than the 0.44 on non-weekends, and the standard
deviation is larger, indicating that the severity of
weekend accidents fluctuates greatly. Hour,
Weekday, and Number of Motor Vehicles also have
different performances on weekends and non-
weekends. On the dimension of hit and run, the
average severity of hit-and-run cases was only 0.28,
which was significantly lower than the 0.52 of non-
hit-and-run cases, which may reflect that hit-and-run
is more common in minor accidents. However, its
standard deviation is relatively small, indicating that
the severity of this type of accident is more
concentrated. In terms of the time of the accident, the
severity is relatively higher at night and early
morning, which are 0.49 and 0.48, respectively, while
the severity is relatively lowest at daytime, which is
only 0.42. This may reflect that accidents are more
likely to cause more serious consequences at night
and in the early morning due to factors such as poor
visibility or driver fatigue. The average value of the
accident time is consistent with the time division
logic. For example, the average time of "Evening" is
18.61. In terms of the number of vehicles, the average
ICEML 2025 - International Conference on E-commerce and Modern Logistics
676

number is the highest in the evening (1.78 vehicles)
and the lowest in the early morning (1.50 vehicles),
indicating that early morning accidents may be more
concentrated in single-vehicle accidents.
Table 2: Summary statistics
Is_Weekend Hit and Run Time_Period
Yes No Yes No Daytime
Early
Morning
Evening
Night
Severity_Score
Mean 0.52 0.44 0.28 0.52 0.42 0.48 0.45
0.49
SD 0.87 0.77 0.58 0.86 0.76 0.79 0.79
0.83
Hour
Mean 11.44 14.02 11.76 13.93 13.30 5.78 18.61
12.91
SD 7.70 7.16 7.72 7.18 1.93 0.96 1.13
10.16
Weekday
Mean 5.48 2.06 3.12 2.86 2.62 3.52 2.88
2.96
SD 0.50 1.41 2.01 1.91 1.84 2.05 1.91
1.94
Number of
Motor
Vehicles
Mean 1.65 1.74 1.72 1.71 1.73 1.50 1.78
1.74
SD 0.85 0.82 0.84 0.82 0.83 0.85 0.79
0.82
5.2 Regression and Machine Learning
Model Analysis
5.2.1 Time
According to the results in Table 3, Time has a
significant impact on the severity of traffic accidents.
This article uses Daytime as the benchmark group.
The data in the table shows that compared with
daytime, early morning, evening, and night all have a
significant positive impact on Severity_Score, and the
corresponding t values are all over 6.8, and the p
values are all less than 0.001, which are highly
significant. This shows that traffic accidents
occurring in the early morning, evening, and night are
more serious, and traffic accidents occurring at night
are the most serious. This may be caused by fatigue,
and may also be related to night lighting and
visibility.
The results in Table 3 also verify that whether it is
a weekend or not also has an impact on the severity
of the accident. The Severity_Score for accidents
occurring on weekends increased by an average of
0.07 (t = 12.14, p < 0.001). This may be related to
behavioral factors such as the main purpose of driving
on weekends being leisure and entertainment, and the
driver's reduced risk perception. According to the
results in Figure 1, whether it is the weekend or not
has a greater impact on the severity than the specific
time of day. Therefore, Hypothesis 1 is established.
5.2.2 Illumination
The results in Table 3 show that lighting conditions
can also significantly affect the severity of traffic
accidents. The data show that the coefficients for the
three lighting conditions of dark (not lighted), dawn,
and dusk are all positive and statistically significant
(p < 0.001). The coefficients of Dark (not lighted),
dawn, and dusk are 0.63, 0.66, and 0.62, respectively,
and the t values are 49.08, 33.6, and 37.27. This may
be due to the delay in the driver's visual field
adaptation during light transition periods
(dawn/dusk) and darkness, coupled with increased
errors in environmental judgment, leading to higher
accident severity. According to Figure 1, the impact
of darkness (not lighted) on accidents is greater than
that of dawn and dusk. Therefore, Hypothesis 2 is
established.
5.2.3 Weather
The impact of weather on accident severity in the
model is relatively complex, and some variables are
significant. Snow, blowing snow, sleet, and hail all
harm accident severity, which means that the accident
severity is lower in this weather. The accident
severity is higher in foggy and cloudy weather. These
results indicate that when visibility is poor or the
weather changes suddenly, drivers may be slow to
react or fail to brake in time, which can aggravate the
consequences of an accident. However, when weather
conditions are more severe, such as snow, the severity
of the accident may be reduced due to the driver's
increased concentration. However, according to the
coefficients in Figure 1 and Table 3, compared with
other factors, weather has a smaller impact on
accidents.
Therefore, Hypothesis 3 is not true. The severity
of the accident shows different reactions under
different weather conditions.
Exploring Determinants of Traffic Accident Severity Using Empirical Data
677

Table 3: Linear relationships between severity score and different variables
Coef. T-value P-value
Is_Weekend 0.07 12.14 0.000***
Weekday 0.00 -1.26 0.207
Hit and Run -0.25 -63.30 0.000***
Weather
Sleet, Hail -0.13 -2.35 0.019*
Snow -0.10 -4.12 0.000***
Fog 0.09 2.27 0.023*
Cloudy 0.06 6.85 0.000***
Blowing Snow -0.21 -2.48 0.013*
Illumination
Dark (Not Lighted) 0.63 49.08 0.000***
Dawn 0.66 33.60 0.000***
Dusk 0.62 37.27 0.000***
Collision Type
Rear End -1.02 -1.14 0.253
Head-on 0.37 32.21 0.000***
Rear to Rear -0.45 -17.96 0.000***
Angle -0.09 -16.29 0.000***
Sidewipe (Same Direction) -0.43 -65.88 0.000***
Sidewipe (Opposite
Direction
)
-0.26 -20.93 0.000***
Front to Rear -0.20 -34.99 0.000***
Rear to Side -0.50 -21.68 0.000***
Time Period
Early Morning 0.04 6.83 0.000***
Evening 0.05 9.29 0.000***
Night 0.06 9.29 0.000***
5.2.4 Collision Type
The regression results show in detail the impact of
different collision types on traffic accidents. Except
for head-on collision, which has a positive impact on
accident severity, other collision types, such as rear-
to-rear, angle, sideswipe, front-to-rear, and rear-to-
side, all harm accident severity. In addition, hit and
run also hurts accident severity, with a coefficient of
-0.25, a t value as high as -63.30, and a significance
level of 0.001. This result shows that after controlling
factors such as collision type, time, and lighting
conditions, the severity of a traffic accident will be
significantly reduced if there is a hit-and-run incident.
This conclusion may seem counterintuitive at first
glance, as it is generally believed that escaping
behavior means that the driver is more responsible
and may lead to more serious consequences.
However, combined with the actual background
analysis, this result is likely because hit-and-run often
occurs after a minor collision, with the perpetrator
attempting to evade financial compensation or legal
liability, rather than fleeing after causing major
casualties. Therefore, fleeing behavior is statistically
more strongly associated with less serious accidents.
The data in Figure 1 shows that hit and run, sideswipe
(same direction), and angle are the three variables that
have the greatest impact on Severity_Score.
Therefore, Hypothesis 4 does not hold. When a
hit-and-run occurs, the severity of the traffic accident
will decrease.
ICEML 2025 - International Conference on E-commerce and Modern Logistics
678
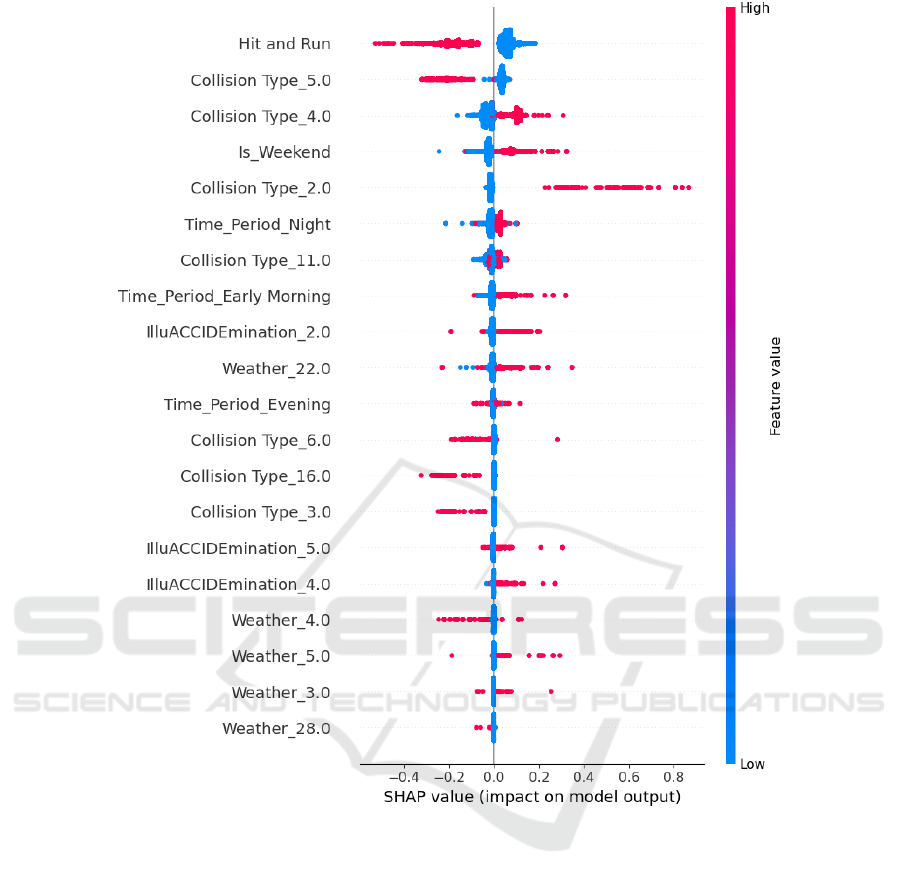
Figure 1: Nonlinear relationships between severity score and different variables (Picture credit : Original).
In the regression results of this study, the
coefficient values of multiple independent variables
are relatively small, but this does not mean that these
variables have no practical significance for the
severity of the accident. On the one hand, as a
dependent variable, the Severity Score has a limited
distribution range of its values. Therefore, even if the
regression coefficient is not large, as long as it is
statistically significant, it still shows that the marginal
impact of the variable is real. On the other hand, the
severity of an accident is often affected by multiple
factors. The marginal effect of a single variable is
limited, but its role in the overall model cannot be
ignored. This is also an important value of
multivariate regression analysis, which can integrate
multiple influences and reveal complex models.
6 CONCLUSION
This study systematically analyzed the impact of time
factors, weather conditions, lighting conditions, and
collision types on the severity of traffic accidents.
Through empirical analysis, this paper identifies that
early morning, evening, and night are the periods that
lead to more serious traffic accidents, while weekends
are more likely to have serious accidents than
weekdays. Weather conditions such as snow, blowing
snow and sleet, and hail will significantly reduce the
risk of accidents, while fog and cloudy weather will
aggravate the consequences of accidents. Lighting
conditions such as dark (not lighted), dawn, and dusk
significantly increase the severity of accidents.
Exploring Determinants of Traffic Accident Severity Using Empirical Data
679

Moreover, head-on collisions will lead to increased
severity of accidents, while hit-and-run behaviour
will reduce accident severity. If all environmental
variables are considered together, the impact of
behavioural factors such as hit-and-run behaviour and
collision type on the severity of traffic accidents is
usually greater than that of environmental factors
such as weather and lighting. This is because the type
of collision directly determines the degree of physical
damage, while hit-and-run is related to the
psychology of the perpetrator, which often occurs
when the perpetrator wants to evade responsibility for
a minor accident. This has a more direct impact on the
consequences of the accident.
This study verified the significant relationship
between multiple environmental and behavioural
variables and accident severity through quantitative
analysis of actual traffic data, filling the gap of
insufficient comprehensiveness in previous studies.
This not only provides empirical support for traffic
safety researchers but also provides data-based
reference for urban traffic managers when
formulating precise strategies. Managers should
strengthen road inspections during specific weather
conditions or times and optimize infrastructure
construction, such as lighting equipment. However,
behavioural guidance, law enforcement supervision,
and traffic safety education are key strategic
directions to reduce the severity of traffic accidents.
The government can strengthen the publicity of traffic
rules and enhance legal publicity and education for
high-risk collision types.
Although this study conducts a comprehensive
quantitative analysis of environmental and individual
behavioural variables, it still fails to consider some
individual variables and macro factors more
comprehensively, and does not conduct a detailed
discussion and verification of the improvement
methods. In the future, studies can further consider
how traffic accidents will change under the combined
effects of macro variables (such as the epidemic) and
individual factors (such as gender and age), and verify
the specific feasibility of improvement measures such
as legal education.
REFERENCES
World Health Organization, 2021. Road traffic injuries.
World Health Organization.
https://www.who.int/news-room/fact-
sheets/detail/roadtraffic-injuries.
Khan, K., Zaidi, S. B., & Ali, A., 2020. Evaluating the
nature of distractive driving factors towards road traffic
accident. Civil Engineering Journal, 6(8), 1555-1580.
Gebre Meles, H., Brhanu Gebrehiwot, D., Gebrearegay, F.,
Gebru Wubet, G., & Gebregergis, T., 2022.
Identification of determinant factors for car accident
levels occurred in mekelle city, tigray, ethiopia:
Ordered logistic regression model approach. Momona
Ethiopian Journal of Science, 13(2), 225-239.
Edwards, J. B., 1998. The relationship between road
accident severity and recorded weather. Journal of
Safety Research, 29(4), 249-262.
Iqbal, A., Rehman, Z. U., Ali, S., Ullah, K., & Ghani, U.,
2020. Road traffic accident analysis and identification
of black spot locations on highway. Civil Engineering
Journal, 6(12), 2448-2456.
Giulietti, C., Tonin, M., & Vlassopoulos, M., 2020. When
the market drives you crazy: Stock market returns and
fatal car accidents. Journal of Health Economics, 70,
102245.
Islam, M., & Mannering, F., 2021. The role of gender and
temporal instability in driver-injury severities in
crashes caused by speeds too fast for conditions.
Accident Analysis and Prevention, 153, 106039.
Haleem, K., & Gan, A., 2013. Effect of driver's age and side
of impact on crash severity along urban freeways: A
mixed logit approach. Journal of Safety Research, 46,
67-76.
Dong, J., Hirota, M., Nomura, T., & Sato, J., 2021. Analysis
of crossing collision accident characteristics by
accident party. International Journal of Intelligent
Transportation Systems Research, 19(1), 214-229.
Doucette, M. L., Tucker, A., Auguste, M. E., Watkins, A.,
Green, C., Pereira, F. E., Borrup, K. T., Shapiro, D., &
Lapidus, G., 2021. Initial impact of COVID-19's stay-
at-home order on motor vehicle traffic and crash
patterns in connecticut: An interrupted time series
analysis. Injury Prevention, 27(1), 3-9.
Chougule, A., Chamola, V., Sam, A., Yu, F. R., & Sikdar,
B., 2024. A Comprehensive Review on Limitations of
Autonomous Driving and Its Impact on Accidents and
Collisions. IEEE Open Journal of Vehicular
Technology, 5, 142-161.
ICEML 2025 - International Conference on E-commerce and Modern Logistics
680
