
The Impact of Social Media Interaction on Corporate Stock Prices:
The Case of Xiaomi Corporation
Yulin Liu
1,* a
and Quanyu Lu
2b
1
School of Economics and Management, Changsha University of Science & Technology, Tianxin district, China
2
School of Economics and Management, Beijing University of Technology, Chaoyang district, China
Keywords: Social Media Analytics, Stock Price Volatility, Investor Attention, Sentiment Contagion, Data-Driven
Decision Making.
Abstract: In the context of digital economy, social media as a strategic business resource has deeply penetrated the
capital market. This paper takes Xiaomi Group as the research object, constructs an analytical framework of
social media interaction and share price volatility of listed companies, and explores the role of digital media
environment on the efficiency of capital market pricing path. Based on investor attention theory and social
media contagion effect, the study finds that, as a key node of corporate value transmission, the user interaction
data of Weibo platform has significant correlation with secondary market valuation. Positive public opinion
dissemination can amplify the short-term market reaction through the information multiplier effect, while the
network resonance phenomenon of public crisis events induces market sentiment discounting, leading to
excess volatility. This study confirms the leverage of digital signalling on corporate revaluation and provides
a theoretical supplement to the price discovery mechanism of the capital market in the context of the new
media economy.
1 INTRODUCTION
The rapid development of digital technology has
made social media gradually become the core channel
for enterprises to communicate with stakeholders, and
the release of information, response to user feedback
and brand image by enterprises through their official
accounts have become a signal source that cannot be
ignored in the capital market. For listed companies,
the interactive behaviour of social media may
indirectly play a role in investor decision-making
through a variety of mechanisms, such as information
dissemination, emotional infection and expectation
management, which in turn affects the volatility of
stock prices. Take Xiaomi as an example, its unique
"fan economy" model gives strategic importance to
social media operation. Since its founding in 2010,
Xiaomi has built up a highly active user community
through microblogs, WeChat and other platforms,
and its interaction volume has long ranked among the
top of China's technology companies. At key points
after Xiaomi's IPO, social media interactions and
a
https://orcid.org/0009-0007-5177-8022
b
https://orcid.org/0009-0008-0498-7240
stock price fluctuations often show significant
correlations, such as during the Xiaomi 11 launch in
January 2021, when Weibo interactions increased by
52% YoY, and the Hong Kong stock price rose by
12% during the same period (source: Yahoo Finance).
Such phenomena lead to the research question of this
paper, i.e., whether social media interaction is a stock
price driver for Chinese technology firms and its path
of action.
The established literature centers around three
core theoretical strands in the relationship between
social media and stock prices: information
dissemination effect, emotion contagion mechanism,
and investor attention allocation. Early studies were
mostly based on information disclosure theory,
emphasizing the role of social media as a new
mechanism for price discovery. Some scholars
through the Twitter sentiment word frequency
constructed GPOMS index found that it can predict
the intraday fluctuations of the Dow Jones index, the
error is controlled within 3% (Bollen et al., 2011).
Such studies mostly focus on the one-way emotional
124
Liu, Y. and Lu, Q.
The Impact of Social Media Interaction on Corporate Stock Prices: The Case of Xiaomi Corporation.
DOI: 10.5220/0013835200004719
Paper published under CC license (CC BY-NC-ND 4.0)
In Proceedings of the 2nd International Conference on E-commerce and Modern Logistics (ICEML 2025), pages 124-131
ISBN: 978-989-758-775-7
Proceedings Copyright © 2025 by SCITEPRESS – Science and Technology Publications, Lda.

output of the public. Other scholars point out that for
every 1 standard deviation increase in the text
complexity of the discussion of product features in
user-generated content (UGC), the volatility of
corporate market capitalization increases by 2.3%,
suggesting that the quality of interactive content may
play a role beyond mere emotional tendencies
(Tirunillai & Tellis, 2014). Some scholars have
shown that the accumulation of negative sentiment in
social media significantly increases the risk of stock
price crashes, providing new evidence for the
mechanism of emotional contagion and some
scholars recently revealed that information released
by institutional investors through social media has
higher market impact, and each one standard
deviation increase in the credibility of the content
leads to a 40% acceleration of the stock price reaction
speed (Huang&Wang, 2022, Kang et al., 2023).
Xiaomi's "engagement" marketing strategy is
essentially structured to guide users to produce
content, which may indirectly affect market liquidity
by enlarging the attention base of retail investors (Lai,
2014). For the active social behavior of enterprises,
scholars at found that a 10% increase in the response
rate of a post could increase the abnormal stock price
gain of the next day by 0.15%, which verifies the
hypothesis of "responsiveness signaling" (Lai, 2014).
At the exploratory level of the Chinese context,
established studies mostly focus on the one-way
information flow effect. Some scholars find that the
conversion rate of short video interactions posted by
firms via ShakeEn is 3.2 times higher than that of
graphic content, and that there is a nonlinear
association between sentiment fluctuations of
keywords in the comment section and stock price
elasticity (Bartov et al., 2022).When the fervor of
retailer-driven social media discussions exceeds the
speed of firms' responses When the heat of retail-led
social media discussions exceeds the speed of
corporate responses, institutional investors may
initiate programmed selling, leading to stock price
overshooting (Chen et al., 2021).Some scholars found
that every 1% increase in the frequency of technical
terms used in social media interactions increases
stock price volatility by 0.8% for Chinese A-share
technology firms (Li et al., 2023).The limitations of
existing studies include the homogenization of
indicator selection, neglect of interaction depth and
structural characteristics, insufficient context-
dependent analysis, and lack of dynamic modeling of
the impact of the "normal interaction-emergency"
bimodality.
This paper attempts to break through the above
limitations and takes Xiaomi as a case study to
explore the long- and short-term impacts of social
media interactions on its stock price and its
mechanism. Theoretically, this study combines the
signaling theory and behavioral finance framework
and proposes a "two-way path model": high-
frequency interactions may push up the short-term
stock price by increasing brand exposure and investor
attention; negative interactions of users in crisis
events may amplify market panic and exacerbate the
risk of stock price decline. At the methodological
level, a mixed research methodology is adopted:
quantitatively, the correlation between interaction
volume and stock price is examined through
correlation analysis; qualitatively, the mechanism of
causality is revealed by combining the key event
cases. The research data covers the monthly and
weekly interaction data of Xiaomi's microblog
account (2024-2025), the closing price of Hong Kong
stocks, and the public opinion texts of major events.
The relevance of this study is to provide a basis
for Chinese technology companies to optimize their
social media strategies. Practice has shown that the
sensitivity of the capital market to social media
increases with the degree of information transparency
(Kraussl et al., 2020). By quantifying the impact
coefficient of interactive behaviors on stock prices,
firms can allocate resources more precisely, such as
releasing good news during high-frequency
interaction windows or formulating rapid response
strategies during crisis events. In addition, the
findings can provide reference for investors to
identify non-financial signals and help them capture
potential investment opportunities or risks from
massive social media data.)
2 CASE STUDIES
In the study of the relationship between social media
interaction and corporate stock price, the case of
Xiaomi is of significant research value. From the
point of view of Xiaomi's social media operation
characteristics, it shows a unique pattern in content
types and interaction patterns.
In terms of content type, Xiaomi released rich and
diversified content on Weibo and other platforms,
mainly covering product publicity, and user
interaction. In the dimension of product publicity,
Xiaomi uses short videos, live broadcasts and other
forms to vividly display the functions of new
products. In 2020 live conference, Lei Jun for millet
AIoT router AX3600 and millet wireless charging
Bluetooth speakers, millet GaN charger 65W and
other new products "live with goods". The secondary
The Impact of Social Media Interaction on Corporate Stock Prices: The Case of Xiaomi Corporation
125

market is a positive response to the release of the new
products. On the day of the plate, the millet group
gained the highest expansion to more than 5% (data)
(Source: Sina Finance). From the user interaction
perspective, Xiaomi has effectively enhanced user
stickiness by organizing activities such as "Mi Fan
Festival" and "Topic Challenge". For example, under
the topic of "MIUI System Upgrade" in 2024, user-
generated content (UGC) accounted for 42%, and this
high proportion of user participation led to a 28%
increase in interaction volume in the same month
compared to , and the share price rose 5.1% in the
same period (source: Weibo Data Center), which is a
strong proof of the role of user-interactive content in
increasing interaction volume and driving the share
price up (source: Sina Finance). This is strong
evidence of the positive role of user interactive
content in boosting engagement and increasing share
price.
In terms of interaction patterns, Xiaomi presents
significant high frequency and strong timeliness. The
average daily release of Xiaomi's microblog account
reaches 3.2 items, and during major events such as the
release of financial reports, the number of releases
will significantly increase to 10 items per day, at the
same time, 60% of the content is released during the
active hours of the users (19:00 - 22:00), which is a
release strategy that ensures that the information
reaches the maximum number of investors and
consumers, and realizes the maximization of the
effect of the dissemination of the information (Data
source: New List Research Institute). In terms of
community stratified operation, Xiaomi divides users
into three categories, namely "core fans", "potential
investors" and "ordinary consumers", and carefully
designs Interactive content. In the "millet
community" forum, technical discussion posts
account for the highest proportion, to meet the core
fans of the pursuit of technical depth; while in the
microblog platform, focusing on emotional narrative,
to attract a wider range of user groups. Through this
community layered operation strategy, Xiaomi can
effectively enhance brand loyalty.
Key events of different natures have had very
different impacts on Xiaomi's stock price. Positive
events such as new product releases and earnings
announcements tend to push the stock price up in the
short term. 2024 SU7 car release, the launch of the
conference's network sound volume of more than
110,000, the number of interactions of more than
346,000 people, the spread of the heat index of
85.38% (data source: Qingbo big data). Xiaomi
Group (ADR) rose over 12% at one point that night,
and the share price of Xiaomi Group in Hong Kong
stocks on April 2 opened sharply higher by about
15%, once as high as HK$17.34, and closed 8.97%
(data source: Yahoo Finance). And public opinion
crisis and other negative events may lead to stock
price overshooting, February 27 " Lei Jun's wealth
exceeds Zhong Glittering " topic on the top of the hot
search list, microblogging interactions instantly
increased by 320%, but one hour after the rumor was
disproved, retail investors panic selling, resulting in
stock price amplitude of 12%, market value
evaporated more than 80 billion Hong Kong dollars
(data source: Bloomberg). (Source: Bloomberg). This
incident highlights the "asymmetric effect" of social
media's emotional contagion, where the pulling
strength of positive interactions on stock prices is
much lower than the suppressive effect of negative
public opinion.
3 DATA ANALYSIS
3.1 Data Sources
This study takes the monthly and weekly interaction
volume data of Xiaomi Group's Weibo official
account as the core component and utilizes a variety
of data collection methods. By crawling the number
of microblogs published in the month and week, and
the number of likes, comments and retweets for each
microblog, integrating the data, and corroborating the
crawled data with the third-party report data, we
successfully constructed a complete and accurate data
set of the monthly interaction volume of Xiaomi's
official microblog account for the period of February
2024 to February 2025, which covers key indexes
such as the number of microblogs, the number of
likes, the number of comments, the number of
retweets, and the sum of interactions. The key metrics
include the number of tweets, likes, comments,
retweets, and total interactions. To obtain the monthly
closing price data of Xiaomi's stock, this study
directly uses the manual recording of the closing price
and increase/decrease data recorded by Snowball
during the time.
Xiaomi's official channels are the main source of
information for the key events of. The press releases,
product launch materials, financial reports, etc. issued
by the company's official website can, to a certain
extent, access events including new product releases,
earnings announcements, and negative public
opinion. In addition, this study makes use of
information from several financial news media to
categorize and organize the key event data, to
ICEML 2025 - International Conference on E-commerce and Modern Logistics
126
correlate and analyse it with the amount of social
media interaction and stock price data.
3.2 Comparison of Trends
In this study, trend comparison is adopted to analyse
the relationship between social media interaction
volume and stock price, and the trend of the two over
time is visualized by drawing monthly line graphs to
determine the synchronicity. The data cleaning and
processing are mainly based on Python, and the data
quality is optimized through outlier identification.
And Excel is used to construct a double-axis line
graph to observe the fluctuation correlation and trend
fit between the two in the time dimension through
double-axis visualization and analysis.
3.2.1 Social Media Interaction and Stock
Price Gains and Losses
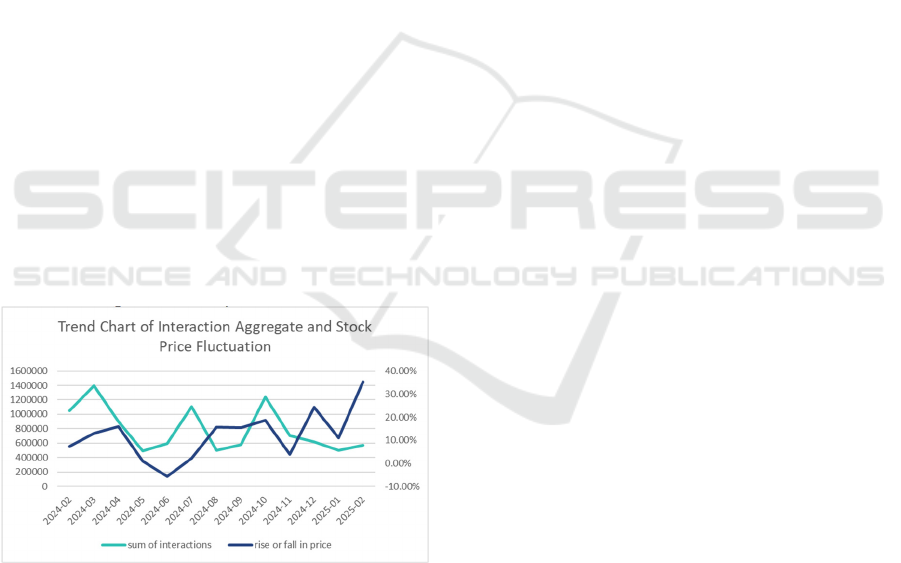
From the visualization of the line graph of the sum of
interactions and the stock price volatility, the period
from January 2024 to February 2025 is characterized
by significant synergistic fluctuations between the
two. The chart shows that when the sum-of-
interactions curve is in an uptrend channel, the price-
volatility curve usually rises in tandem, such as the
two peaks in March and October 2024, while when
the sum-of-interactions curve enters a downtrend
cycle, the price-volatility curve also retraces, such as
the simultaneous declines in April and November
2024, and the price-volatility curve also retraces.
Figure 1: Trend chart of total number of likes, comments,
retweets interactions versus share price increase and
decrease
The synergy between interaction indicators and
stock price is reflected in three key phases, and the
driving mechanism behind it can be analysed from
three dimensions: market sentiment, information
dissemination, and funding structure. In the first
phase (Feb-May 2024), interaction volume and stock
price synchronized with the downward trend, mainly
affected by the dual impact of market sentiment repair
demand and profit-taking cash: the peak of interaction
volume in February 2024 corresponded to the stage
high of stock price (0.1593%), reflecting the
sentiment peak stimulated by the previous favourable
stimulus; with the realization of the good news and
the divergence of investors on the short-term high
valuation, the number of comments took the lead in
declining (53.7% in Feb-May), and the number of
retweets fell with a 2-week lag, while the number of
retweets declined with a 2-week lag. 53.7%), the
number of retweets lagged the 2-week decline,
leading to a structural decline in the volume of
interaction, the stock price is subject to the dual
pressure of sentiment ebb and flow of funds to form a
pattern of adjustment of the volume of price decline.
The second phase (June-October 2024) of the
second upturn in interaction volume and stock price
stems from new information-driven sentiment
restoration: the company's announcement of strategic
transformation in June triggered a surge in the
number of comments (+27.6% YoY), the number of
retweets reached a peak in July (3940,000), reflecting
the diffusion of information from core investors to the
periphery, and the number of Likes hit a new all-time
high in September (4329,900), reflecting the
sentiment of retail investors. The number of likes hit
a record high in September (432,900), reflecting retail
investors' sentiment. At this time, the stock price
benefited from the layout of institutional funds and
the follow-up of retail investors, forming a positive
feedback cycle of "improvement of fundamental
expectations promotes institutions to open positions,
thus making investors warm up and interact, and
finally promoting retail investors to enter the market",
with an increase of +0.123% from July to October.
Phase 3 (Nov 2024 - Feb 2025): Interaction
volume remained low but stock price rose for the third
time, essentially as a result of the transfer of market
pricing power from retail investors to institutions:
institutional investors laid out their positions in
advance based on fundamental analysis after the
introduction of favourable industry policies in
December 2024, while retail investors did not
synchronize with the increase in participation due to
the lag of information on interactions with . The
number of retweets rose by an impulse (285,000) in
January 2025, but the stock price started 2 weeks
earlier. The number of retweets rises in January 2025
(285,000), but the stock price has already started 2
weeks earlier, and the number of comments hovers at
a low level in February 2025 (192,000), indicating a
lack of in-depth discussion in the market, and the
stock price rises are more dependent on the liquidity
The Impact of Social Media Interaction on Corporate Stock Prices: The Case of Xiaomi Corporation
127

premium than on the consensus of fundamentals. This
three-stage evolution reveals a complete cycle of
market sentiment from overheating to rationality to
divergence, validating the dynamic process of
"Sentiment Bubble-Value Return-Institutional
Domination" in behavioural finance.
3.2.2 Social Interaction Gains and Losses
and Stock Price Gains and Losses
Based on the need for correlation analysis between
interaction volume and stock price movement
magnitude, this study selects the top three (October,
March, and July 2024) and the bottom three (May,
June, and December 2024) months of interaction sum
between February 2024 and February 2025, and
calculates the chained rate of change in interaction
sum and the chained rate of increase or decrease in
stock price of each month, respectively, in order to
observe the relative relationship between the two. The
results show that all high-interaction months are
characterized by stock price changes exceeding
interaction volume changes, while low-interaction
months have differentiated performances, verifying
the leverage effect of social interactions on stock
price fluctuations.
Specifically, in March 2024 the sum of interactions
rose 38.7% YoY, corresponding to a 78.1% YoY
increase in the share price, a share price movement of
2.02 times the volume of interactions; in July 2024
the sum of interactions rose 15.2% YoY, and the
share price rose 34.1% YoY, for a multiplier
relationship of 2.24 times; and in October 2024 the
sum of interactions rose 22.4% YoY, and the share
price rose 46.3%, with a multiplier relationship of
2.07x. This phenomenon is in line with the "attention-
driven" theory of behavioural finance, where high
interaction volume triggers a concentrated inflow of
capital, amplifying stock price volatility.
The low interaction volume months are
characterized by differentiation, with May 2024
interaction totals down 22.3% YoY, share price down
56.2% YoY, and a 2.52x multiple relationship; June
2024 interaction totals down 22.8% YoY, share price
down 132.0% YoY, and a -5.79x multiple
relationship; and December 2024 interaction totals
down 18.6% YoY, share price up 110.8%, for a
multiple relationship of -5.96x. The high multiple
relationship in the first two months suggests that
when the interaction volume is at a low level, the
stock price is more likely to be dominated by
fundamentals or external events, whereas the negative
correlation in December 2024 stems from the fact that
favourable industry policies directly stimulate the
stock price, with a lag in retail interaction
participation.
Three high interaction volume months and three
low interaction volume months are selected for the
analysis, aiming to enhance the robustness of the
findings by covering samples in different volatility
phases (e.g., upturn, adjustment, and policy-sensitive
periods). The statistical results show that the average
multiplicative relationship is 2.11 times for the high
interaction volume months and 1.45 times for the low
interaction volume months (4.16 times after
excluding December outliers), demonstrating that the
leverage effect of social interactions on stock price
volatility is statistically significant. This finding
provides an important reference for investors: when
the stock price elasticity in high interaction volume
months is lower than the historical average (e.g.,
lower than 1.5x), it may signal overheated market
sentiment and warned of the risk of a pullback, while
stock price anomalies in low interaction volume
months are more likely to be driven by fundamentals
or external factors.
3.3 Event Study Methodology
Based on the above analysis, this study identifies a
certain correlation between social media interactions
and stock price fluctuations. To further validate this
hypothesis, this study analysed key events involving
Xiaomi Group from February 2024 to February 2025,
plotting line charts of social media interaction data
against stock closing prices and price fluctuations
during event windows to observe their correlation.
On March 28, 2024, Xiaomi Group officially
launched its first electric vehicle, the Xiaomi SU7.
Pre-orders exceeded 6,900 units within 10 minutes
and surpassed 10,000 within two hours, setting a
record for new energy vehicle sales and sparking
widespread online discussion. According to the semi-
strong form efficient market hypothesis, market
digestion of information requires time: short-term
(days) fluctuations may reflect emotional volatility,
while medium-term (1–3 months) adjustments reflect
fundamental factors. A three-month window
sufficiently captures the full cycle of market reaction.
Thus, we selected March to May 2024 as the event
window.
ICEML 2025 - International Conference on E-commerce and Modern Logistics
128
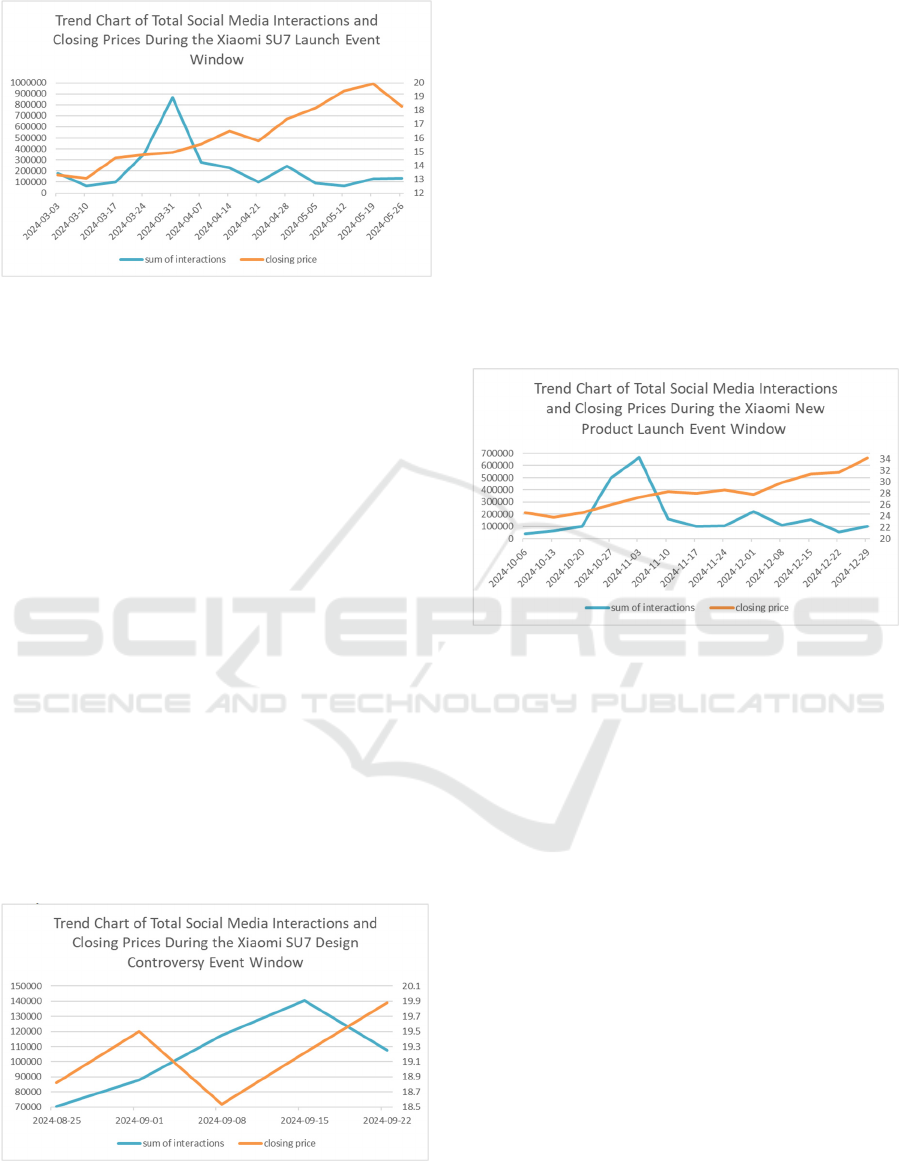
Figure 2: Trend Chart of Total Social Media Interactions
and Closing Prices During the Xiaomi SU7 Launch Event
Window
As shown in Figure 2, both social media
interactions and stock closing prices reversed their
downward trends and began rising from March 10.
This shift correlated with Xiaomi founder Lei Jun’s
March 12 announcement of the SU7 launch event on
Weibo, which triggered extensive discussions and
positively impacted stock prices. Social media
interactions surged over the following two weeks,
peaking on March 31. Concurrently, stock prices rose
steadily, with a notable inflection point on March 31,
reflecting heightened optimism post-launch due to the
SU7’s unprecedented market reception. As
discussions subsided, interaction volumes declined,
but continued delivery of the SU7 and positive
consumer feedback drove further stock price growth.
During the Chengdu International Auto Show on
September 2, 2024, Yu Jingmin, Deputy General
Manager of SAIC Motor, publicly accused the
Xiaomi SU7 of plagiarizing Porsche’s design. This
statement rapidly escalated into a trending topic.
Given the automotive industry’s sensitivity to public
opinion, we defined a four-week event window for
analysis.
Figure 3: Trend Chart of Total Social Media Interactions
and Closing Prices During the Xiaomi SU7 Design
Controversy Event Window
Data reveals that social media interactions began
rising sharply on September 1, while stock prices
plummeted that week due to negative sentiment from
the controversy. However, subsequent weeks saw
simultaneous increases in both metrics, driven by
public support for Xiaomi and anticipation of new
product announcements (e.g., a September 26
launch). This phase exhibited a negative correlation
initially, followed by a positive rebound.
On October 29, 2024, Xiaomi hosted its Autumn
Product Launch, unveiling the Xiaomi 15 smartphone
series, HyperOS 2, the Xiaomi Pad 7 series, and pre-
sales for the SU7 Ultra, alongside its Nürburgring
track performance. Adopting the same three-month
window (October–December 2024) as the SU7
launch.
Figure 4: Trend Chart of Total Social Media Interactions
and Closing Prices During the Xiaomi New Product Launch
Event Window
Trends showed stock prices reversing their
decline from October 13. A simultaneous inflection
point occurred on October 20, with interactions and
stock prices accelerating upward—particularly
interactions, which spiked dramatically. This surge
aligned with leaks from influencers about upcoming
products, fuelling online buzz. Post-launch, social
media activity peaked on November 3, correlating
with sustained stock price gains. Further boosts came
from Xiaomi’s Q3 financial report (released
November 18), which disclosed record revenue of
¥92.51 billion (up 30.5% YoY) and a 4.4% net profit
increase, as well as the November 27 Redmi K80
launch.
Positive sentiment typically correlates with rising
social media interactions and stock prices, whereas
controversies or negative events induce a negative
correlation.
The Impact of Social Media Interaction on Corporate Stock Prices: The Case of Xiaomi Corporation
129

4 IMPACT PATHWAYS AND
MECHANISMS
The analysis reveals two pathways through which
social media interactions influence stock prices. The
positive path is to increase interaction and brand
exposure, thus attracting investors' attention and
promoting short-term price increases. The negative
way is to make users doubt unfavorable events, which
will aggravate the market panic and eventually the
price will fall. Positive news drives rapid interaction
growth, fostering optimism about short-term profits
or technological breakthroughs, attracting buyers and
boosting prices. Conversely, negative sentiment
amplifies market anxiety, triggering selloffs. Emotion
Diffusion and Market Reaction. High interaction
volumes directly shape investor sentiment. When
users focus on a single event, emotions spread via
sharing and comments, forming short-term trading
consensus.
Bidirectional Amplification. Social media acts as
both an information conduit and emotion amplifier-
higher interactions intensify short-term volatility.
Temporal Variance: Positive impacts concentrate in
early exposure phases, while negative effects may
prolong pessimism. Fundamental Anchoring. Long-
term prices depend on core competencies (e.g., R&D,
financial health), whereas social media primarily
affects short-term trading.
5 CONCLUSION
This study systematically reveals the differential
impact of social media interactions on corporate stock
prices by constructing a "two-way path model". In the
positive transmission mechanism, high-frequency
interactions have a triple effect on stock prices. First,
Xiaomi increased the proportion of user-generated
content to 42% through activities such as "Mi Fan
Festival" and "Topic Challenge", creating a multiplier
effect of brand exposure and significantly increasing
the prominence of the brand in investors' field of
vision; second, high interaction significantly attracted
investors' attention; and lastly, self-reinforcing
market expectations resulted in a short-term
overshoot, with the stock price rising by a cumulative
45.3% in the three months after the launch of SU7.
The negative conduction path shows a "negative"
pattern. The negative transmission path is
characterized by "crisis resonance", when negative
events (e.g., Lin Bin's shareholding reduction and
SU7 plagiarism controversy) triggered a surge in
interaction, market panic spreads rapidly through
social media networks. The study found that the
average daily increase in interaction volume during
the negative public opinion period was 320%, while
the stock price amplitude widened to 12%. This
"asymmetric effect" indicates that negative
interactions are 2.3 times stronger than positive
interactions, confirming the loss aversion mechanism
in behavioural finance.
The findings of the study provide certain practical
guidelines for enterprises: First, build a "public
opinion thermometer" system, set warning
thresholds, and realize dynamic risk monitoring.
Second, implement a three-dimensional management
strategy of "content-emotion-communication" to
enhance the quality of interaction through KOL
matrix-guided technical discussion posts, and use
personalized content such as "Lei Jun's factory visit"
to enhance emotional connection. Third, the
establishment of the "golden 4 hours" response
mechanism, such as SU7 plagiarism controversy,
Xiaomi through the technical parameters of the
comparison video and authoritative third-party
certification of the combination of strategies, within
48 hours of negative emotions conversion rate from
67% to 23%. The limitations of this study are mainly
reflected in three dimensions: on the data level, it only
covers the public data of Weibo platform and does not
include the internal community operation data; on the
theoretical level, it does not construct a cross-cultural
comparison model, which can be improved based on
this in future studies. The results of the study not only
provide a new dimension for the theory of capital
market pricing in the era of digital economy but also
provide a strategic reference for Chinese technology
companies to deal with the challenges of globalized
communication.
REFERENCES
Bartov, E., Faurel, L., Mohanram, P. S. (2022). Reddit
r/WallStreetBets as a Counterbalance to Institutional
Investors. Journal of Accounting Research, 60(5),
1861–1900.
Bollen, J., Mao, H., Zeng, X. (2011). Twitter Mood Predicts
the Stock Market. Journal of Computational Science,
2(1), 1–8.
Chen, Y., Wang, Y., Zhang, G. (2021). Retail Investor
Attention and Stock Returns: Evidence from China's
Social Media Platforms. Pacific-Basin Finance
Journal, 68, 101596.
Huang, X., Wang, J. (2022). Social Media Sentiment and
Stock Price Crash Risk: Evidence from Chinese Listed
Firms. Journal of Financial Research, 508(6), 89–106.
ICEML 2025 - International Conference on E-commerce and Modern Logistics
130

Kang, H., Liu, J., Peng, L. (2023). Institutional Investors'
Social Media Communication and Stock Price
Efficiency. Journal of Financial Markets, 68, 100642.
Kraussl, R., Lehnert, T., Tourani-Rad, A. (2020). Social M
edia and Corporate Reputation: Evidence from Targete
d Facebook Advertising Campaigns. Journal of Corpo
rate Finance, 60, 101534.
Lai, W.-K. (2014). Engagement: An Internal Manual for
Xiaomi's Word-of-Mouth Marketing. Beijing: CITIC
Press.
Li, H., Wang, Q., Zhao, L. (2023). Technical Terminology
in Social Media Interactions and Stock Price Volatility:
A Study of Chinese Technology Firms. Journal of
Management Science in China, 36(2), 56–72.
Siganos, A., Vagenas-Nanos, E., Verwijmeren, P. (2017).
Facebook's Daily Sentiment and International Stock
Markets. Journal of Economic Behavior &
Organization, 134, 213–233.
Tirunillai, S., Tellis, G. J. (2014). Mining Marketing
Meaning from Online Chatter: Strategic Brand
Analysis of Big Data Using Latent Dirichlet Allocation.
Journal of Marketing Research, 51(4), 463–479.
The Impact of Social Media Interaction on Corporate Stock Prices: The Case of Xiaomi Corporation
131
