
Analysis of Influencing Factors on the Number of Likes on TikTok
Ruibo Huang
a
Guangzhou Xiangjiang Zhongxue, Guangdong, 510000, China
Keywords: TikTok Likes, Regression Analysis, Video Type, Video Length, Second-Person Video.
Abstract: Given the speed at which technology is developing and the growing acceptance of the Internet, the status of
social media has steadily risen, and short-video platforms led by TikTok have captured the attention of the
majority of the public. The number of likes on TikTok is one of the key research topics today, and analyzing
the influencing factors behind it has become crucial. The data in this article is sourced from the TikTok
accounts of 11 of the most followed news agencies in the United States and Europe, and based on this, some
tags with higher views have been classified. This article mainly conducts a multiple linear regression analysis
on the data to investigate the primary determinants of TikTok's like count. Research finds that the type of
video significantly affects the number of likes; videos in the second-person perspective are closely associated
with the quantity of likes, and the length of time since the video was posted is positively correlated. However,
as the number of likes is influenced by multiple factors, there may be omissions in the summary analysis, and
further in-depth research is needed in the future.
1 INTRODUCTION
New social media platforms continue to appear as a
result of changes in internet user tastes and
information technology advancements. Short-video
platforms, with their characteristics of short duration,
rich content, and diverse forms, have rapidly spread
on the internet and attracted a large number of users.
Among them, TikTok, with its huge user activity
volume, has become one of the mainstream media. It
was the mobile application with the largest download
volume in 2018 and 2019 (Li et al., 2021), and it is
also the most widely used social networking site
among Chinese Millennials (Qin, Omar and Musetti,
2022). Moreover, statistics show that the most active
group on Tiktok are younger users (Montag et al.,
2021). However, unexpectedly, the uninstallation rate
of TikTok is 9.43% (Rahimullah et al., 2022), which
is far greater than that of other social networking sites.
The most efficient method of improving user
communication on TikTok is to look at the number of
likes, which is considered a significant interaction
indicator. The number of likes directly reflects users'
preferences and behavioral patterns, and studying its
influencing factors can better understand users'
a
https://orcid.org/0009-0000-9778-0258
consumption psychology and behavioral
characteristics. Irfan and Yaqoob (2024) pointed out
that the algorithm of Tikotok drives the dissemination
of content, allowing information to spread rapidly and
reach diverse and extensive audiences. At the same
time, the recommendation mechanism of TikTok
determines that videos with high numbers of likes are
more likely to be recommended (Sun, Zheng and Wu,
2023). Therefore, analyzing the influencing factors of
the number of likes on short videos is of great
significance for formulating more reasonable
operation strategies, promoting more efficient big
data algorithms for recommendation, and enhancing
user stickiness.
At present, international scholars have conducted
extensive research on the TikTok platform. For
example, Sharabati et al. (2022) discovered that the
desire for fame and wealth, social recognition, and
self-expression are the main reasons people use
TikTok. Shutsko (2020) stated that TikTok videos are
for entertainment purposes and combine self-
expression and self-presentation. These studies have
a wide exploration range, but there are certain
limitations in terms of specificity and purposefulness,
making it difficult to fully reflect the specific
626
Huang, R.
Analysis of Influencing Factors on the Number of Likes on TikTok.
DOI: 10.5220/0013834600004708
Paper published under CC license (CC BY-NC-ND 4.0)
In Proceedings of the 2nd International Conference on Innovations in Applied Mathematics, Physics, and Astronomy (IAMPA 2025), pages 626-630
ISBN: 978-989-758-774-0
Proceedings Copyright © 2025 by SCITEPRESS – Science and Technology Publications, Lda.

situations in a certain country or globally. In contrast,
from a micro-level perspective, analyzing the
influencing factors of the number of likes helps to
reveal the dissemination mechanism of TikTok and its
key driving factors.
This study is based on the regression analysis
method and aims to analyze the multiple influencing
factors of the number of likes on TikTok, close the
current research gap, assist in raising Douyin's user
retention rate, and encourage the creation and sharing
of high-caliber content, and thereby promote the
healthy development of online culture.
2 METHODOLOGY
2.1 Data Source and Description
The data of this article is sourced from 1000 videos
on the TikTok platform. The selection of these videos
is based on their popularity, including the number of
shares, comments, and likes. A more in-depth
analysis was conducted on 100 of the most popular
videos, and the popular types of videos and their
influencing factors were discussed. The likes, shares,
and comments of these videos accounted for the vast
majority of all videos, namely 63.25%, 81.37%, and
76.73%, respectively. The data mainly comes from
Germany, as the technical requirements of TikTok
limit the sources of videos, which causes some
limitations in the research results. For example,
cultural factors may affect users' content preferences.
In addition, this article also collected the analysis
data of videos posted by 11 major news agencies
based in the United States and Europe on TikTok.
These news agencies include ABC News, NBC News,
CNN, etc., and each of them has a sizable following
on the network. To build a complete data set, the
researchers used a network crawler tool (TikTok API)
to collect all the contents from the first video to the
latest video posted by these accounts.
2.2 Methodology Introduction
This article mainly employs two analytical methods:
linear correlation analysis and multiple linear
regression analysis. Linear correlation analysis is
applicable when dealing with two continuous
variables and the data approximately follow a normal
distribution. The degree of linear correlation between
variables is measured by calculating the Pearson
correlation coefficient. The value of the correlation
coefficient ranges from -1 (perfect negative
correlation) to +1 (perfect positive correlation). The
closer the value is to 1 or -1, the stronger the
correlation is; the closer it is to 0, the weaker the
correlation. Multiple linear regression analysis is a
regression analysis method that studies the linear
relationship between the dependent variable and
multiple independent variables. It predicts the value
of the dependent variable by fitting a linear equation,
which takes into account the influence of multiple
independent variables. The best-fitting line is found
by minimizing the sum of squares of the vertical
deviations of each data point from the line using the
least squares approach.
3 RESULTS
3.1 The Analysis Results of the Types
and Influencing Factors of TikTok
Videos
The interaction data of TikTok videos, such as the
frequency of likes, comments, and shares, are
displayed in Tables 1 and 2, which also examine the
videos' level of popularity.
Table 1: Distribution of TikTok popularity indicators across the 1,000 videos under analysis and the relationship between
the characteristics
Popularity metrics Likes Comments Shares Followers
Maximum value 9,700,000 1,200,000 1,100,000 18,000,000
Minimum value 0 0 0 0
Median 109,450 942 2,000 78,200
Correlations
Likes 1.000 0.463 0.746 0.244
Comments 0.463 1.000 0.341 0.100
Shares 0.746 0.341 1.000 0.114
Followers 0.244 0.100 0.114 1.000
Analysis of Influencing Factors on the Number of Likes on TikTok
627
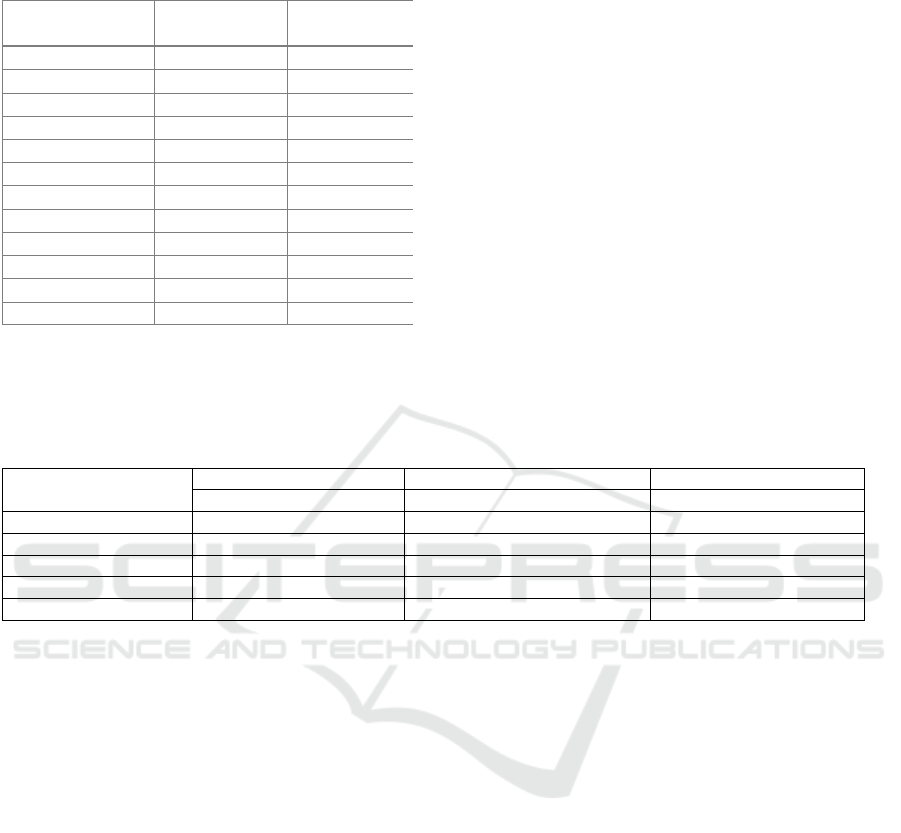
Table 2: TikTok's most popular content categories based
on like count
Category
Number of
videos
(
n = 100
)
Median:
Number of likes
Comed
y
/Joke 33 2,300,000
Musical 14 2,200,000
Art & Architecture 14 1,850,000
Dance 9 2,300,000
Relationship 9 1,800,000
Animals 8 1,700,000
Challenges 8 2,400,000
Humanity/Charity 8 2,850,000
DIY & Tutorials 7 1,900,000
Skills 7 2,000,000
Not assignable 6 2,300,000
Fails & Spitefulness 5 2,600,000
Tables 1 and 2 present the distribution of
popularity indicators and the correlation between
parameters for the videos (N = 1,000). The results
show that although some videos received a large
number of interactions, the number of interactions of
the videos recommended by the recommendation
system was very uneven, with obvious peaks and
troughs. From the results in Table 3, the comedy
category maintained the leading position in terms of
popularity and frequency, while the music
performance and art architecture categories followed
closely.
3.2 Analysis of the Videos Posted on
TikTok
Table 3 conducts a linear regression analysis of
various predictive factors and TikTok video user
engagement. The main predictive variables include
the time since the video was uploaded, video length,
second-person perspective, and video sentiment. The
evaluated indicators are: Like-To-View Ratio (LTV),
Comment-To-View Ratio (CTV), and Share-To-
View Ratio (STV).
Table 3: Linear regression analysis among all TikTok news videos.
Predictors
DV: Like-To-View Ratio DV: Comment-to-View Ratio DV: Share-To-View Ratio
(LTV) (CTV) (STV)
Time since poste
d
0.368 0.020 0.167
Video len
g
th 0.053 0.037 0.077
Secon
d
-
p
erson view 0.150 0.062 0.034
Video sentiment -0.073 -0.054 -0.036
Total R2 (%) 15.2% 0.9% 3.0%
Note. N (all TikTok news videos) = 49,782. ***p < .001.
From Table 3, it can be seen that the duration since
the release is positively correlated with all three
engagement indicators, indicating that the longer the
video is released, the higher the audience engagement
is generally. Although the video length has a
relatively small impact on each engagement indicator,
it still shows a positive relationship, suggesting that
longer videos may receive higher interactions. The
second-person perspective is significantly positively
correlated with all engagement indicators, especially
in terms of "like" and "comment", suggesting that
TikTok videos with the second-person perspective
lead to higher audience engagement. Video emotions
show a negative relationship; that is, the stronger the
positive emotions in the video, the lower the
engagement is.
LTV (like-watch ratio) shows a negative
relationship (β = -0.073, p < .001), indicating that
more positive emotions are associated with a lower
like rate; the negative relationship of CTV (comment-
watch ratio) is also significant (β = -0.054, p < .001);
STV (share-watch ratio) also shows a similar negative
relationship (β = -0.036, p < .001); the second-person
perspective is positively correlated with LTV, CTV,
and STV (β = 0.150, 0.062, 0.034 respectively and all
p < .001), indicating higher user engagement.
The above data indicate that videos released
earlier, longer videos, videos with a second-person
perspective, and videos with negative emotions can
more effectively attract audiences.
4 DISCUSSION
TikTok possesses the most advanced algorithm
system (Siles et al., 2024), which predicts users'
interests by mining their personal information and
continuously provides them with videos. Thus, users
can focus on using and enjoying the application. This
is exactly the same as Meng and Leung (2021) and
others' research. TikTok can enhance its deep
interaction with users by using methods such as
portrait tracking and augmented reality effects to
shape more imaginative images, hierarchical interest
tag trees, user roles, etc. This article examines data
from three sources: device and account settings
(language, nation, device type, etc.); video
IAMPA 2025 - The International Conference on Innovations in Applied Mathematics, Physics, and Astronomy
628

information (titles, subtitles, tags, etc.); and user
involvement and participation activities (likes, shares,
comments, etc.). These three factors are consistent
with the main influencing factors of TikTok’s
recommendation system as mentioned by Cheng and
Li (2024).
Likes are an important indicator for measuring the
popularity and user engagement of short videos. They
not only reflect users' recognition of the content but
also affect the dissemination and recommendation
mechanisms of the videos. Based on this, an attempt
is made to analyze the factors influencing likes on
TikTok.
Video type is one of the primary factors affecting
likes. On TikTok, different types of videos attract
different audience groups, and thus, their likes vary
significantly. Comedy videos, due to their light-
hearted and humorous nature, usually quickly attract
the audience's attention and thus receive more likes
(Sun, Zheng and Wu, 2023). Humorous content can
touch the audience's emotions, evoke resonance, and
prompt them to like.
From the general public's perspective, the core
feature of short video platforms lies in quick
consumption, and users' attention is relatively short.
Therefore, shorter videos are more likely to attract
audiences. However, experimental results show that
longer videos are more likely to increase audience
interaction and participation (Sun, Zheng and Wu,
2023). Video emotions are also important
psychological factors affecting user likes. Videos
featuring negative emotions are more likely to
encourage user participation, according to
experimental studies.
Second-person perspective videos can
significantly increase user interaction rates, including
likes, comments, and shares. It refers to videos shot
from another angle or perspective. This way of
shooting through the use of perspective differences
can provide viewers with different viewing
experiences and increase the novelty and interest of
the content. It can make viewers feel as if they are in
the scene, thereby enhancing the viewing experience.
This immersion can increase users' attention and the
possibility of likes.
It is worth noting that on TikTok, video tags
actually exist as a genuine functional organizational
principle, which helps users find, follow, and share
information. To a certain extent, it can improve the
credibility and dissemination degree of activity
information and has an undeniable impact on likes
(Herrman, 2019). Furthermore, Chen et al. (2021)
noted that the more likes a video receives, the longer
its title.
Finally, due to the rapid development of
technology and the transformation of entertainment
methods this year, TikTok’s popularity has
fluctuated. This has also affected the analysis of the
factors influencing likes. Moreover, this study
discusses the video types that dominate people's lives,
but this does not cover all aspects. Future research can
conduct in-depth exploration of the above-related
variables to facilitate in-depth research on likes.
5 CONCLUSION
This study explores the main factors influencing the
number of likes on Douyin. Firstly, comedy videos,
due to their light-hearted and humorous nature, may
typically grab the audience's attention right away and
get a lot of likes. Secondly, contrary to the common
perception of the public, the experimental results
show that longer videos are more likely to increase the
audience's interaction participation. The emotions
conveyed by the videos can directly affect the
audience's viewing experience and participation and
are also important psychological factors for users to
like. Videos with negative emotions are more likely
to stimulate users' interaction sense. Finally, the
second-person perspective, that is, videos shot from
another angle or perspective, can provide an
immersive experience, increase the interest and
novelty of the content, and thereby increase users'
participation and liking intention. Overall, when
creators produce short videos, they should
comprehensively consider these factors to enhance
the attractiveness of the content and the interactivity
of users. By optimizing these aspects, it is possible to
effectively boost the quantity of likes on the videos
and thereby promote their dissemination effect.
REFERENCES
Chen, Q., Min, C., Zhang, W., Ma, X., & Evans, R. 2021.
Factors driving citizen engagement with government
TikTok accounts during the COVID-19 pandemic:
Model development and analysis. J Med Internet Res,
23(2), e21463.
Cheng, Z., & Li, Y. 2024. Like, comment, and share on
TikTok: Exploring the effect of sentiment and second-
person view on the user engagement with TikTok news
videos. Social Science Computer Review, 42(1), 201–
223.
Herrman, J. 2019. How TikTok is rewriting the world. The
New York Times, 10, 412586765–1586369711.
Irfan, B., & Yaqoob, A. 2024. Innovating online
otolaryngology: The development of the ENT content
Analysis of Influencing Factors on the Number of Likes on TikTok
629

engagement and quality index for audiovisual material.
Cureus, 16(2).
Li, Y., Guan, M., Hammond, P., & Berrey, L. E. 2021.
Communicating COVID-19 information on TikTok: A
content analysis of TikTok videos from official
accounts featured in the COVID-19 information hub.
Health Education Research, 36(3), 261–271.
Meng, K. S., & Leung, L. 2021. Factors influencing TikTok
engagement behaviors in China: An examination of
gratifications sought, narcissism, and the Big Five
personality traits. Telecommunications Policy, 45(7),
102172.
Montag, C., Yang, H., & Elhai, J. D. 2021. On the
psychology of TikTok use: A first glimpse from
empirical findings. Frontiers in Public Health, 9,
641673.
Nadia Adilah Rahimullah, S., Sinta Bela Damayanti, A.,
Aisyah Amyra Izra, & Puturi Handayani. 2022.
Assessing the factors influencing users accessing higher
education content on TikTok. Cogent Education, 9(1),
2148498.
Qin, Y., Omar, B., & Musetti, A. 2022. The addiction
behavior of short-form video app TikTok: The
information quality and system quality perspective.
Frontiers in Psychology, 13, 932805.
Sharabati, A.-A. A., Al-Haddad, S., Al-Khasawneh, M.,
Nababteh, N., Mohammad, M., & Abu Ghoush, Q. 2022.
The impact of TikTok user satisfaction on continuous
intention to use the application. Journal of Open
Innovation: Technology, Market, and Complexity, 8(3),
125.
Shutsko, A. 2020. User-generated short video content in
social media. A case study of TikTok. In Meiselwitz, G.
(ed.), Social Computing and Social Media.
Participation, User Experience, Consumer Experience,
and Applications of Social Computing. HCII 2020.
Lecture Notes in Computer Science, vol. 12195.
Springer, Cham.
Siles, I., Valerio-Alfaro, L., & Meléndez-Moran, A. 2024.
Learning to like TikTok... and not: Algorithm
awareness as process. New Media & Society, 26(10),
5702–5718.
Sun, F., Zheng, S., & Wu, J. 2023. Quality of information
in gallstone disease videos on TikTok: Cross-sectional
study. J Med Internet Res, 25, e39162.
IAMPA 2025 - The International Conference on Innovations in Applied Mathematics, Physics, and Astronomy
630
