
Analysis of Bitcoin Price Forecasting and Related Influencing Factors
Jiaxin Wang
a
School of Mathematical Sciences, University of Southampton, 58 Salisbury Road, Southampton, SO17 1BJ, U.K.
Keywords: Price Prediction, ARIMA Model, Macroeconomic Indicators, Market Sentiment, Volatility.
Abstract: This paper focuses on the factors affecting the price of Bitcoin and its predicted future price trends. As the
most iconic cryptocurrency, Bitcoin has received widespread attention from investors, policymakers, and
researchers due to its high volatility and potential ability to transform the financial system. Understanding the
determinants of Bitcoin's price is important for assessing its role in financial markets, improving risk
management capabilities, and developing effective investment strategies. This study examines a variety of
internal and external factors that may affect the price of bitcoin, including market supply and demand, investor
sentiment, macroeconomic indicators, regulatory policy changes, and technological advances. In terms of
price forecasting, this paper employs statistical and machine learning methods, focusing on the use of ARIMA
model, to model and analyse the long-term trend of Bitcoin. The study incorporates historical data to test the
effectiveness of the model. This study helps to deepen the understanding of Bitcoin's market behaviour,
provides reference for investors to optimise their asset allocation in the context of the evolving digital
economy, and provides theoretical support for financial stability analysis and regulatory policy formulation.
1 INTRODUCTION
Bitcoin was launched in 2008 by a developer under
the pseudonym Satoshi Nakamoto, followed by the
Bitcoin Genesis block in 2009, and is now the leading
cryptocurrency and has revolutionized the financial
sector (Yu et al, 2025). As a decentralized digital
currency, Bitcoin operates over a network without the
need for a central authority or intermediary, based on
blockchain technology that ensures the transparency,
security, and immutability of transactions. Since its
launch, Bitcoin has grown significantly in terms of
market capitalization and market acceptance,
attracting widespread attention from individual
investors, financial institutions, and regulators. The
total supply is limited to 21 million units, a scarcity
that has led it to be considered “digital gold”.
However, the volatility of the price of Bitcoin remains
an important area of research, raising widespread
concern about the drivers behind its price
fluctuations. Understanding these influences is
critical not only for investors looking to maximize
returns on their investments but also for policymakers
and financial analysts to understand the role and
impact of Bitcoin in the wider financial system. This
a
https://orcid.org/0009-0009-6425-3318
paper will explore the key factors that influence
bitcoin price dynamics, consolidate existing research
findings, and highlight the importance of
understanding bitcoin price volatility in the context of
financial market and economic stability.
Over the past decade, researchers have conducted
extensive studies on the factors influencing the price
of Bitcoin. Early research primarily focused on the
technical and structural characteristics of Bitcoin,
such as its limited supply, decentralized nature, and
mining difficulty. These intrinsic features laid the
foundation for Bitcoin’s unique behaviour in the
financial market (Chang and Liu, 2008).
Subsequent studies explored Bitcoin’s dual nature
as both a speculative asset and a financial hedging
instrument. Dirk et al. highlighted that Bitcoin’s price
is highly sensitive to market sentiment and
macroeconomic uncertainty, reflecting its speculative
characteristics as well as its potential role in risk
diversification (Dirk et al., 2018). However, market
fundamentals such as supply, and demand can only
partially explain the high volatility in Bitcoin’s price.
Acikgoz argued that speculative trading and market
speculation play a more significant role in driving
price fluctuations (Acikgoz, 2025). Macroeconomic
620
Wang, J.
Analysis of Bitcoin Price Forecasting and Related Influencing Factors.
DOI: 10.5220/0013834500004708
Paper published under CC license (CC BY-NC-ND 4.0)
In Proceedings of the 2nd International Conference on Innovations in Applied Mathematics, Physics, and Astronomy (IAMPA 2025), pages 620-625
ISBN: 978-989-758-774-0
Proceedings Copyright © 2025 by SCITEPRESS – Science and Technology Publications, Lda.
indicators have also emerged as key determinants of
Bitcoin’s price. Factors such as interest rates and
inflation influence investor behaviour and,
consequently, Bitcoin valuation. For instance,
Shahzad et al. found that Bitcoin tends to exhibit a
negative correlation with traditional financial assets
during periods of market stress, suggesting its
potential as a haven under specific conditions
(Shahzad et al., 2020). Beyond economic
fundamentals, behavioural and psychological factors
are increasingly recognised as important influences.
Klein stated that Bitcoin’s value is heavily shaped by
market narratives, media coverage, and investor
sentiment, often resulting in “boom-bust” cycles.
This behaviour is closely linked to investor
psychology and herd behaviour (Klein, 2017).
Supporting this view, Beckmann et al. demonstrated
that social media activity and online search trends are
strongly correlated with Bitcoin price movements,
underlining the critical role of public perception and
sentiment in shaping market dynamics (Beckmann et
al., 2024).
Finally, regulatory developments and government
policies represent another major area of influence.
Regulatory announcements-including restrictions on
cryptocurrency trading, tax policies, and central bank
interventions-have been shown to trigger sharp
fluctuations in Bitcoin prices. Lashkaripour found
that the Bitcoin market reacts strongly to regulatory
policy changes, with the direction and magnitude of
these reactions depending on the nature of the
measures implemented (Lashkaripour, 2024). A
prominent example is the Chinese government’s ban
on Initial Coin Offerings (ICOs) and cryptocurrency
trading in 2017, which resulted in a significant
decline in Bitcoin prices, highlighting the market’s
sensitivity to regulatory uncertainty (Okorie and Lin,
2020).
2 METHODOLOGY
2.1 Data Source
The data used in this study is from Kaggle, and the
dataset is owned by Zielak. It has a high usability
rating of 10.0 and has been downloaded over 172000
times, indicating its popularity and reliability among
data analysts and researchers. The dataset contains
detailed information on a total of 3,649 participants,
is provided in CSV format, and notably does not have
any missing values, which ensures the integrity and
completeness of the analysis. Additionally, the
dataset has been widely used in various machine
learning and statistical modeling tasks, making it a
suitable and credible source for this study.
2.2 Sample Selection
In order to understand the long-term trend of the
Bitcoin price, this paper will use a time series model
to analyse the price trend using time series data. The
steps include data collection, preprocessing, feature
engineering, model training and evaluation. The
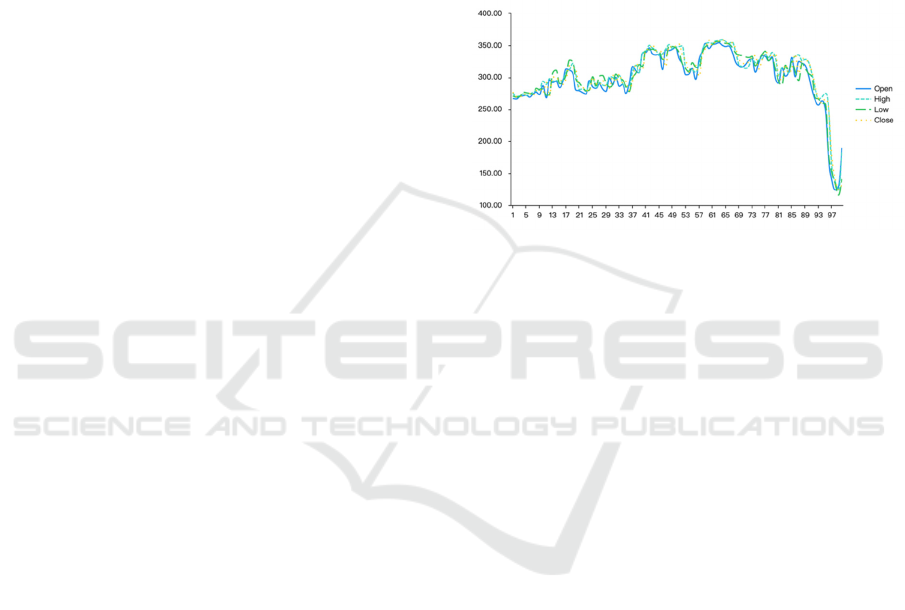
following figure shows the initial time series plot of
the data .
Figure 1: 2017-2023 Bitcoin Price Action (Picture credit:
Original)
This time series plot Figure 1 illustrates the trend of
Bitcoin prices from 2017 to 2023. Several prominent
surges and drops can be observed, corresponding to
key market events such as bull runs in late 2017 and
early 2021, as well as sharp declines during
regulatory crackdowns and macroeconomic
tightening. The pronounced volatility highlights the
need for robust time series models to account for non-
stationary behaviours.
2.3 Experimental Design
The core model used in this study is the
AutoRegressive Integrated Moving Average
(ARIMA) model, which is well-suited for univariate
time series forecasting (Zhang et al., 2003). The
general form of an ARIMA(p,d,q) model is:
𝑌
=𝑐𝜑
𝑌
𝑡1
⋯𝜑
𝑌
𝑡𝑝
𝜃
𝜀
𝑡1
⋯𝜃
𝜀
𝑡𝑞
𝜀𝑡 (1)
Where p is the autoregressive order, d is the degree of
differencing, and q is the moving average order. The
model selection was based on Autocorrelation
Function (ACF) and Partial Autocorrelation Function
(PACF) plots. The final selected model was ARIMA
(3,1,1), which demonstrated robust forecasting
performance in both the training and test sets.
Analysis of Bitcoin Price Forecasting and Related Influencing Factors
621
3 RESULTS AND DISCUSSION
3.1 Definition of the Variables
This table 1 provides a clear definition of the key
variables used in the analysis. 'Open', 'High', 'Low',
and 'Close' represent the opening, highest, lowest, and
closing prices of Bitcoin, respectively. These
variables are critical for constructing meaningful
features in time series modelling. Among them, the
closing price is selected as the main dependent
variable for prediction, as it best reflects the daily
summary value and is widely used in financial
forecasting.
Table 1: Name and Definition of the Variables
Name of Variables Definition of the Variables
Open Bitcoin Opening Price (US $)
Hi
g
h Bitcoin O
p
enin
g
Price
(
US $
)
Low Bitcoin Opening Price (US $)
Close Bitcoin O
p
enin
g
Price
(
US $
)
3.2 ADF Test Analyse
This table 2 presents the results of the Augmented
Dickey-Fuller (ADF) test applied to the closing price
series. The test statistic is -9.744 with a p-value of
0.000, which is lower than all critical values at the 1%,
5%, and 10% levels. This strongly rejects the null
hypothesis of a unit root, confirming that the first-
order differenced series is stationary and suitable for
ARIMA modelling.
Table 2: Close-ADF Check list
Difference
Order
t p
Critical Value
1% 5% 10%
1 -9.744 0.000 -3.499 -2.892 -2.583
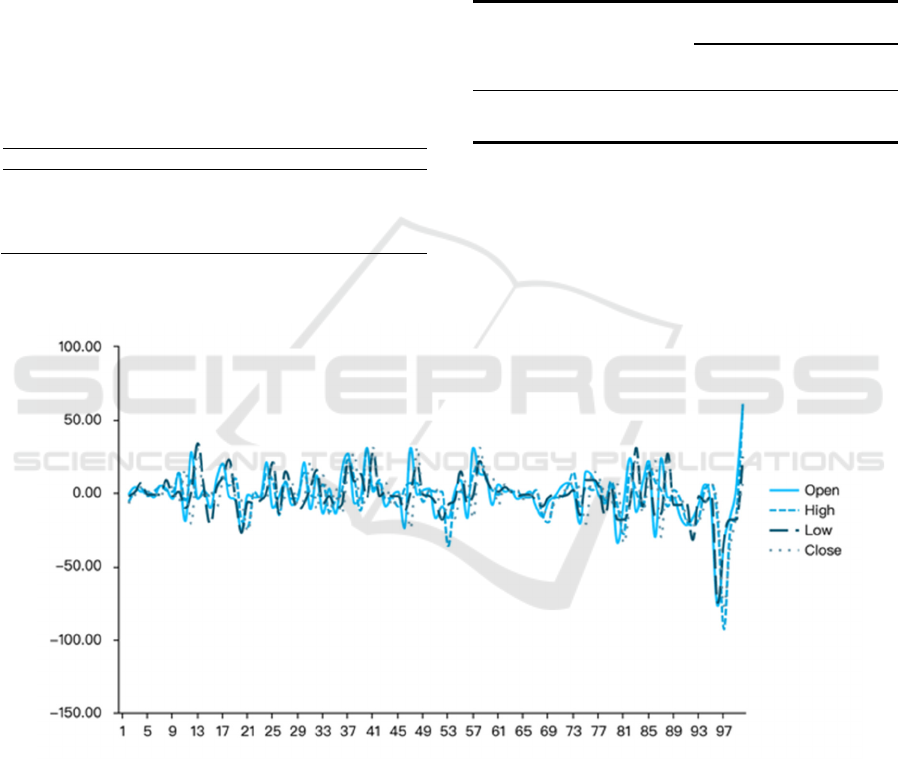
The figure 2 shows the transformed series after
applying first-order differencing. The resulting data
appear to fluctuate around a constant mean with
relatively stable variance, indicating that the non-
stationarity in the original series has been removed.
Figure 2: First order difference sequence diagram (Picture credit: Original).
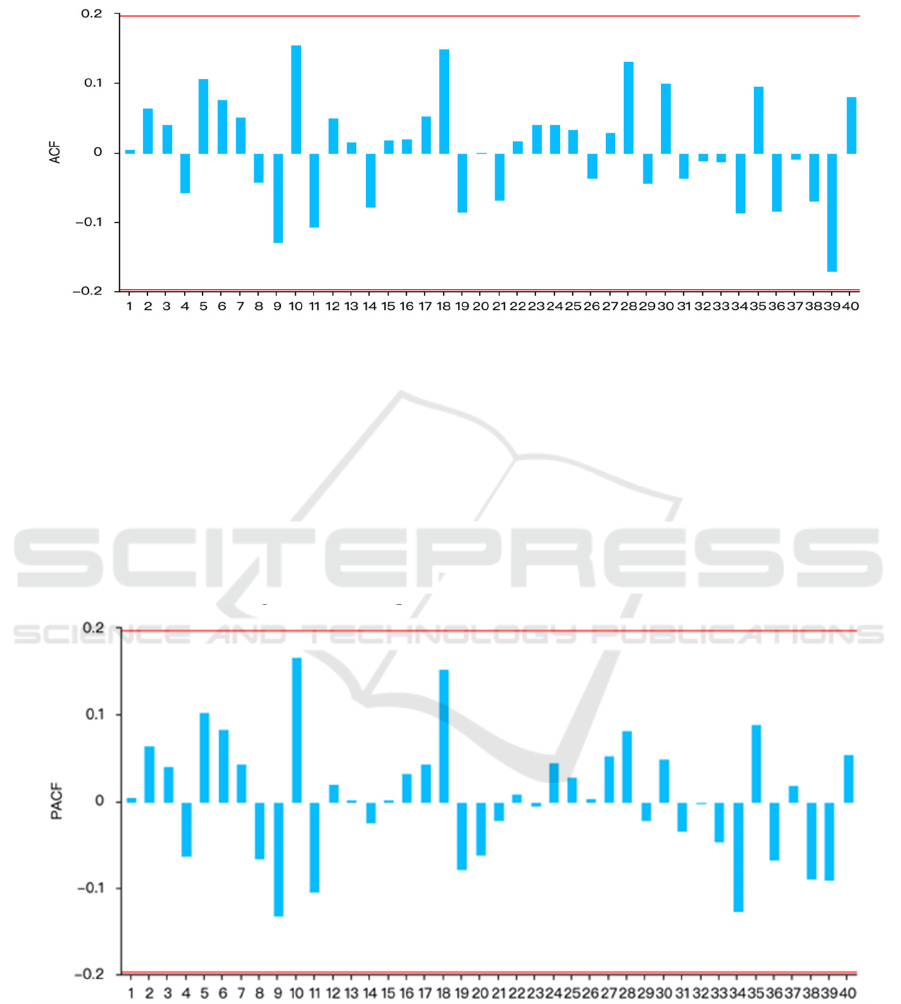
3.3 ACF and PACF Test
The Figure 3 ACF plot displays significant
correlations at lags 1 to 3, gradually tapering off. This
pattern suggests the presence of a moving average
(MA) component in the time series data, which plays
a vital role in modelling the random shock effects of
prior periods on current Bitcoin prices. Specifically,
the sustained correlation at early lags indicates that
recent past errors still carry predictive power for
future observations. In the context of Bitcoin price
movements, this result reflects the asset’s
susceptibility to short-term noise and external events,
such as sudden news, regulatory developments, or
investor reactions to macroeconomic announcements.
IAMPA 2025 - The International Conference on Innovations in Applied Mathematics, Physics, and Astronomy
622
These transient shocks-whether driven by a market
crash, positive sentiment on social media, or abrupt
liquidity movements-create residual effects that
persist for a few days before fading.
Figure 3: ACF plot (Picture credit: Original)
By identifying these lagged relationships, the MA
component in the ARIMA model helps smooth out
short-term volatility, enabling the model to better
estimate the underlying price trend. Given Bitcoin’s
well-documented sensitivity to speculation and high-
frequency trading, incorporating the MA(q) structure
allows for a more refined capture of these temporary
distortions. Therefore, the findings from the ACF plot
are not just statistically informative-they directly
support a more accurate forecasting approach for a
financial asset like Bitcoin, which is frequently
affected by episodic market behaviours. These
insights justify the inclusion of a single moving
average term (q = 1) in the ARIMA (3,1,1) model,
balancing responsiveness to shocks while avoiding
overfitting in a high-volatility environment.
Figure 4: PACF plot (Picture credit: Original)
The PACF plot shows significant spikes at lags 1 to 3
before cutting off, indicating the presence of a strong
autoregressive (AR) structure in the time series
(Figure 4). Each spike implies a direct relationship
between Bitcoin’s current closing price and its values
in the preceding days, independent of intermediate
lags. This autocorrelation pattern reveals that Bitcoin
prices exhibit temporal dependencies-meaning recent
price levels have a strong and direct influence on
subsequent prices. In financial terms, this behaviour
Analysis of Bitcoin Price Forecasting and Related Influencing Factors
623

is consistent with momentum trading, market
memory, and investor psychology-where previous
gains or losses tend to influence current market
behaviour due to trend-following strategies or fear-
of-missing-out (FOMO) phenomena.
By incorporating up to three AR terms (𝑝 = 3),
the model captures this serial dependence, allowing it
to learn from recent trends and apply them to future
predictions. This is particularly important in
cryptocurrency markets, where price inertia often
emerges from collective behaviour and delayed
reactions to news. For example, a bullish trend
initiated by positive regulatory news or institutional
adoption may persist over several days as more
participants join the market. Likewise, a sudden drop
may extend over multiple sessions due to panic
selling. The PACF structure helps capture this lagged
momentum. As a result, the choice of 𝑝 = 3 in the
ARIMA (3,1,1) model is not arbitrary-it reflects the
behavioural underpinnings of the Bitcoin market and
enhances the model’s ability to replicate its empirical
price dynamics. When used in tandem with
differencing (𝑑 = 1) and MA components, the AR
terms help stabilize forecasts while accounting for
intrinsic patterns in the data.
3.4 ARIMA Model
The ARIMA model results show that among the
autoregressive (AR) and moving average (MA)
terms, some parameters are statistically significant.
Specifically, the second autoregressive term (𝛼
) has
a coefficient of 0.937 with a p-value of 0.000,
indicating a strong positive and statistically
significant effect at the 1% level. This suggests that
past values, particularly those lagged by two periods,
have a substantial influence on the current price trend.
In contrast, the first autoregressive term (𝛼
) and the
third autoregressive term (𝛼
) are not statistically
significant (p-values of 0.816 and 0.632 respectively),
implying their limited explanatory power in the
model (Table 3).
For the moving average component, 𝛽
is
estimated at 0.945 with a p-value of 0.000,
demonstrating a significant positive impact. The high
significance of 𝛽
suggests that past forecast errors
are highly influential in shaping the current
observations, reflecting the market’s sensitivity to
unexpected shocks or noise. The model achieves an
Akaike Information Criterion (AIC) of 851.152 and a
Bayesian Information Criterion (BIC) of 866.783,
indicating a reasonably good model fit relative to
alternative specifications.
The strong significance of the second-order
autoregressive term (𝛼
) highlights the inertia and
memory effect in Bitcoin prices, where movements
from two periods ago exert a lasting impact on the
present. This characteristic aligns with the speculative
nature of cryptocurrency markets, where price trends
are often amplified over short time horizons due to
herd behaviour and momentum trading.
Similarly, the significant moving average term
(𝛽
) reflects the persistence of shocks in the market.
A large 𝛽
coefficient implies that deviations from
expected prices are not rapidly corrected but instead
influence future prices, underscoring the market’s
inefficiency and the role of sentiment-driven
volatility. This is consistent with the behaviour
observed in Bitcoin markets, where news events,
regulatory changes, and speculative trading can create
price distortions that last over multiple periods.
Table 3: ARIMA (3,1,1) model results
Term
Coefficient Standard error z p 95% CI
Constant term c 14.143 23.351 0.606 0.545 -31.624 ~ 59.910
AR
α1 0.063 0.271 0.232 0.816 -0.468 ~ 0.594
α2 0.937 0.222 4.225 0.000 0.502 ~ 1.372
α3 -0.054 0.112 -0.479 0.632 -0.273 ~ 0.166
MA
β
1 0.945 0.263 3.587 0.000 0.429 ~ 1.461
Remarks:AIC= 851.152
BIC= 866.783
IAMPA 2025 - The International Conference on Innovations in Applied Mathematics, Physics, and Astronomy
624
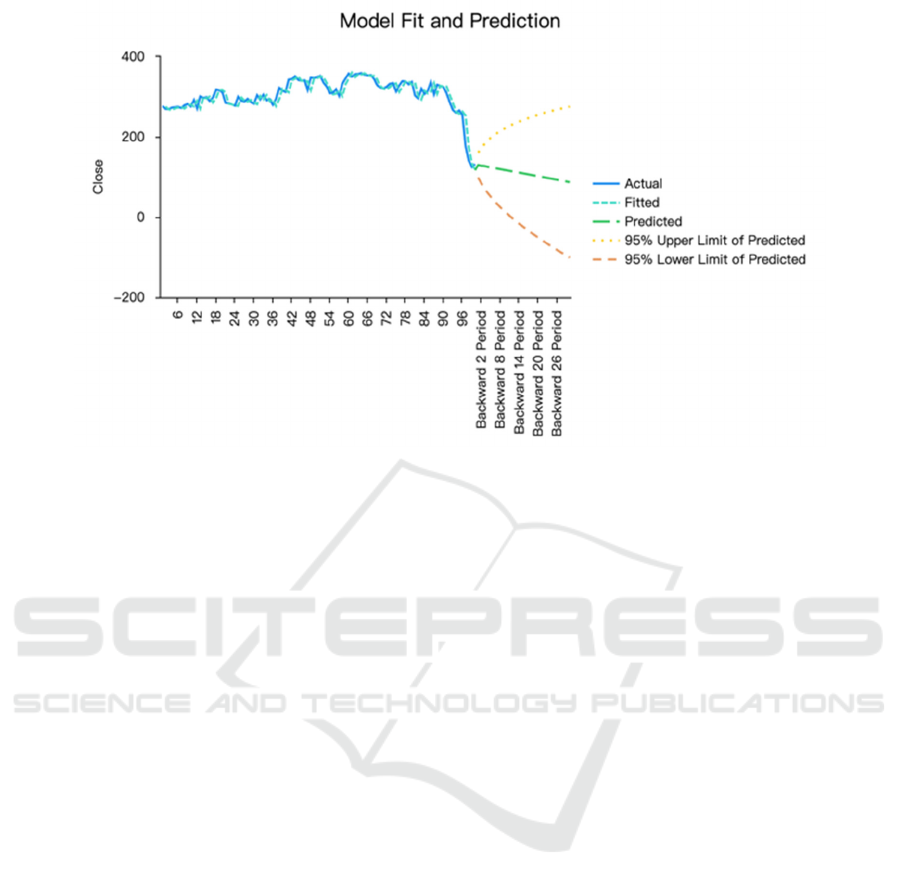
Figure 5: Model Fit and Prediction (Picture credit: Original).
This graph compares the fitted ARIMA model values
with actual observed Bitcoin prices (Figure 5). The
model tracks the historical trends well, especially
during the mid-term periods, although some deviation
occurs during extremely volatile price movements.
Nonetheless, the model provides a reliable foundation
for short-term forecasting.
4 CONCLUSION
Since the birth of Bitcoin in 2009, its price has
experienced drastic fluctuations, which makes
Bitcoin price forecasting and influencing factors a
popular topic in financial market research. Since the
Bitcoin market is affected by various factors such as
supply and demand, macroeconomic policies,
investor sentiment, etc., how to use a suitable time
series model to make effective forecasts is a question
worth exploring. ARIMA, as a classic time series
analysis method, can fit the price trend better after
data smoothing. Therefore, in this paper, the ARIMA
(3,1,1) model is used for Bitcoin price prediction and
its performance is evaluated. And the prediction was
made based on the historical data from 2017-2023.
The experimental results show that the model can
effectively capture the long-term trend of bitcoin
price and has high prediction accuracy in the short
term. Through model evaluation, this paper finds that
ARIMA (3,1,1) outperforms the linear regression
model in terms of mean square error (MSE) and root
mean square error (RMSE).
REFERENCES
Acikgoz, T. 2025. Gold and Bitcoin as hedgers and safe
havens: Perspective from nonlinear dynamics,
Resources Policy, 102, 105489.
Beckmann, J., Geldner, T. Wustenfeld, J. 2024. The
relevance of media sentiment for small- and large-scale
bitcoin investors, Journal of International Financial
Markets, Institutions and Money, 92, 1042-4431.
Chang, P.C., Liu, C H. 2008. A tsk type fuzzy rule based
system for stock price prediction. Expert Systems with
Applications, 34(1), 135-144.
Dirk, G., Thomas, D., Konstantin, K. 2018. Bitcoin, gold
and the US dollar-A replication and extension, Finance
Research Letters, Elsevier, 25, 103-110.
Klein, T. 2017. Dynamic correlation of precious metals and
flight-to-quality in developed markets, Finance
Research Letters, 23, 283-290.
Lashkaripour, M. 2024. Some stylized facts about bitcoin
halving. Finance Research Letters, 69, 106198.
Okorie, D., Lin, B. 2020. Did China’s ICO ban alter the
Bitcoin market? International Review of Economics &
Finance, 69, 977-993.
Shahzad, S., Bouri, E., Roubaud, D., Kristoufek, L. 2020.
Safe haven, hedge and diversification for G7 stock
markets: Gold versus bitcoin, Economic Modelling, 87,
212-224.
Yu, Y., Tong, Y., Qiu, X.Y. 2025. Analysis of Factors
Influencing Bitcoin Price Volatility. Finance and
Management, 5, 54-58.
Zhang, L., et al. 2003. Energy clearing price prediction and
confidence interval estimation with cascaded neural
networks. IEEE Transactions on Power Systems.
Analysis of Bitcoin Price Forecasting and Related Influencing Factors
625
