
Airline Passenger Satisfaction Prediction and Key Influential Factors
Identification Based on Logistic Regression and Random Forest
Jiayi Xue
a
School of Mathematics and Statistics, Donghua University, Shanghai, China
Keywords: Logistic Regression, Random Forest, Airline Passenger Satisfaction.
Abstract: The demand for tourism has grown rapidly since the post-pandemic reopening, and the tourism industry has
ushered in a new wave of recovery. How airlines can provide a flight experience that satisfies travellers has
once again become a matter of importance. This study aims to model airline passenger satisfaction and screen
some of the factors that have the greatest impact on the level of satisfaction. First, dimensionality reduction
of the dataset was realized through the principal component analysis method. The study then applied logistic
regression and random forest algorithms and compared both results, using confusion matrices and various
model metrics. It was found that the random forest performed better than the logistic regression algorithm,
with an accuracy of 92% vs. 85%. This suggests that the Random Forest model is more suitable for this dataset.
Then random forest model was applied to rank the importance of features. It turns out that the priority of
digital experience services ranks high in the list, which also gives some indication of the direction of airline
services improvement. Future research could introduce deep learning models to optimize the performance by
fusing real-time data from multiple sources, while incorporating interpretable technologies to drive aviation
services towards precision and personalization.
1 INTRODUCTION
The popularity of social media enables airlines to
obtain customer opinions in a timelier manner, so that
they can respond quickly to passengers’ needs as well
as optimize service quality (Xiang & Gretzel, 2010).
In this context, how to provide passengers with a
satisfactory flight experience has become a key issue
for airlines to enhance their competitiveness.
Studies related to passenger satisfaction have
already been covered. Scholars have used different
methods to make predictions, many involving
machine learning models. For example, in Liu’s
report, methods such as decision trees are compared,
and the Categorical Boosting (CatBoost) algorithm
performs the best, with an accuracy of 96.25% (Liu,
2022). The Multiple Adaptive Regression Spline
(MARS) model proved to be excellent in predicting
airline passenger satisfaction in Alharithi’s paper, and
the coefficient of determination of the established
model is 0.7078 (Alharithi et al., 2025). In a similar
domain, relevant predictions with four machine
learning models about passenger satisfaction in
a
https://orcid.org/0009-0000-7930-6720
public transport are made. And it came out that
random forest was a good choice, with an accuracy
rate of 74% (Ruiz et al., 2024).
In terms of the influencing factors of satisfaction,
some studies have also discussed it. Some scholars
used least squares regression to show that service
quality and trust have a greater impact on satisfaction
than other personal characteristics of passengers
(Leon & Dixon, 2023). The Meta-analysis method
was also used, and in-flight services were identified
as the most influential factor (Eshaghi et al., 2024).
According to the above background, the purpose
of this paper is to establish and compare the
prediction of airline passenger satisfaction based on
logistic regression and random forest models, and to
analyze the main factors affecting satisfaction, to
provide directional guidance to airline companies.
2 METHODS
2.1 Data Source
The empirical data employed in this study originated
from a structured questionnaire-based dataset from
610
Xue, J.
Airline Passenger Satisfaction Prediction and Key Influential Factors Identification Based on Logistic Regression and Random Forest.
DOI: 10.5220/0013834200004708
Paper published under CC license (CC BY-NC-ND 4.0)
In Proceedings of the 2nd International Conference on Innovations in Applied Mathematics, Physics, and Astronomy (IAMPA 2025), pages 610-614
ISBN: 978-989-758-774-0
Proceedings Copyright © 2025 by SCITEPRESS – Science and Technology Publications, Lda.
five major global airline alliances during 2018-2020
(Kaggle, 2020). It included comprehensive records of
service journey analytics and satisfaction metrics for
a cohort exceeding 25,000 international air travellers.
2.2 Variables and Data Pre-Processing
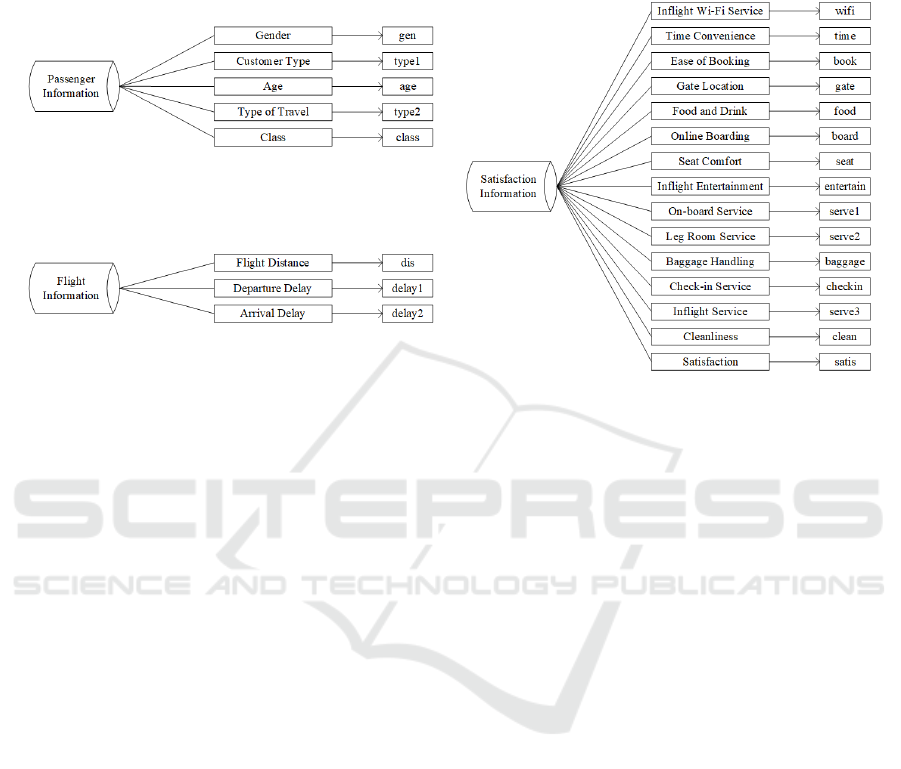
The original dataset contains 23 fields. Figure 1
classifies the variables and newly names each of them
for ease of viewing.
Figure 1: Dataset Field Information (Photo/Picture credit: Original).
Multiple categorical variables are expressed in
textual formats. To ensure computational stability and
enhance analytical precision, distinct numerical
identifiers were systematically assigned to each
categorical descriptor through an ordinal encoding
schema during the pre-processing phase.
83 instances were identified as incomplete data
entries. Given the substantial sample size, these
deficient records, representing merely 0.33% of the
total dataset, were excluded to preserve data integrity
since this removal induced a negligible impact on
statistical validity.
2.3 Variable Selection
To optimize workflow efficiency, given the extensive
field variables in the dataset, this study implemented
a dual-strategy approach for data refinement. First, a
randomized sampling technique was employed to
select 6,000 representative entries, ensuring the
subsample accurately reflects the population
characteristics. Subsequently, principal component
analysis (PCA), an established dimensionality
reduction technique, was systematically applied to
address multidimensional complexity. For enhanced
analytical precision, components meeting cumulative
contribution rate criteria (threshold >80%) were
prioritized for subsequent modelling processes to
maintain robust predictive classification capabilities.
2.4 Model Introduction
For the classification of satisfaction, two machine
learning models were used in this research: logistic
regression and random forest.
Logistic regression is a probabilistic classification
model that applies a sigmoid function to map linear
combinations of features into probability estimates. It
is very appropriate to use this model to solve the
problem of handling dichotomous target variables.
Random forest, as a typical algorithm of integrated
learning, reduces the risk of overfitting through the
voting mechanism. It is also great for solving
problems of categorization.
Both models were common and direct machine
learning models with relatively high accuracy. The
entire dataset will be divided into the training set and
testing set in a ratio of 7:3. For the evaluation of the
models, the two models will be compared based on
the confusion matrices of the two models and various
metrics (including Precision, F1-score, etc.).
The identification of key influential factors also
included the operation of logistic regression and
random forest. The feature importance values of each
feature were calculated based on the two models, and
the accuracy ratio of the two models was used as the
weight, which was used as the comprehensive score
of each feature. The formula for the composite score
is:
Airline Passenger Satisfaction Prediction and Key Influential Factors Identification Based on Logistic Regression and Random Forest
611
𝑆𝑐𝑜𝑟𝑒 = 𝑤
∙𝐼
+𝑤
∙𝐼
(1)
Here, 𝑤
and 𝑤
represent the weights of the
logistic regression and random forest scores,
respectively, and 𝐼
and 𝐼
are the importance
scores of each of the two models. The values of 𝐼
and 𝐼
will be substituted after normalization to
prevent the effect of too large a difference in feature
importance between the two models.
3 RESULTS AND DISCUSSION
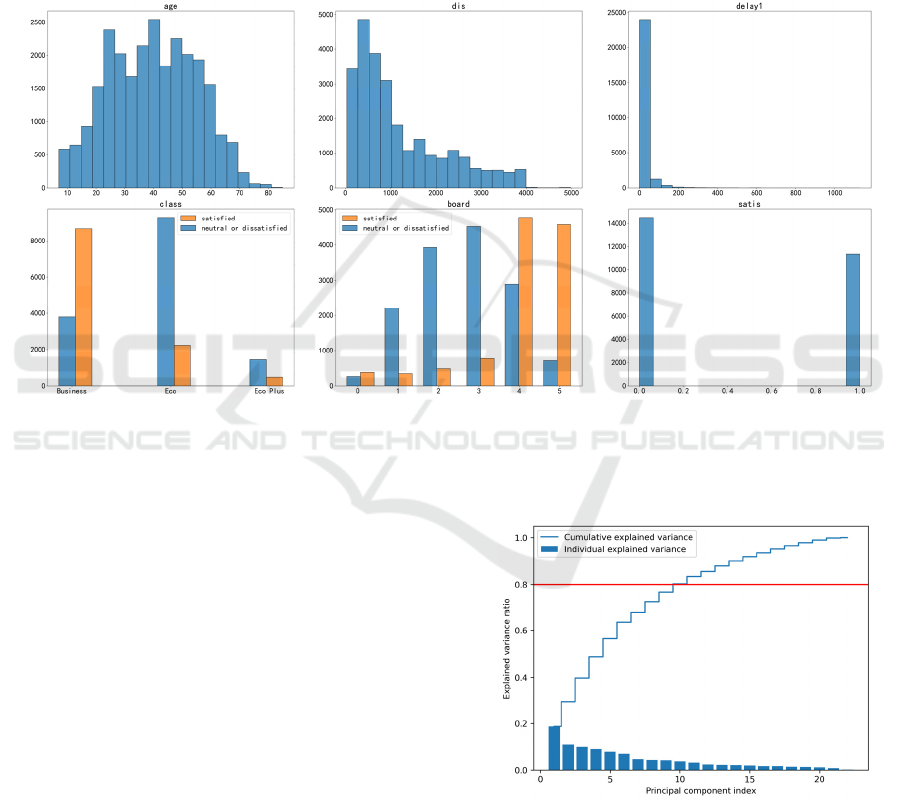
3.1 Data Distribution
An initial visual analysis of the distribution of the
individual characteristics is provided by histograms.
Given that many of the fields in the dataset are
categorical fields, only the histograms of class, board
and satis are selected for display here, and the other
fields of type numeric, age, dis, and delay1, are also
displayed in Figure 2.
Figure 2: Histogram of Selected Elements (Photo/Picture credit: Original).
Figure 2 visualizes the distribution of the dataset,
characterized by the following main points: a
predominance of young and middle-aged people,
mostly short-haul flights, and a high number of
people of all types and giving all ratings. There is
little difference in the number of customers who are
overall ‘satisfied’ or ‘neutral or dissatisfied’ at the
end, showing that the distribution of the dataset
performs well.
3.2 Data Dimensionality Reduction
Firstly, the Kaiser-Meyer-Olkin (KMO) test was
performed on the dataset to verify its suitability for
PCA. The results showed that the overall value of its
KMO test was 0.74, which was suitable for data
dimensionality reduction using PCA. Before
performing PCA, the dataset was prioritized for
standardization, considering that fields such as Flight
Distance had a large order of magnitude difference in
comparison to the fields of satisfaction level. The
variance contribution rate obtained using PCA is
shown in Figure 3.
Figure 3: Cumulative Contribution Variance Plot
(Photo/Picture credit: Original).
The principal components that made the total
variance contribution greater than 80% were
screened, with a result in 10 components. The specific
variance contributions were shown in Table 1.
IAMPA 2025 - The International Conference on Innovations in Applied Mathematics, Physics, and Astronomy
612
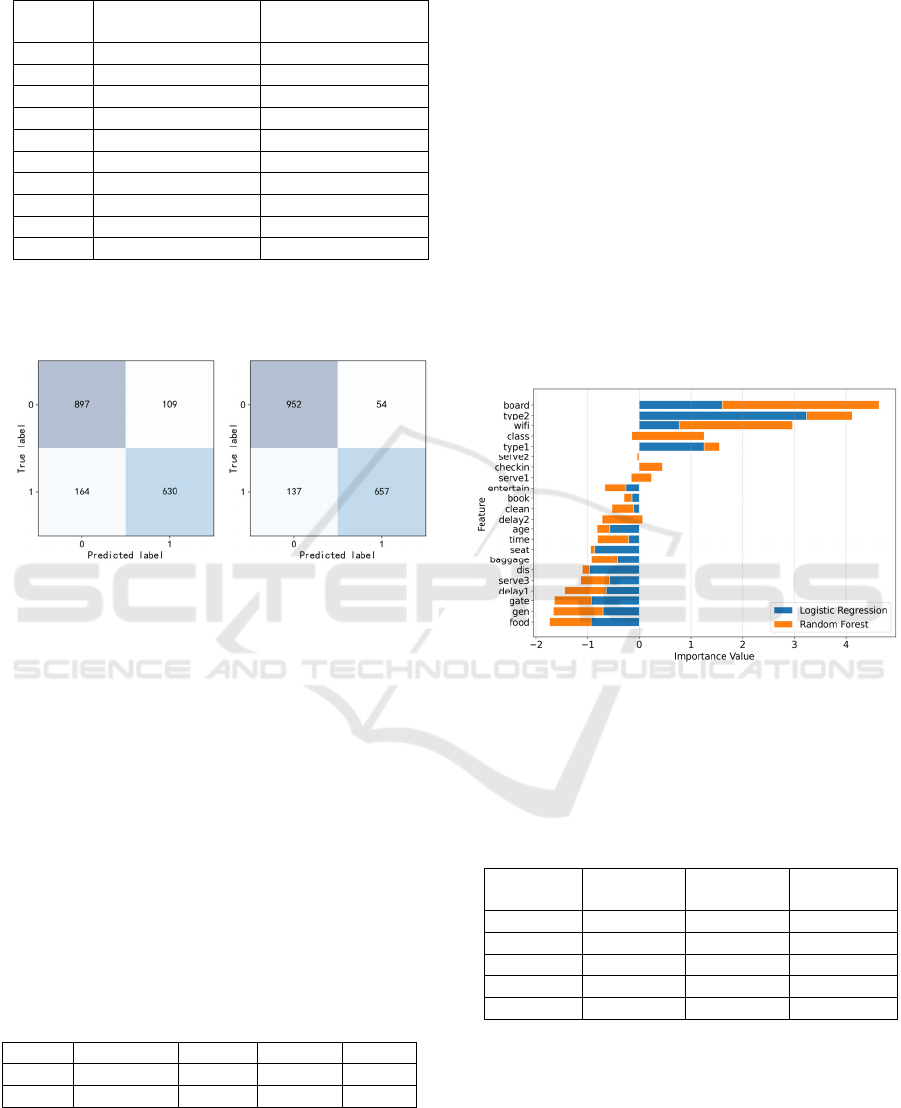
Table 1: Principal Component Contribution Rate
Feature Proportion of
Variance
Cumulative
Proportion
p
c1 0.1868 0.1868
p
c2 0.1099 0.2967
p
c3 0.1006 0.3972
p
c4 0.0893 0.4865
p
c5 0.0779 0.5645
p
c6 0.0629 0.6337
p
c7 0.0470 0.6807
p
c8 0.0440 0.7246
p
c9 0.0421 0.7667
p
c10 0.0365 0.8031
3.3 Comparison of the Confusion
Matrix of the Two Models
(a) (
b
)
Figure 4: Confusion Matrix of the Two Models
(Photo/Picture credit: Original).
Figure 4 shows the confusion matrices for logistic
regression and random forest successively. Here, both
use 1,800 samples, and it is clear that random forest
has larger values on the diagonal, i.e., it judges more
correctly and misjudges fewer dissatisfied customers
as satisfied (54 vs. 109).
3.4 Comparison of the Indicators of the
Two Models
To provide a clearer and more intuitive comparison
of the logistic regression (LR) and random forest
(RF), some relevant indicators are listed in Table 2.
Table 2: Performance Evaluation Indicators of the Two
Models
Model Precision Recall F1-score MCC
LR 0.8525 0.7935 0.8219 0.6915
RF 0.9241 0.8275 0.8731 0.7859
A comparative analysis of model performance
metrics reveals distinct advantages of the random
forest algorithm over logistic regression across all
evaluation criteria. The random forest shows its better
accuracy, improved sensitivity, better harmonic
balance, and overall classification robustness.
In contrast, logistic regression’s linear decision
boundaries appear less suited to the underlying data
structure, as evidenced by its comparatively
constrained metric performance across all evaluation
dimensions.
3.5 Identification of Key Influential
Factors
Based on the logistic regression and random forest
model, the importance value of the features can be
further calculated, and the combined score can then
be calculated. According to the precision, the
combined score formula can be written as:
𝑆𝑐𝑜𝑟𝑒 = 0.4771 ∙ 𝐼
+ 0.5229 ∙ 𝐼
(2
)
The result of the operation is shown in Figure 5.
Figure 5: Feature Importance (Photo/Picture credit:
Original).
The factors with a combined score greater than 0
were selected as key factors, and their importance
values are specified in Table 3.
Table 3: Importance Value of Key Influential Factors
Feature LR
Im
p
ortance
RF
Im
p
ortance
Combined
Score
b
oar
d
1.6001 3.0420 2.3541
type2 3.2350 0.8894 2.0085
wifi 0.7725 2.1927 1.5151
class -0.1488 1.4062 0.6643
t
yp
e1 1.5495 -0.2962 0.5844
The highest importance score is for ‘Online
Boarding’, indicating that a convenient boarding
process has a greater impact on passenger experience.
The following factors include ‘Type of Travel’,
‘Inflight Wi-Fi Service’, ‘Class’, and ‘Customer
Type’, reflecting the importance of the customer’s
sense of lived experience as well as the differences in
passenger needs for different travel purposes.
Airline Passenger Satisfaction Prediction and Key Influential Factors Identification Based on Logistic Regression and Random Forest
613

3.6 Discussion
Compared with similar articles, this paper has some
advantages, mainly in the following aspects. In the
data processing part, principal component analysis
was used to make the subsequent processing more
energy efficient (Liu, 2022; Alharithi et al., 2025). In
feature screening, the results of two models were
combined, which may reduce the effect of one model
bias (Salah, Lincy, & Al, 2024).
However, there is still some space left to improve
in the article. For example, in the result of the
prediction model, the accuracy of the random forest
model is not particularly high. More models can be
chosen for prediction. For example, a study of an
integrated approach that incorporates Convolutional
Neural Networks (CNN) and Long Short-Term
Memory (LSTM) showed that it can outperform the
average accuracy of traditional machine learning
models by about 10 percent when predicting customer
churn risk (Park et al., 2022). Besides, the content of
the dataset could be further supplemented. For
example, a user comment module could be added to
process natural language so as to better understand
the users’ emotional bias (Kowalski, Esteve, &
Mikhaylov, 2020). Additionally, random forest itself
is not a interpretable model, and it is often difficult to
understand how the model makes its predictions.
Remedying this may require some auxiliary
optimizations such as the LIME interpretation
technique (Ribeiro, Singh, & Guestrin, 2016). These
techniques may be more capable of appearing
justified and convincing people emotionally.
4 CONCLUSIONS
By comparing the logistic regression algorithm and
random forest algorithm on the airline passenger
satisfaction prediction model, this study found that
the random forest algorithm has advantages in all
aspects, with a relatively high precision of over 90%.
The study then used the feature importance of random
forests to filter out several factors to be the most
influential features of satisfaction, showing that the
immediate experience of service quality, especially in
the field of online booking, has more predictive value
than the inherent user attributes. Thus, this study
provided direction for airlines to optimize their
services. The discussion of satisfaction models in this
study can be similarly applicable to the analysis of
other service industries.
Subsequent research can integrate more real-time
data (e.g., flight dynamics, user feedback) to build a
dynamic prediction system and introduce models
such as deep learning models to further improve the
performance. In addition, interpretable methods, such
as Shapley additive explanations(SHAP) values, can
be combined to better explain the mechanism of
feature effects, assist in the formulation of
differentiated service strategies, and promote the
development of aviation services in the direction of
precision and personalization.
REFERENCES
Alharithi, M., Almetwally, E. M., Alotaibi, O., Eid, M. M.,
El - kenawy, E. S. M., & Elnazer, A. A. 2025. A
comparative study of statistical and intelligent
classification models for predicting airlines passenger
management satisfaction. Alexandria Engineering
Journal, 119: 99-110.
Eshaghi, M. S., Afshardoost, M., Lohmann, G., & Moyle,
B. D. 2024. Drivers and outcomes of airline passenger
satisfaction: A Meta-analysis. Journal of the Air
Transport Research Society, 3, 100034.
Kaggle. 2020. Airline Passenger Satisfaction.
https://www.kaggle.com/datasets/teejmahal20/airline-
passenger-satisfaction
Kowalski, R., Esteve, M., & Jankin Mikhaylov, S.J. 2020.
Improving public services by mining citizen feedback:
An application of natural language processing. Public
Administration, 98(4), 1011 - 1026.
Leon, S., & Dixon, S. 2023. Airline satisfaction and
loyalty: Assessing the influence of personality, trust
and service quality. Journal of Air Transport
Management, 113, 102487.
Liu, Y.B. 2022. Prediction of Airline Passenger Satisfaction
Based on Machine Learning. Technology Venture
Monthly, 35(4), 142-145.
Park, S.-H., Kim, M.-Y., Kim, Y.-J., & Park, Y.-H. 2022.
A Deep Learning Approach to Analyze Airline
Customer Propensities: The Case of South Korea.
Applied Sciences, 12(4), 1916.
Ribeiro, M. T., Singh, S., & Guestrin, C. 2016. "Why
Should I Trust You?" Explaining the Predictions of Any
Classifier. 22nd ACM SIGKDD International
Conference on Knowledge Discovery and Data Mining
(KDD), San Francisco, CA., 1135 - 1144.
Ruiz, E., Yushimito, W. F., Aburto, L., & de la Cruz, R.
2024. Predicting passenger satisfaction in public
transportation using machine learning models.
Transportation Research Part A, 181, 103995.
Salah-Ud-Din, M., Lincy.S.S, B. T., & Al Ali, H. 2024.
Exploratory Data Analysis and Prediction of Passenger
Satisfaction with Airline services. New Trends in Civil
Aviation, NTCA 2024, 295-302
Xiang, Z. & Gretzel, U. 2010. Role of Social Media in
Online Travel Information Search. Tourism
Management, 31(2), 179-188.
IAMPA 2025 - The International Conference on Innovations in Applied Mathematics, Physics, and Astronomy
614
