
Exploring the Influencing Factors of Automobile Prices Based on the
Dataset for Vehicle Price Prediction
Boyu Wang
a
School of Data Science and Artificial Intelligence, Dongbei University of Finance and Economics, Dalian,
Liaoning,116025, China
Keywords: Car Price, Production Year, Engine Displacement, Mileage.
Abstract: With the continuous development of the automotive market, the research on the influencing factors of car
prices plays a crucial role in industry decision-making and consumer guidance. However, previous studies on
the factors affecting car prices have only remained at the level of single variable analysis, lacking a systematic
analysis of the combined influence of multiple variables, making it difficult to provide a scientific basis for
market behavior. Therefore, this paper aims to study the influence mechanism of key variables such as
production year, engine displacement, and mileage on car prices. This study uses descriptive statistics,
correlation analysis, and multiple linear regression models to quantify the impact of each variable on car
prices. To address the issue of insufficient variable correlation analysis, correlation analysis is used to explore
the initial connections between variables. Further, through multiple linear regression models, the specific
impact of each factor on price is clarified. Based on 10,000 car data, the model was constructed, and it was
found that the production year has the most significant impact on price, followed by engine displacement and
mileage, with the model's explanatory power reaching 87.6%. The number of doors and the number of owners
have no statistically significant impact on price. These conclusions provide consumers with a "year + mileage"
dual-core evaluation framework.
1 INTRODUCTION
In the automotive market, the influencing factors of
car prices have always been the focus of attention for
consumers, automakers, and dealers. Understanding
these factors not only helps consumers make wiser
decisions when purchasing a car but also enables
automakers to formulate more competitive pricing
strategies and provides a basis for dealers to optimize
inventory management and cost control. Therefore,
exploring the influencing factors of car prices has
significant practical significance.
Previous studies have identified multiple key
factors that affect car prices. Firstly, brand is one of
the important factors influencing car prices. Luxury
brands such as BMW and Mercedes-Benz, with their
high quality and good market reputation, can usually
sell at higher prices (Wu, 2025). Secondly, different
models within the same brand also show significant
price differences. For instance, Toyota's Corolla, as a
family car for the general public, is relatively
a
https://orcid.org/0009-0004-4875-0967
affordable, while the Prado, as a mid-to-large SUV
with higher configurations, has a correspondingly
higher price (Luo, 2025). Additionally, the
production year also has a significant impact on car
prices. With technological advancements, newly
produced cars typically adopt more advanced
technologies and manufacturing processes, offering
better performance and safety, and thus command
higher prices (Zhao, 2023).
Engine size is another crucial factor. Cars
equipped with larger engines usually have stronger
power, but due to their higher manufacturing
difficulty and cost, they tend to be more expensive
(Deng et al., 2022). Meanwhile, with the increasing
awareness of environmental protection and the
innovation of energy technologies, the type of fuel
has become an increasingly significant factor
affecting car prices. Traditional gasoline and diesel
vehicles have obvious price differences due to fuel
costs and technological differences. However, hybrid
and electric vehicles, due to their high research and
600
Wang, B.
Exploring the Influencing Factors of Automobile Prices Based on the Dataset for Vehicle Price Prediction.
DOI: 10.5220/0013833900004708
Paper published under CC license (CC BY-NC-ND 4.0)
In Proceedings of the 2nd International Conference on Innovations in Applied Mathematics, Physics, and Astronomy (IAMPA 2025), pages 600-604
ISBN: 978-989-758-774-0
Proceedings Copyright © 2025 by SCITEPRESS – Science and Technology Publications, Lda.

development costs and rapid updates in battery
technology, experience greater price fluctuations
(Zhao, 2023). Moreover, the type of transmission also
affects car prices. Cars with automatic transmissions
are generally more expensive than those with manual
transmissions because automatic transmissions better
suit the driving habits of most consumers (Zhang,
2022).
Although previous studies have achieved certain
results in identifying the factors influencing car prices,
they generally suffer from the limitations of single
data sources and limited sample sizes, leading to an
insufficiently comprehensive coverage of scenarios
(Chen, 2023). Moreover, the existing analytical
methods are mostly simple correlation analyses,
failing to deeply explore the complex interactions
among various factors, leaving room for further
research.
To break through the limitations of previous
studies, this paper mainly uses correlation analysis
and multiple linear regression (MLR) analysis
methods to explore the influence of various factors on
car prices, reveal their intrinsic relationships, and
provide scientific decision-making bases for all
parties in the automotive market, promoting its
healthy development.
2 METHODS
2.1 Data Sources and Description
This paper is based on a car price prediction dataset
containing 10,000 entries from the Kaggle website,
which covers various aspects of information such as
brand, model, production year, engine size, fuel type,
transmission type, mileage, number of doors, and the
number of previous owners (Mustafa, 2025; Wang,
2023). Before the analysis, this study cleaned and
preprocessed the data to ensure its reliability. All the
data will be used in the subsequent research.
2.2 Selection and Explanation of
Indicators
Table 1 presents the selection and explanation table
of key indicators affecting car prices, listing seven
variable names such as year and engine size, and
briefly explaining the principles by which each
variable affects car prices.
Table 1: Key Indicators Selection and Explanation for Factors Affecting Automobile Prices
Number Variable Name Brief Description
x
1
Year New cars are usually more expensive
x
2
Engine Size Large engines are costly, making the car price higher
x
3
Mileage The higher the mileage, the lower the price usually is
x
4
Doors Different door numbers represent different models, and the prices vary
x
5
Owner Count Frequent changes of ownership lead to a lower price
2.3 Method Introduction
This study employs descriptive statistics, correlation
analysis, and MLR models for analysis. Descriptive
statistics are used to summarize the characteristics of
the data, revealing the central tendency and
dispersion of variables through the calculation of
means, standard deviations, and other indicators,
providing a foundational framework for subsequent
analysis. Correlation analysis, based on Pearson's
correlation coefficient, quantifies the strength and
direction of linear relationships between variables,
helping to identify those significantly related to car
prices and select core independent variables for
model construction. The MLR model is constructed
with car price as the dependent variable and x1, x2,
x3, x4, and x5 as independent variables, with the
formula as follows:
Price = β
+β
x
+β
x
+β
x
+β
x
+
β
x
+ε (1)
This method can control the influence of other
variables and independently assess the marginal
effect of each independent variable on the price. The
advantage of the model lies in its strong
interpretability, allowing for a direct comparison of
the degree of variable influence through standardized
coefficients. This method is particularly suitable for
the quantitative analysis of the combined influence of
multiple variables, breaking through the limitations of
single-variable analysis.
Exploring the Influencing Factors of Automobile Prices Based on the Dataset for Vehicle Price Prediction
601
3 RESULTS AND DISCUSSION
3.1 Descriptive Statistical Analysis
Through descriptive statistics of the variables, the key
results in Table 2 were obtained:
Table 2: Descriptive Statistics of Variables
Variable Case Number Average Value Standard Deviation
Effective Missing
Year 10000 0 2011.540 6.898
Engine Size 10000 0 3.001 1.149
Mileage 10000 0 149239.110 86322.349
Doors 10000 0 3.500 1.110
Owner Count 10000 0 2.990 1.423
Price 10000 0 8852.96 3112.597
Table 2 indicates that the production years of the
vehicles are mainly concentrated around 2011, with a
relatively concentrated time distribution. The average
engine displacement is 3.001, mainly medium
displacement. The standard deviation of mileage is as
high as 86,322.349, indicating significant differences
in vehicle mileage; the number of doors is mainly
concentrated between 3 and 4. The number of vehicle
owners fluctuates, but is mainly distributed around 3
people. The price of cars has a high degree of
dispersion and significant individual differences.
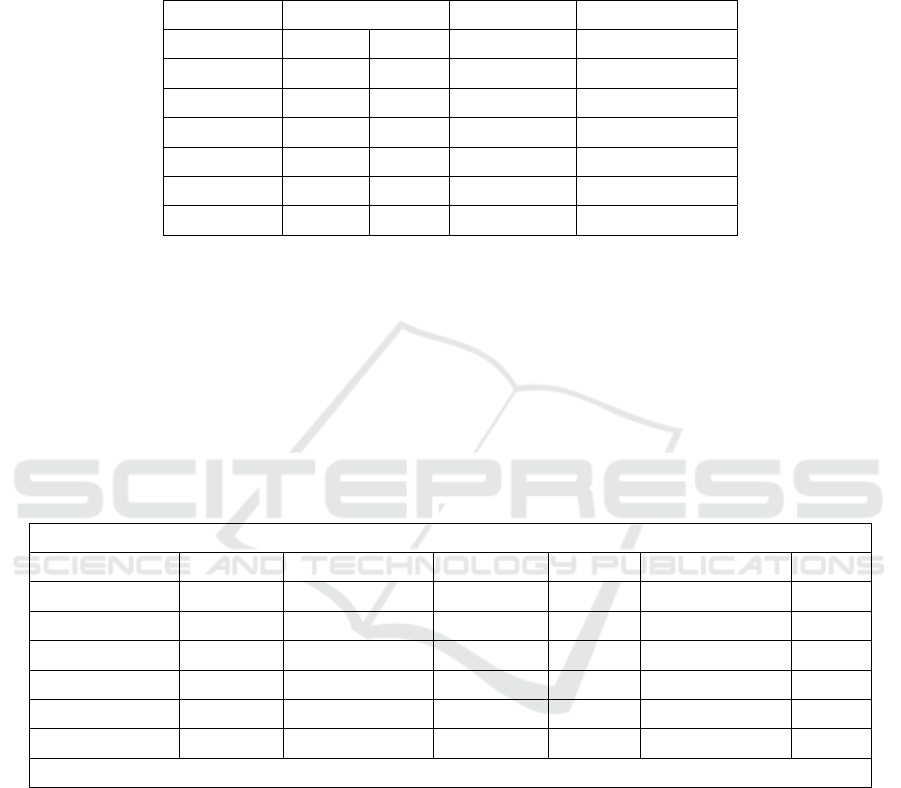
3.2 Correlation Analysis of Variables
and Prices
Through the correlation analysis of variables, the key
results in Table 3 were obtained:
Table 3: Correlation Coefficient Table of Key Variables Affecting Automobile Prices
Relevance
Year Engine Size Mileage Doors Owner Count Price
Year 1
Engine Size -0.001 1
Mileage -0.002 0.015 1
Doors 0.015 -0.01 0.008 1
Owner Count 0 0.007 0.006 -0.005 1
Price 0.663** 0.357** -0.551** 0.001 0.003 1
** At the 0.01 level (two-tailed), the correlation is significant.
Table 3 indicates that the production year is
significantly positively correlated with the car price;
the newer the year, the higher the price. Engine
displacement is significantly positively correlated
with the price; the larger the displacement, the higher
the price. Mileage is significantly negatively
correlated with the price; the more mileage, the lower
the price. However, the correlation coefficients of the
number of doors and the number of previous owners
with the car price are close to 0 and do not show a
significant correlation, indicating that these two
variables have little impact on the car price.
3.3 MLR Analysis
This study constructed an MLR model to explore the
key factors influencing car prices. The dependent
variable of the model is the car price, and the
independent variables include: production year,
engine size, mileage, number of doors, and number of
previous owners. The results are shown in Table 4:
IAMPA 2025 - The International Conference on Innovations in Applied Mathematics, Physics, and Astronomy
602
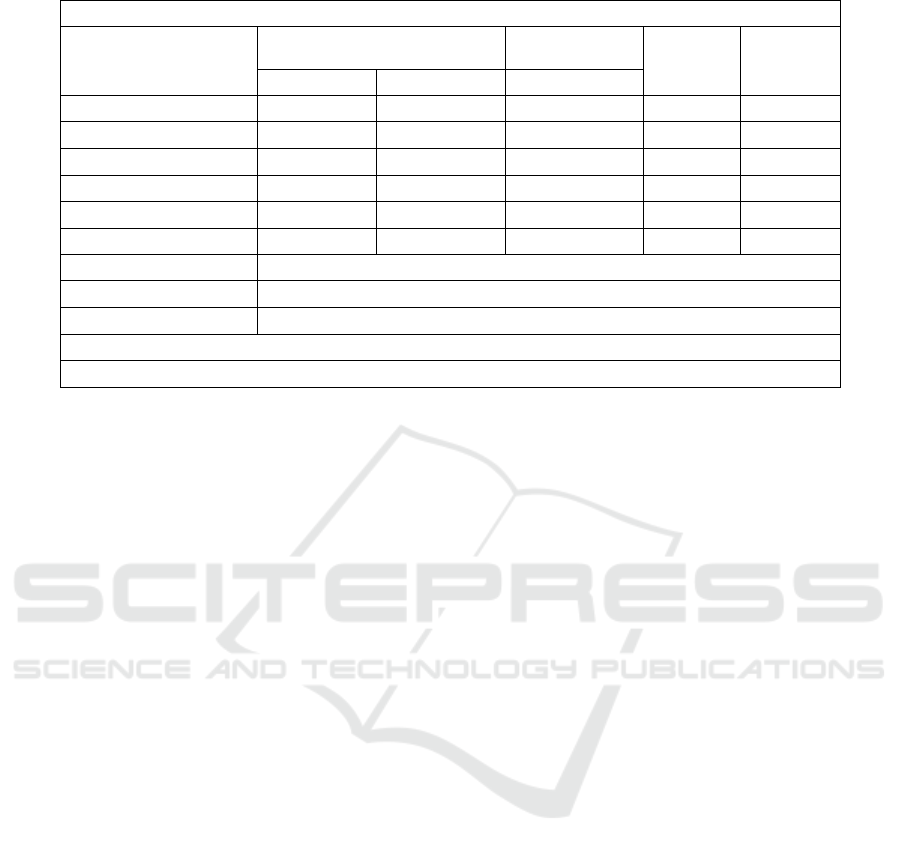
Table 4: Results of MLR Analysis of Factors Affecting Car Prices
Linear regression analysis results (n=10000)
Unstandardized coefficient
Standardized
coefficient
t p
β standard error Beta
Constant -592198.767 3196.549 - -185.262 0.000**
Year 298.801 1.589 0.662 188.033 0.000**
Engine Size 992.914 9.538 0.367 104.105 0.000**
Mileage -0.020 0.000 -0.555 -157.636 0.000**
Doors -3.732 9.875 -0.001 -0.378 0.705
Owner_Count 7.551 7.704 0.003 0.980 0.327
R² 0.876
Adjusted R² 0.876
F F (5,9994)=14132.594, p=0.000
Note: Dependent variable = Price
* p<0.05 ** p<0.01
As shown in Table 3, with price as the dependent
variable, year and engine size have a significant
positive impact on price (p < 0.01), with standardized
coefficients of 0.662 and 0.367 respectively; mileage
has a significant negative impact on price (p < 0.01),
with a standardized coefficient of -0.555; the number
of doors and the number of owners have no
significant impact on price (p values are 0.705 and
0.327 respectively), with standardized coefficients
close to 0. The model's R² is 0.876, and the adjusted
R² is also 0.876, indicating that the model explains
87.6% of the price variation, validating the model's
effectiveness and suggesting that the model accounts
for approximately 87.6% of the price variation, with
a very good fit. The F-statistic value is 14132.594,
with a p-value < 0.01, indicating that the model as a
whole is significant. In summary, year, engine size,
and mileage are the main factors affecting price. The
prediction formula is:
Price = −592198.767 + 298.801x
+
992.914x
− 0.020x
− 3.732x
+ 7.551x
(2)
3.4 Limitations Analysis
This study has certain limitations in analyzing the
factors influencing car prices. Although the
introduction emphasized the significant role of brand
and model in determining prices, in the actual
modeling process, due to the high diversity of brands
and models in the dataset leading to an excessive
number of categorical variables and insufficient
sample sizes for some niche brands or unpopular
models, to control the complexity of the model, these
variables were ultimately not included in the MLR
analysis(Hao, 2025). This means the model failed to
fully reflect the impact of brand premiums and the
differences between popular and niche models on
prices, which may lead to deviations in the
interpretation of real market prices.
Furthermore, the study only explored the
relationship between variables based on a linear
model, while in reality, car prices may be influenced
by nonlinear factors or interaction effects. For
instance, the impact of engine displacement on price
may vary depending on brand positioning, and the
depreciation effect of mileage may show nonlinear
attenuation over the years. Additionally, fuel type and
transmission type were not deeply explored as
categorical variables in the regression analysis, which,
to some extent, simplified the complex influence
mechanisms of their technical costs and market
acceptance on prices.
The singularity of the data source also limits the
coverage of the sample in terms of the range of car
models and regional market environments, resulting
in insufficient explanatory power for niche brands or
special models (Wu et al., 2025). Future research
could attempt to include brand and model as
categorical variables, adopt nonlinear models, or
combine more diverse data sources to more
comprehensively reveal the price influence
mechanism under the interaction of multiple variables.
4 CONCLUSION
This study, through descriptive statistics, correlation
analysis, and MLR models, found that production
year, engine displacement, and mileage are the main
factors affecting car prices. The newer the year, the
Exploring the Influencing Factors of Automobile Prices Based on the Dataset for Vehicle Price Prediction
603

larger the displacement, and the lower the mileage,
the higher the price, with the year having a relatively
more significant impact. The number of doors and the
number of previous owners have no significant
impact on price. The model's explanatory power
reached 87.6%, indicating that the selected variables
can effectively explain price variations. The research
results provide data support for consumers' car
purchase decisions, car manufacturers' pricing
strategies, and dealers' inventory management.
However, the study has certain limitations. Due to
the characteristics of the data and the complexity of
the model, variables such as brand and model that
may have significant impacts on prices were not
included in the analysis, and the differences in brand
premiums and model positioning were not fully
reflected. Only a linear model was used to examine
the relationship between variables, which may
overlook nonlinear effects or interaction effects. The
sample coverage of a single dataset is limited, and its
explanatory power for niche models or specific
markets is insufficient. Future research could include
brand and model variables, combine nonlinear
models or interaction terms, and more finely depict
the mechanism of multi-variable interaction, and
introduce more diverse data sources to enhance the
applicability of the conclusions to complex market
scenarios.
REFERENCES
Chen, J., 2023. Research on the Development of New
Energy Vehicles and Charging Demand Management
(Master’s Thesis). Beijing Jiaotong University, Beijing.
Deng, Y., Li, J., Ren, H., & Jiao, Q., 2022. Slow cook-off
characteristics of HTPB engines with different
structural sizes. In Journal of Energetic Materials,
30(2), 155-162.
Hao, X. J. 2025. Reflection on tax reform to promote
comprehensive green transformation. Fiscal Science,
(01), 91-101.
Luo, K., 2025. Analysis of Vehicle Recalls in 2024:
Exceeding Ten Million Again After Five Years. In
China Quality Herald, 1, 44.
Mustafa, Ö., 2025. car_price: A Car Price Dataset with 10,
000 Variables. In Kaggle. https://www.kaggle.com/dat
asets/mustafaoz158/car-price
Wang, J., 2023. Research on Two-Stage Data Pricing for
Data Market Transaction Volume (Master's Thesis).
Zhongnan University of Economics and Law, Wuhan.
Wu, B., 2025. How Can Automakers Attract Consumers
Beyond Price Wars?. In China Consumer News, (003).
Wu, Z., Yang, J., Zhang, F., & Chen, Z. 2024. Exploring
automobile brand power: a multi-dimensional approach.
Environment, Development and Sustainability, 1-34.
Zhang, L., 2022. Research on the Used-Car Price Problem
Based on Semi-parametric Models (Master's Thesis).
Chongqing Technology and Business University,
Chongqing.
Zhao, Y., 2023. Research on Combustion and Emission
Performance of Ignition-type M100 Methanol Engine
(Master’s Thesis). Taiyuan University of Technology,
Taiyuan.
IAMPA 2025 - The International Conference on Innovations in Applied Mathematics, Physics, and Astronomy
604
