
The Impact of Investor Sentiment Divergence on AH Share Premium:
Evidence from SMIC
Liqing Yin
a
Faculty of Economics and Management, South China Agricultural University, Wushan Street 483, Guangzhou, China
Keywords: AH Share Premium, Investor Sentiment, SMIC.
Abstract: As a matter of fact, plenty of Chinese companies increasingly choose to cross-list on both AH market.
However, many shares of Chinese companies listed on both sides of the border have a long history of high
AH share premiums. With this in mind, this study will take SMIC as an example to analyse the impacts,
whose AH share premium has been high for a long time. By means of using principal component analysis to
construct an index of investor sentiment difference between AH, this study will analyse the impact of investor
sentiment difference on its AH share premium, as well as further evaluate it based on the combination of
macro factors. According to the analysis, it is found that investor sentiment is closely related to AH share
premium, and the superimposed influence of macro factors and investor sentiment makes SMIC 's AH share
premium rate stay high for a long time. Overall, these results shed light on guiding further exploration of AH
share premium.
1 INTRODUCTION
Many Chinese companies are now successfully listed
on exchanges around the world, such as Hong Kong,
New York and London. The existence of A-shares
and H-shares provides Chinese companies with
multiple listing options. AH-share listed companies
refer to enterprises that are listed either sequentially
or concurrently in both Mainland China and Hong
Kong. As of the end of December 2024, 151
companies have opted for dual cross-listing to meet
their corporate development and expansion needs. In
line with the principle of the law of one price, stocks
listed in both places should maintain the same market
price. However, there has been a long-standing AH
share premium for stocks listed in both places.
Some scholars have analysed the causes of AH
share premium from the perspective of traditional
finance, giving explanations from the perspectives of
demand difference, liquidity difference, information
asymmetry and market segmentation (Andy et al.,
1998; Ding, 2023; Ma, 2020; Tan et al., 2017). Since
2014, despite the implementation of liberalization
policies such as the Shanghai-Hong Kong Stock
Connect and the Shenzhen-Hong Kong Stock
a
https://orcid.org/0009-0009-6552-9697
Connect, the AH share premium has not been
narrowed. Therefore, individual stock fundamentals
and market segmentation factors under rational
expectations cannot fully explain the phenomenon of
high AH stock premiums. With the development of
behavioural finance, many scholars try to explain the
discount-premium phenomenon of AH cross-listed
stocks from the perspective of investor sentiment. A
number of studies have shown that investor sentiment
significantly affects the market and has predictive
capacity for stock market premiums (Lu & Zhou,
2015; Liu & Guo ,2022; Zhang et al., 2013). Investor
sentiment may provide a new analytical perspective
to explain the AH stock premium.
Currently, most studies on AH share premiums
focus on the macro perspective. Few studies have
examined the impact of the difference in investor
sentiment between the two places on the AH share
premium from a micro perspective. At the industry
and company level, the semiconductor industry
rebounded in the first three quarters of 2024, with the
global semiconductor market registering a 26% year-
on-year growth in revenue, and the semiconductor
industry is receiving a lot of attention from the global
market. SMIC, a leading domestic foundry, has
successfully jumped to become the world's third
Yin, L.
The Impact of Investor Sentiment Divergence on AH Share Premium: Evidence from SMIC.
DOI: 10.5220/0013832000004719
Paper published under CC license (CC BY-NC-ND 4.0)
In Proceedings of the 2nd International Conference on E-commerce and Modern Logistics (ICEML 2025), pages 15-22
ISBN: 978-989-758-775-7
Proceedings Copyright © 2025 by SCITEPRESS – Science and Technology Publications, Lda.
15
largest foundry for chips after TSMC and Samsung
by increasing its market share to 6% in the third
quarter of 2024. Currently, China's overall domestic
chip self-sufficiency rate is low, and the demand for
domestic substitution is more urgent. With the
increasing support of national policies for the
semiconductor industry, SMIC is expected to gain
more market share in this trend. In addition, SMIC 's
strong market performance is characterized by a
significant AH share premium. In recent years, its
premium has been maintained at a high level for a
long time, even exceeding 200%, which is
representative.
In summary, SMIC 's outstanding performance in
the semiconductor industry and its AH share premium
characteristics make it a typical representative for
studying the impact of investor sentiment differences
between the two places on its AH share premium.
Therefore, this paper selects SMIC as the research
object to explore the impact of investor sentiment
differences between the two places on its AH share
premium.
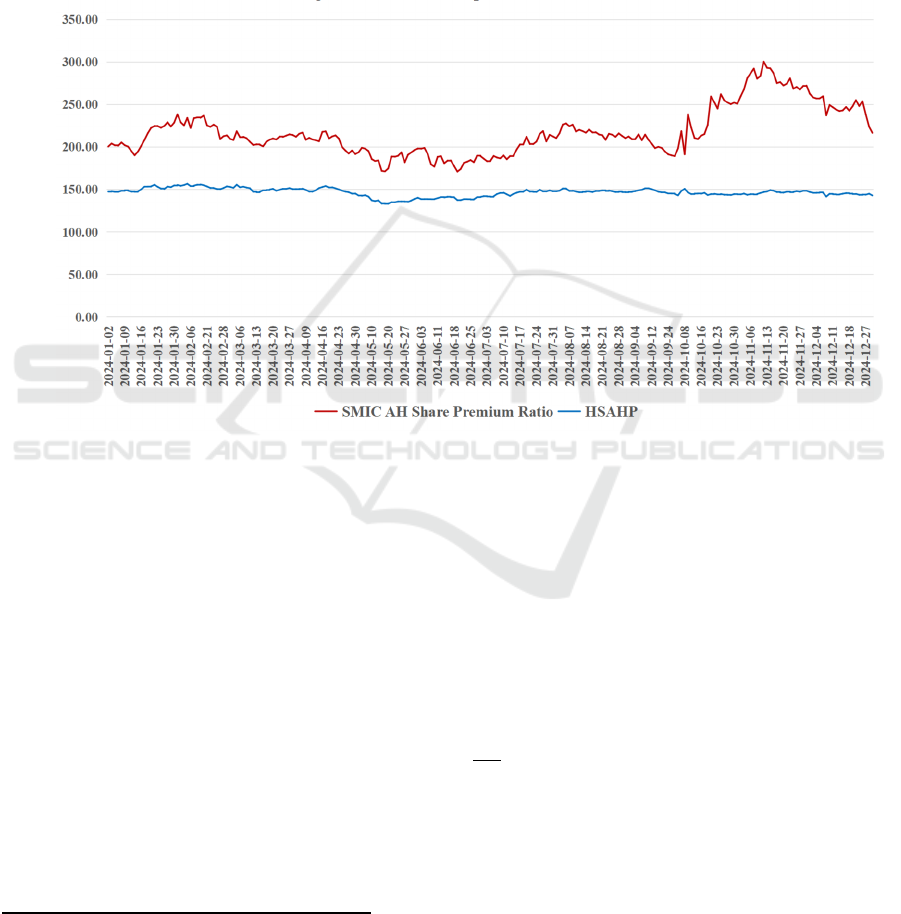
Figure 1: 2024-2025 SMIC AH share premium rate trend chart (Photo/Picture credit: Original).
2 CASE DESCRIPTION AND
RESEARCH HYPOTHESIS
SMIC was respectively listed in Hong Kong and
Shanghai in 2004 and 2020. SMIC is a foundry
offering a wide range of technology nodes from
0.35um to 14nm. Its technology nodes are mainly
used in smartphones, tablets, artificial intelligence,
automotive electronics, and Internet of Things. In
addition, SMIC has a broad customer base, including
well-known chip design companies at home and
abroad, such as Huawei Hesse and Qualcomm and
others. The premium situation in the AH share market
is usually measured by the AH share premium ratio,
which is calculated by the formula:
premium rate =
×
100% (1)
The Hang Seng Shanghai-Shenzhen-Hong Kong
Stock Connect AH Share Premium Index (HSAHP)
is commonly used in the market to reflect the overall
AH share premium. The index selects stocks listed on
both A-share and H-share lists that are eligible for
trading on the Shanghai-Hong Kong Stock Connect
or Shenzhen-Hong Kong Stock Connect as
constituents. The AH share premium of each
constituent is then weighted and averaged by the
outstanding market capitalization weights to arrive at
the overall premium index with the following formula:
HSAHP =
∑
AH share premium of constituent
×
(2)
where α in the formula is the outstanding market
capitalization of A-shares of constituent i, β is the
outstanding market capitalization of H-shares of
constituent i, and γ is the sum of the outstanding
market capitalization of A-shares and H-shares of all
constituents.
To reflect the AH share premium of SMIC, this
paper intercepts the daily closing price of SMIC A
shares after ex-rights, the daily closing price of H
ICEML 2025 - International Conference on E-commerce and Modern Logistics
16
shares after ex-rights, the daily exchange rate of HKD
to CNY, and the HSAHP for the period from January
1, 2024 to January 1, 2025. The trend of SMIC 's AH
share premium from 2024 to 2025 was calculated and
compiled as shown in Figure1.The long-term
fluctuation range of the HSAHP is generally between
130%-150%. As can be seen from Figure 1, SMIC 's
AH share premium has been significantly higher than
the HSAHP for a long period of time, and the
premium has been higher than 200%, or even more
than 300% for a long period of time, which indicates
the anomalous nature of its premium.
Based on the phenomenon of long-term high
premium of SMIC, combined with relevant theories,
this paper puts forward the following hypothesis: the
high premium of SMIC is not only the result of
traditional market segmentation, but also the
differentiated response of investors' sentiment in two
places to favorable policies and industry outlooks,
which leads to the long-term existence of the
premium. This driving mechanism will be verified by
principal component analysis and event study method
in the following section.
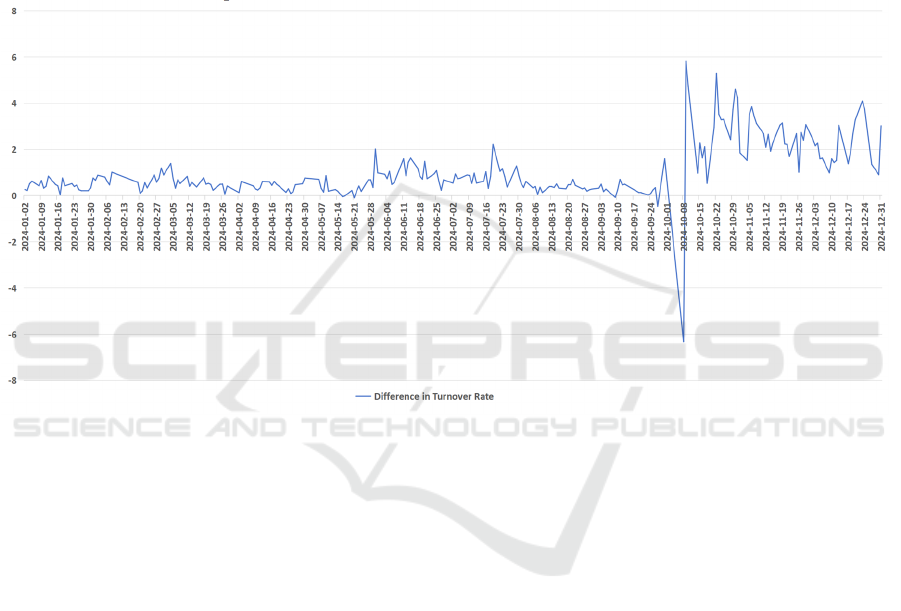
Figure 2: Difference in turnover rate variation analysis (Photo/Picture credit: Original).
3 SYNTHESIS OF SMIC AH-
SHARE INVESTOR
SENTIMENT DIFFERENCE
INDICE
Investor sentiment is observable market behavior that
can be indirectly measured by proxy variables. The
more dominant measure in existing research is the
synthesis of single direct or indirect indicators by
principal component analysis (Baker et al., 2006; Yi
et al., 2009). In order to measure the difference in
investor sentiment between SMIC AH shares, this
paper constructs an index of investor sentiment
difference between SMIC AH shares by principal
component analysis. Three indicators were selected
as proxy variables for this paper. The time span of
the data is from January 1, 2024 to January 1, 2025.
The data frequency is daily data.
The turnover ratio represents the proportion of a
stock's turnover relative to its outstanding share
capital during a specific time period. The turnover
rate reflects the frequency of market trades and
captures investor sentiment differences from the
short-term trading behaviour dimension. The higher
the investor sentiment, the higher the market turnover;
conversely, the lower the investor sentiment, the
lower the market turnover (Yu & Zhong, 2009). In
addition, there are limitations to the turnover ratio. It
is susceptible to short-term noise such as market
rumors and technical adjustments. However, by
analyzing the change in the turnover ratio over a
longer period of time and combining it with other
indicators to make a comprehensive judgment, the
possibility of being misled by short-term noise can be
reduced. The difference in turnover rate quoted in this
article is the difference between the daily turnover
rate in the A-share market and the daily turnover rate
in the H-share market. Figure 2 illustrates the
difference in turnover rate.
The Impact of Investor Sentiment Divergence on AH Share Premium: Evidence from SMIC
17
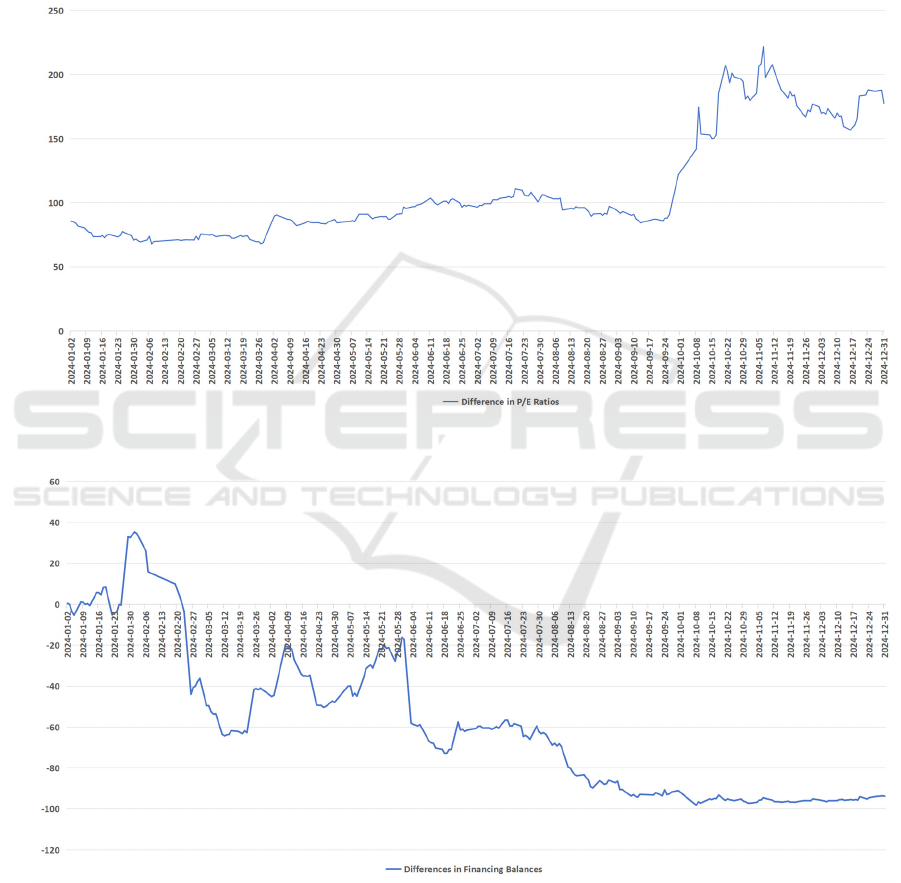
The P/E ratio is calculated by dividing the stock
price by the earnings per share, reflecting investors'
expectations of a company's future earnings. The P/E
ratio is viewed as a common metric for examining
whether a stock's valuation is reasonable. If a
company's P/E ratio is high, this may imply that the
company's stock is overvalued or that investors are
highly optimistic about future growth rates. In
addition, the P/E ratio can reflect investor sentiment
to some extent. Specifically, when investors are
bullish on the prospects of a stock or a company, its
P/E ratio will be high, reflecting high investor
sentiment (Yao et al., 2019) The P/E difference
quoted in this paper is the difference between the
daily rolling P/E of SMIC 's A-share market shares
and the daily rolling P/E of its H-share market shares
(seen from Figure 3).
Figure 3: Difference in P/E ratio variation analysis (Photo/Picture credit: Original).
Figure 4: Difference in the bond borrowing balance variation analysis (Photo/Picture credit: Original).
The bond borrowing balance is the sum of the
amounts investors have borrowed by borrowing
stocks and selling them short. Its change is a direct
reflection of the market's expectation of the future
price of the stock. There have been studies showing
that the bond borrowing balance is a valid indicator
of investor sentiment (Chu & Cao, 2018). The bond
borrowing balance are negatively correlated with
ICEML 2025 - International Conference on E-commerce and Modern Logistics
18

investor sentiment. Specifically, when investor
sentiment is high, the bond borrowing balance is
suppressed by reduced bearish demand. Whereas,
when sentiment is low, short-selling behavior
increases, leading to a rise in the bond borrowing
balance. To address the potential distortion caused by
the scale disparity in bond borrowing balances
between the A-share and H-share markets, this paper
employs the relative difference method to calculate
inter-market variations in bond borrowing balances.
The calculation formula is as follows:
Difference in Bond Borrowing Balance =
×
100% (3)
Here, μ is the balance of A-share bond borrowing and
φ is the balance of H-share bond borrowing.For the
sake of comparability, the H-share bond borrowing
balance in the formula is converted into CNY units
based on the exchange rate of HKD to CNY on the
same day. The analysis of the difference in the bond
borrowing balance is presented in Figure 4.
In this paper, SPSS statistical software is utilized
to implement the dimensionality reduction of the
datasets under principal component analysis. The
time span of the data in this paper is from January 1,
2024 to January 1, 2025, with a total of 233 data sets.
The data are obtained from Oriental Wealth Choice
database, Wind database, etc. In the first step, this
paper standardizes the three aforementioned variables
thereby eliminating the effect of the scale and
obtaining smoother data. In the second step,
correlation analysis between variables is performed.
If there is a strong correlation between the variables
and no multicollinearity it is more suitable for
principal component analysis. As can be seen from
Table 1, all variables are significantly correlated and
the absolute value of correlation coefficient is greater
than 0.3, indicating that principal component analysis
can be performed.
Table 1: Correlation analysis among proxy variables after dimensionless quantification.
Difference in Turnover Rate Difference in P/E Ratios
Difference in
Bond Borrowing Balance
Difference in Turnover Rate 1
Difference in P/E Ratios 0.730** 1
Difference in Bond Borrowing
Balance
-0.412** -0.680** 1
Note: ** indicates significant correlation at the 0.01 level.
Table 2: KMO and Barlett's test of sphericity.
KMO Value 0.577
Bartlett Sphericity Check
Approximate Chi-Square 324.487
df 3
P-Value 0.000
Table 3: Explanation of variance of each component and characteristic root table.
number
Characteristic Root Principal Component Extraction
Characteristic
Root
Variance Explaine
d
Rate%
accumulation
%
Characteristic
Root
Variance Explaine
d
Rate%
accumulation%
1 2.224 74.132 74.132 2.224 74.132 74.132
2 0.590 19.664 93.796 - - -
3 0.186 6.204 100.000 - - -
Table 4: Component matrix.
Variable Name
Variable
Symbol
Ingredient
Ingredient 1
Difference in Turnover Rate a 0.558
Difference in P/E Ratios b 0.632
Difference in Bond Borrowing
Balance
c -0.538
The Impact of Investor Sentiment Divergence on AH Share Premium: Evidence from SMIC
19
In the third step, KMO test and Barlett spherical
test were performed. As shown in Table 1, the KMO
value is 0.570, and the P value of Barlett's spherical
test is less than 0.05. The basic requirements of
principal component analysis are satisfied, and
principal component analysis can be carried out (seen
from Table 2).
The fourth step is to calculate SMIC AH Shares
Investor Sentiment Difference Index. According to
the Kaiser criterion, only principal components with
eigenvalues greater than 1 are retained, as these
principal components explain at least more variation
than one of the original variables. As can be seen from
Table 3, one principal component was extracted to
represent three surrogate variables for principal
component analysis.
In the fifth step, based on the results of the
component matrices in Table 4, the SMIC AH-share
Investor Sentiment Difference Index is synthesized. It
is calculated as follows:
The SMIC AH-share Investor Sentiment Difference
Index=0.558×a+0.632*×b-0.538*×c (4)
Finally, the correlation analysis between the
SMIC AH-share Investor Sentiment Difference Index
and three proxy variables was carried out. The results
are shown in Table 5. As can be seen from Table 5,
there is a significant correlation between the SMIC
AH-share Investor Sentiment Difference Index and
each proxy variable. Therefore, the SMIC AH Share
Investor Sentiment Difference Index can objectively
and accurately reflect the difference in sentiment
between AH investors.
Table 5: Correlation analysis between mood difference index and proxy variables.
The SMIC AH-share Investor Sentiment Difference Index
Difference in Turnover Rate 0.832**
Difference in P/E Ratios 0.942**
Difference in Bond Borrowin
g
Balance
-0.803**
Note: ** indicates significant correlation at the 0.01 level.
Table 6:Correlation analysis between mood difference index and AH share premium ratio.
SMIC AH Share Premium Ratio
The SMIC AH-share Investor Sentiment Difference Index 0.676**
Note: ** indicates significant correlation at the 0.01 level.
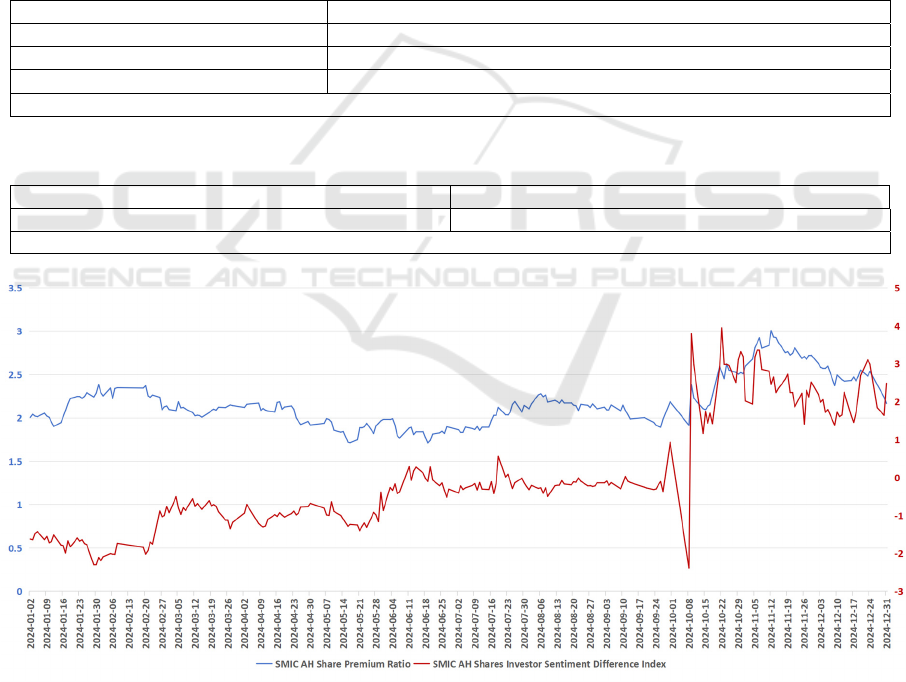
Figure 5: Time Series of the SMIC AH Shares Investor Sentiment Difference Index and SMIC AH Shares Premium Ratio
(Photo/Picture credit: Original).
ICEML 2025 - International Conference on E-commerce and Modern Logistics
20

4 CASE ANALYSIS
The correlation analysis between the SMIC AH-share
Investor Sentiment Difference Index and the
premium rate of SMIC AH shares was analysed. As
shown in Table 6, the SMIC AH-share Investor
Sentiment Difference Index is significantly and
positively correlated with its AH Share premium ratio.
That is, the SMIC AH-share Investor Sentiment
Difference Index is, the larger its AH-share premium
is. To further specifically analyses the relationship
between the two, this paper selects the SMIC AH-
share Investor Sentiment Difference Index and the
SMIC AH-share premium to construct a time series
chart as illustrated in Figure 4. Although the SMIC
AH Shares Investor Sentiment Difference Index and
the AH-share premium show a significant positive
correlation, the volatility trends of the two are
significantly inconsistent in some time periods. This
short-term volatility divergence suggests that investor
sentiment difference is not the only explanatory
variable, although it is an important factor driving the
AH share premium. This phenomenon can be
explained in two ways. On the one hand, there is a lag
effect in the transmission of investor sentiment, and it
takes time for the market to digest the information,
which leads to a lack of synchronization between the
movement of the sentiment difference and the
immediacy of the stock price reaction. On the other
hand, the construction of the sentiment difference
index in this paper is mainly based on the market
behaviour indicators, and the fluctuation of the AH
stock premium may also be affected by the
superimposed impact of other external shocks.
Therefore, the formation mechanism of SMIC 's
AH premium needs to be examined under a more
complex multi-factor framework. In the following
section, the paper will combine the factors of policy
support, geographic risk and industry cycle to reveal
how the interaction of sentiment differences and other
external factors together drive the long-term
deviation of the premium rate.
As the core carrier of China's semiconductor
localization, SMIC's special industry status and
intensive policy support have provided substantial
support for the A-share market's optimistic
expectations, while at the same time magnifying the
H-share market's sensitivity to geopolitical risks. This
dual effect makes the AH share premium a result of
the intertwined effects of policy, industry and
investor sentiment as given in Figure 5.
In 2020, SMIC was listed on the A-share Science
and Technology Innovation Board, raising RMB 53.2
billion. The scale of fundraising has set a record for
IPOs on the Science and Technology Innovation
Board, marking the strategic tilt of the semiconductor
industry at the policy level. In August of the same
year, the State Council of the People's Republic of
China issued the Integrated Circuit Industry Policy,
which provides comprehensive support for the
semiconductor industry chain through tax incentives,
R&D subsidies, and other initiatives. Among them,
SMIC, as an industry leader, was directly supported
by tax breaks and funding. The release of policy
dividends quickly boosted A-share investor
confidence, driving SMIC 's A-share valuation to rise
rapidly, and the AH-share premium rate climbed.
Between 2020 and 2022, the U.S. imposed
multiple rounds of sanctions on SMIC, limiting its
ability to acquire advanced technology and
equipment. In particular, the escalation of export
controls in 2022 caused serious disruptions to SMIC
's supply chain. In response to this event, foreign
institutions in the H-share market reduced their
holdings significantly due to the heightened
geopolitical risks, and the decline in liquidity further
dampened H-share valuations. On the other hand,
investor sentiment in the A-share market continues to
be high as the logic of “domestic substitution”
strengthens. The differentiated reaction of the two
markets to the same event has widened the premium
between A and H shares from 150% in 2020 to 250%
in 2022.
In 2024, the global semiconductor industry
ushered in the recovery, the first three quarters of
revenue growth of 26% year-on-year. During the
same period, the second phase of the National IC
Industry Investment Fund injected capital into SMIC,
and the industry subsidy policy came to fruition,
which directly pushed up the A-share valuation to an
all-time high, with the premium rate exceeding 300%.
However, in December of the same year, the U.S. new
semiconductor equipment export controls, SMIC
accelerated cooperation with local suppliers to
promote domestic equipment replacement process.
Against this backdrop, the A-share market due to
strong policy support for high sentiment to promote
the A-share valuation irrational rise; H-share market
is constrained by the withdrawal of foreign capital
and profitability uncertainty, resulting in low
valuations dominated by market forces. The two-
valuation logic is further polarized, resulting in a
premium rate showing the contradictory state of
“policy pulls up, market depresses”.
In summary, policy support has strengthened the
optimistic expectation of A-shares through industry
status, while geopolitical risks have magnified the
pessimistic expectation of H-shares through foreign
The Impact of Investor Sentiment Divergence on AH Share Premium: Evidence from SMIC
21

investment behaviour, and the superimposed impacts
of policy, industry and investor sentiment have
caused SMIC 's AH-share premium to deviate from
the traditional valuation framework for a long period
of time.
5 CONCLUSIONS
The relative difference in investor sentiment between
the two markets is one of the important reasons
affecting SMIC 's AH premium anomaly, and the
larger the AH investor sentiment difference index is,
the larger its AH premium is. In addition, policy
support strengthens the optimistic expectation of A-
shares through industry status, while geopolitical
risks amplify the pessimistic expectation of H-shares
through foreign investment behaviour. Overall, the
superimposed effects of policy, geopolitical risks,
industry and investor sentiment make SMIC 's high
AH share premium rate persist for a long time. In the
future, with the deepening of the semiconductor
industry's autonomy process and the normalization of
the international game, the interaction between policy
and sentiment may further solidify the structural
characteristics of the AH share premium. In view of
this, the government can embed sentiment
stabilization measures in the semiconductor industry
policy. Through the state-owned capital to increase
holdings of H-shares or the establishment of market
stabilization funds, slowing down the withdrawal of
foreign capital triggered by irrational pessimistic
expectations, guiding H-share investors to rationally
assess the long-term value of domestic substitution.
This paper contains two shortcomings. First, the
construction of the sentiment difference index in this
paper is mainly based on objective sentiment
indicators of market behaviour and does not
incorporate subjective sentiment indicators such as
investor confidence indicators. Second, when this
paper constructs the sentiment difference index from
the perspective of behavioural finance, it does not
control the important external conditions used to
explain the AH stock premium phenomenon under
the traditional finance perspective such as the AH
stock liquidity difference, which may have a certain
impact on the results of the study. Based on the above
shortcomings, in the future, a sentiment index can be
constructed that encompasses both objective and
subjective investor sentiment indicators, while
controlling for the same external conditions such as
AH stock liquidity differences.
REFERENCES
Andy, C. W. Chui, C., Chuck., 1998. Cross-auto correlation
between A shares and B shares in the Chinese stock
market. Journal of Financial Research, 21(3), 333-353
Baker, M., Jeffrey W., 2006. Investor Sentiment and the
Cross-Section of Stock Returns. Journal of Finance,
611, 1645-1680
Chu, X., Cao, J., 2018. Does financing and bonding amplify
investor sentiment effects. Securities Market Herald, 9,
22-30.
Ding, X., 2023. The Impact of Investor Sentiment on AH
Share Premiums. Suzhou University of Science and
Technology.
Lu, J., Zhou, Y., 2015. The Impact of Investor Sentiment
on Stock Prices: An Empirical Analysis Based on
Cross-listed AH Stocks. Chinese Journal of
Management Science, 23(11), 21-28.
Liu, L., Guo, L., 2022. Can sentiment differences explain
the AH share premium. Modern Finance and
Economics-Journal of Tianjin University of Finance
and Economics, 42(01), 66-80.
Ma, Y., 2020. Research on China's AH Stock Premium
Problem: An Empirical Analysis Based on Liquidity
Perspective. Modern Business, 23, 144-145.
Tan, X., Liu, H., Cao, Q., 2017. Does Capital Account
Liberalization Reduce the Premium of AH Stocks: An
empirical study based on panel data of AH stocks
before and after the opening of Shanghai-Hong Kong
Stock Connect. China Soft Sciences, 11, 39-53.
Yi, Z., Mao, N., 2009. Measuring Investor Sentiment in the
Chinese Stock Market: The Construction of the CICSI.
Journal of Financial Research, 11, 174-184.
Yu, P., Zhong, R., 2009. Can Individual Investor Sentiment
Predict Market Returns. Nankai Business Review,
12(01), 96-101.
Yao, Y., Yao, B., Zhong, Q., 2019. Research on the Impact
of Investors' Sentiment on Stock Returns: An Empirical
Analysis Based on SSE A-Share Data. Price: Theory &
Practice, 5, 88-91.
Zhang, T., Yu, J., Lv, D., 2013. Investor Sentiment and
Value Premium Anomalies in Emerging Markets: A
Comparative Analysis Based on Mainland China, Hong
Kong and Taiwan. Studies of International Finance, 1,
87-95.
ICEML 2025 - International Conference on E-commerce and Modern Logistics
22
